Deck 7: The Normal Distribution
Full screen (f)
Question
Question
A normal population has a mean  and standard deviation
  What is the probability that a randomly chosen value will be greater than 36?
A) 0.8485
B) 0.7257
C) 0.1210
D) 0.8790
and standard deviation What is the probability that a randomly chosen value will be greater than 36?A) 0.8485
B) 0.7257
C) 0.1210
D) 0.8790
Question
A normal population has a mean  and standard deviation
  What proportion of the population is less than 39?
A) 0.2743
B) 0.8106
C) 1.0000
D) 0.7257
and standard deviation What proportion of the population is less than 39?A) 0.2743
B) 0.8106
C) 1.0000
D) 0.7257
Question
Find the shaded area under the standard normal curve. 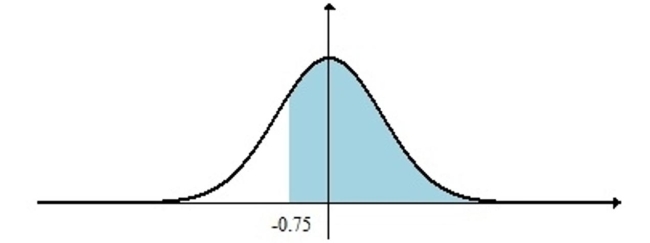
A) 0.3867
B) 0.2734
C) 0.2266
D) 0.7734
A) 0.3867
B) 0.2734
C) 0.2266
D) 0.7734
Question
Find the shaded area under the standard normal curve. 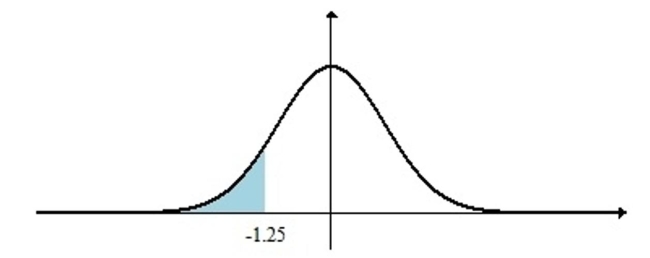
A) 0.8944
B) 0.0528
C) 0.3944
D) 0.1056
A) 0.8944
B) 0.0528
C) 0.3944
D) 0.1056
Question
Question
Question
The following figure is a probability density curve that represents the lifetime, in months, of a certain type of laptop battery. 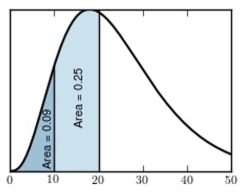 Find the proportion of batteries with lifetimes between 10 and 20 months.
A) 0.34
B) 0.09
C) 0.66
D) 0.25
Find the proportion of batteries with lifetimes between 10 and 20 months.A) 0.34
B) 0.09
C) 0.66
D) 0.25
Question
Question
Use technology to solve the following problem: A normal population has a mean  and standard deviation
  What proportion of the population is less than 41?
A) 0.8275
B) 0.7625
C) 0.2375
D) 1.0000
and standard deviation What proportion of the population is less than 41?A) 0.8275
B) 0.7625
C) 0.2375
D) 1.0000
Question
The following figure is a probability density curve that represents the lifetime, in months, of a certain type of laptop battery. 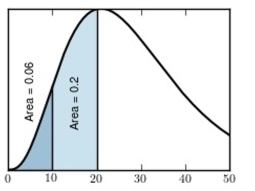 Find the proportion of batteries with lifetimes less than 20 months.
A) 0.26
B) 0.20
C) 0.8
D) 0.06
Find the proportion of batteries with lifetimes less than 20 months.A) 0.26
B) 0.20
C) 0.8
D) 0.06
Question
Find the shaded area under the standard normal curve. 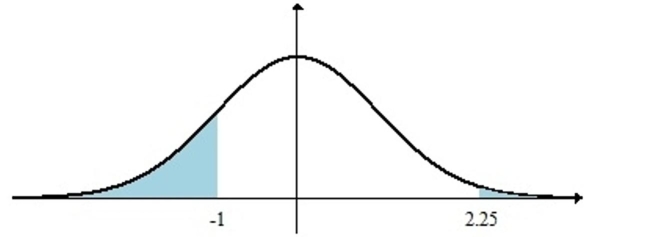
A) 0.8291
B) 0.4878
C) 0.0854
D) 0.1709
A) 0.8291
B) 0.4878
C) 0.0854
D) 0.1709
Question
Question
The following figure is a probability density curve that represents the lifetime, in months, of a certain type of laptop battery. 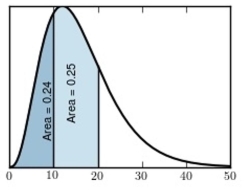 What is the probability that a randomly chosen battery lasts longer than 20 months?
A) 0.51
B) 0.25
C) 0.49
D) 0.24
What is the probability that a randomly chosen battery lasts longer than 20 months?A) 0.51
B) 0.25
C) 0.49
D) 0.24
Question
Question
Find the shaded area under the standard normal curve. 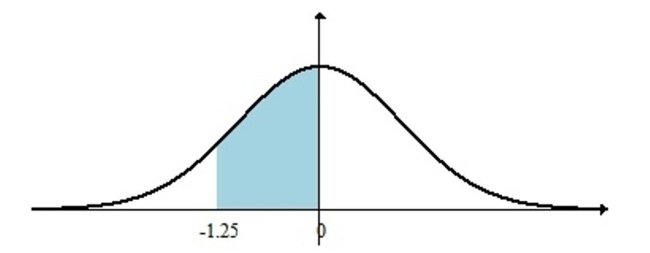
A) 0.5000
B) 0.6056
C) 0.3944
D) 0.1972
A) 0.5000
B) 0.6056
C) 0.3944
D) 0.1972
Question
Question
Question
Question
A normal distribution has mean  =60 and standard deviation
  =20 . Find and interpret the z-score for x=90.
A) z=-1.50 : a value of 90 is 1.50 standard deviations below the mean.
B) z=10 : a value of 90 is 10 standard deviations below the mean.
C) z=1.50 : a value of 90 is 1.50 standard deviations above the mean.
D) z=2.25 : a value of 90 is 2.25 standard deviations above the mean.
=60 and standard deviation =20 . Find and interpret the z-score for x=90.A) z=-1.50 : a value of 90 is 1.50 standard deviations below the mean.
B) z=10 : a value of 90 is 10 standard deviations below the mean.
C) z=1.50 : a value of 90 is 1.50 standard deviations above the mean.
D) z=2.25 : a value of 90 is 2.25 standard deviations above the mean.
Question
Question
Question
Question
Question
Question
Question
Question
Use technology to solve the following problem: A normal population has a mean  and standard deviation
  What proportion of the population is between 18 and 26?
A) 0.3217
B) 0.0478
C) 0.6783
D) 0.3694
and standard deviation What proportion of the population is between 18 and 26?A) 0.3217
B) 0.0478
C) 0.6783
D) 0.3694
Question
A normal population has a mean  and standard deviation
  . What proportion of the population is between 23 and 32?
A) 0.6306
B) 0.2177
C) 0.3694
D) 0.5871
and standard deviation . What proportion of the population is between 23 and 32?A) 0.6306
B) 0.2177
C) 0.3694
D) 0.5871
Question
Question
Question
Use technology to solve the following problem: A normal population has a mean  and standard deviation
  What is the probability that a randomly chosen value will be greater than
18?
A) 0.9684
B) 0.6386
C) 0.9088
D) 0.0316
and standard deviation What is the probability that a randomly chosen value will be greater than18?
A) 0.9684
B) 0.6386
C) 0.9088
D) 0.0316
Question
Use technology to solve the following problem: A normal population has a mean  and standard deviation
  What is the 58th percentile of the population?
A) 29.60
B) 26.64
C) 32.56
D) 35.52
and standard deviation What is the 58th percentile of the population?A) 29.60
B) 26.64
C) 32.56
D) 35.52
Question
Question
A normal population has a mean  and standard deviation
  . What is the 43rd percentile of the population?
A) 15.00
B) 12.28
C) 16.37
D) 13.64
and standard deviation . What is the 43rd percentile of the population?A) 15.00
B) 12.28
C) 16.37
D) 13.64
Question
Question
Question
Question
Question
Question
Use technology to solve the following problem: A sample of size 70 will be drawn from a population with mean 25 and standard deviation 11. Find the probability that  will be between 23
And 26.
A) 0.2234
B) 0.0641
C) 0.6789
D) 0.7124
will be between 23And 26.
A) 0.2234
B) 0.0641
C) 0.6789
D) 0.7124
Question
A sample of size 50 will be drawn from a population with mean 73 and standard deviation 8. Find the 19th percentile of 
A) 73.8
B) 75.8
C) 72.0
D) 75.7
A) 73.8
B) 75.8
C) 72.0
D) 75.7
Question
The lifetime of a certain type of automobile tire (in thousands of miles) is normally distributed with mean  and standard deviation
  . What proportion of tires have lifetimes of less than 42
Thousand miles?
A) 0.3070
B) 0.6930
C) 0.3859
D) 0.6141
and standard deviation . What proportion of tires have lifetimes of less than 42Thousand miles?
A) 0.3070
B) 0.6930
C) 0.3859
D) 0.6141
Question
Question
The lifetime of a certain type of automobile tire (in thousands of miles) is normally distributed with mean  and standard deviation
  . What proportion of tires have lifetimes between 40 and
50 thousand miles?
A) 0.6450
B) 2.0000
C) 0.3550
D) 1.1935
and standard deviation . What proportion of tires have lifetimes between 40 and50 thousand miles?
A) 0.6450
B) 2.0000
C) 0.3550
D) 1.1935
Question
A sample of size 85 will be drawn from a population with mean 20 and standard deviation 8. Find the probability that  will be between 19 and 22.
A) 0.8256
B) 0.8642
C) 0.0107
D) 0.1251
will be between 19 and 22.A) 0.8256
B) 0.8642
C) 0.0107
D) 0.1251
Question
Question
Question
Question
Use technology to solve the following problem: The lifetime of a certain type of automobile tire (in thousands of miles) is normally distributed with mean  and standard deviation
  . What
Proportion of tires have lifetimes greater than 32 thousand miles?
A) 0.9544
B) 0.9088
C) 0.0456
D) 0.0912
and standard deviation . WhatProportion of tires have lifetimes greater than 32 thousand miles?
A) 0.9544
B) 0.9088
C) 0.0456
D) 0.0912
Question
Question
Question
Question
The lifetime of a certain type of automobile tire (in thousands of miles) is normally distributed with mean  and standard deviation
  . What proportion of tires have lifetimes greater than 48
Thousand miles?
A) 0.4666
B) 0.0668
C) 0.5334
D) 0.9332
and standard deviation . What proportion of tires have lifetimes greater than 48Thousand miles?
A) 0.4666
B) 0.0668
C) 0.5334
D) 0.9332
Question
Question
Use technology to solve the following problem: The lifetime of a certain type of automobile tire (in thousands of miles) is normally distributed with mean  and standard deviation
  . What
Proportion of tires have lifetimes of less than 49 thousand miles?
A) 0.1056
B) 0.4472
C) 0.8944
D) 0.5528
and standard deviation . WhatProportion of tires have lifetimes of less than 49 thousand miles?
A) 0.1056
B) 0.4472
C) 0.8944
D) 0.5528
Question
Question
A sample of size 39 will be drawn from a population with mean 15 and standard deviation 6. Find the probability that  will be greater than 16.
A) 0.1271
B) 0.1170
C) 0.1492
D) 0.8508
will be greater than 16.A) 0.1271
B) 0.1170
C) 0.1492
D) 0.8508
Question
Use technology to solve the following problem: The lifetime of a certain type of automobile tire (in thousands of miles) is normally distributed with mean  and standard deviation
  . What
Proportion of tires have lifetimes between 33 and 48 thousand miles?
A) 1.1980
B) 0.7742
C) 3.0000
D) 0.2258
and standard deviation . WhatProportion of tires have lifetimes between 33 and 48 thousand miles?
A) 1.1980
B) 0.7742
C) 3.0000
D) 0.2258
Question
Use technology to solve the following problem: A sample of size 45 will be drawn from a population with mean 94 and standard deviation 14. Find the 32nd percentile of 
A) 97.7
B) 93.0
C) 95.4
D) 91.2
A) 97.7
B) 93.0
C) 95.4
D) 91.2
Question
Question
Question
Question
Question
Question
Use technology to solve the following problem: A sample of size 51 will be drawn from a population with mean 11 and standard deviation 7. Find the probability that  will be less than 12.
A) 0.8106
B) 0.8462
C) 0.8390
D) 0.1538
will be less than 12.A) 0.8106
B) 0.8462
C) 0.8390
D) 0.1538
Question
A sample of size 56 will be drawn from a population with mean 26 and standard deviation 11. Find the probability that  will be less than 28.
A) 0.9131
B) 0.0869
C) 0.9394
D) 0.9406
will be less than 28.A) 0.9131
B) 0.0869
C) 0.9394
D) 0.9406
Question
Question
Question
Question
Question
Question
Question
Use technology to solve the following problem: A sample of size 52 will be drawn from a population with mean 11 and standard deviation 11. Find the probability that  will be greater than
13)
A) 0.1001
B) 0.0667
C) 0.0949
D) 0.9051
will be greater than13)
A) 0.1001
B) 0.0667
C) 0.0949
D) 0.9051
Question
Question
Question
Question
Question
Question

Unlock Deck
Sign up to unlock the cards in this deck!
Unlock Deck
Unlock Deck
1/131
Play
Full screen (f)
Deck 7: The Normal Distribution
1
Find the z-scores that bound the middle 60% of the area under the standard normal curve.
A) -0.84, 0.84
B) -1.02, 1.02
C) -0.97, 0.97
D) -0.78, 0.78
A) -0.84, 0.84
B) -1.02, 1.02
C) -0.97, 0.97
D) -0.78, 0.78
-0.84, 0.84
2
A normal population has a mean and standard deviation What is the probability that a randomly chosen value will be greater than 36?
A) 0.8485
B) 0.7257
C) 0.1210
D) 0.8790
and standard deviation What is the probability that a randomly chosen value will be greater than 36?A) 0.8485
B) 0.7257
C) 0.1210
D) 0.8790
0.1210
3
A normal population has a mean and standard deviation What proportion of the population is less than 39?
A) 0.2743
B) 0.8106
C) 1.0000
D) 0.7257
and standard deviation What proportion of the population is less than 39?A) 0.2743
B) 0.8106
C) 1.0000
D) 0.7257
0.7257
4
Find the shaded area under the standard normal curve.
A) 0.3867
B) 0.2734
C) 0.2266
D) 0.7734
A) 0.3867
B) 0.2734
C) 0.2266
D) 0.7734
Unlock Deck
Unlock for access to all 131 flashcards in this deck.
Unlock Deck
k this deck
5
Find the shaded area under the standard normal curve.
A) 0.8944
B) 0.0528
C) 0.3944
D) 0.1056
A) 0.8944
B) 0.0528
C) 0.3944
D) 0.1056
Unlock Deck
Unlock for access to all 131 flashcards in this deck.
Unlock Deck
k this deck
6
Find the area under the standard normal curve to the right of z = 1.6.
A) 0.4452
B) 0.0548
C) 0.9452
D) 0.0274
A) 0.4452
B) 0.0548
C) 0.9452
D) 0.0274
Unlock Deck
Unlock for access to all 131 flashcards in this deck.
Unlock Deck
k this deck
7
Find the area under the standard normal curve that lies outside the interval between z = -1.4 and z = -0.5.
A) 0.2278
B) 0.1915
C) 0.7722
D) 0.8085
A) 0.2278
B) 0.1915
C) 0.7722
D) 0.8085
Unlock Deck
Unlock for access to all 131 flashcards in this deck.
Unlock Deck
k this deck
8
The following figure is a probability density curve that represents the lifetime, in months, of a certain type of laptop battery. Find the proportion of batteries with lifetimes between 10 and 20 months.
A) 0.34
B) 0.09
C) 0.66
D) 0.25
Find the proportion of batteries with lifetimes between 10 and 20 months.A) 0.34
B) 0.09
C) 0.66
D) 0.25
Unlock Deck
Unlock for access to all 131 flashcards in this deck.
Unlock Deck
k this deck
9
Find the z-score for which the area to the right is 0.92.
A) -1.22
B) -1.68
C) -1.60
D) -1.41
A) -1.22
B) -1.68
C) -1.60
D) -1.41
Unlock Deck
Unlock for access to all 131 flashcards in this deck.
Unlock Deck
k this deck
10
Use technology to solve the following problem: A normal population has a mean and standard deviation What proportion of the population is less than 41?
A) 0.8275
B) 0.7625
C) 0.2375
D) 1.0000
and standard deviation What proportion of the population is less than 41?A) 0.8275
B) 0.7625
C) 0.2375
D) 1.0000
Unlock Deck
Unlock for access to all 131 flashcards in this deck.
Unlock Deck
k this deck
11
The following figure is a probability density curve that represents the lifetime, in months, of a certain type of laptop battery. Find the proportion of batteries with lifetimes less than 20 months.
A) 0.26
B) 0.20
C) 0.8
D) 0.06
Find the proportion of batteries with lifetimes less than 20 months.A) 0.26
B) 0.20
C) 0.8
D) 0.06
Unlock Deck
Unlock for access to all 131 flashcards in this deck.
Unlock Deck
k this deck
12
Find the shaded area under the standard normal curve.
A) 0.8291
B) 0.4878
C) 0.0854
D) 0.1709
A) 0.8291
B) 0.4878
C) 0.0854
D) 0.1709
Unlock Deck
Unlock for access to all 131 flashcards in this deck.
Unlock Deck
k this deck
13
Find the z-score for which the area to the left is 0.79.
A) 0.58
B) 0.64
C) 0.81
D) 1.04
A) 0.58
B) 0.64
C) 0.81
D) 1.04
Unlock Deck
Unlock for access to all 131 flashcards in this deck.
Unlock Deck
k this deck
14
The following figure is a probability density curve that represents the lifetime, in months, of a certain type of laptop battery. What is the probability that a randomly chosen battery lasts longer than 20 months?
A) 0.51
B) 0.25
C) 0.49
D) 0.24
What is the probability that a randomly chosen battery lasts longer than 20 months?A) 0.51
B) 0.25
C) 0.49
D) 0.24
Unlock Deck
Unlock for access to all 131 flashcards in this deck.
Unlock Deck
k this deck
15
Find the area under the standard normal curve that lies between z = 0.5 and z = 2.8.
A) 0.5026
B) 0.6940
C) 0.3060
D) 0.4974
A) 0.5026
B) 0.6940
C) 0.3060
D) 0.4974
Unlock Deck
Unlock for access to all 131 flashcards in this deck.
Unlock Deck
k this deck
16
Find the shaded area under the standard normal curve.
A) 0.5000
B) 0.6056
C) 0.3944
D) 0.1972
A) 0.5000
B) 0.6056
C) 0.3944
D) 0.1972
Unlock Deck
Unlock for access to all 131 flashcards in this deck.
Unlock Deck
k this deck
17
Compact fluorescent bulbs are more energy-efficient than incandescent bulbs, but they take longer to reach full brightness. The time it takes for a compact fluorescent bulb to reach full brightness is normally distributed with mean 29.9 seconds and standard deviation 4.9 seconds. Find and interpret the z-score for x=26.1.
A) z=0.71: the time to reach full brightness is 0.71 standard deviations above the mean.
B) z=0.71: the time to reach full brightness is 0.71 standard deviations below the mean.
C) z=-0.78 : the time to reach full brightness is 0.78 standard deviations below the mean.
D) z=-0.78: the time to reach full brightness is 0.78 standard deviations above the mean.
Unlock Deck
Unlock for access to all 131 flashcards in this deck.
Unlock Deck
k this deck
18
Find the area under the standard normal curve to the left of z = 0.8.
A) 0.2881
B) 0.2119
C) 0.7881
D) 0.3941
A) 0.2881
B) 0.2119
C) 0.7881
D) 0.3941
Unlock Deck
Unlock for access to all 131 flashcards in this deck.
Unlock Deck
k this deck
19
A normal distribution has mean μ = 16 and standard deviation σ = 3. Find and interpret the z-score for x = 13.
A) z = -3: a value of 13 is one standard deviation below the mean.
B) z = 19: a value of 13 is one standard deviation above the mean.
C) z = 1: a value of 13 is one standard deviation above the mean.
D) z = -1: a value of 13 is one standard deviation below the mean.
A) z = -3: a value of 13 is one standard deviation below the mean.
B) z = 19: a value of 13 is one standard deviation above the mean.
C) z = 1: a value of 13 is one standard deviation above the mean.
D) z = -1: a value of 13 is one standard deviation below the mean.
Unlock Deck
Unlock for access to all 131 flashcards in this deck.
Unlock Deck
k this deck
20
A normal distribution has mean =60 and standard deviation =20 . Find and interpret the z-score for x=90.
A) z=-1.50 : a value of 90 is 1.50 standard deviations below the mean.
B) z=10 : a value of 90 is 10 standard deviations below the mean.
C) z=1.50 : a value of 90 is 1.50 standard deviations above the mean.
D) z=2.25 : a value of 90 is 2.25 standard deviations above the mean.
=60 and standard deviation =20 . Find and interpret the z-score for x=90.A) z=-1.50 : a value of 90 is 1.50 standard deviations below the mean.
B) z=10 : a value of 90 is 10 standard deviations below the mean.
C) z=1.50 : a value of 90 is 1.50 standard deviations above the mean.
D) z=2.25 : a value of 90 is 2.25 standard deviations above the mean.
Unlock Deck
Unlock for access to all 131 flashcards in this deck.
Unlock Deck
k this deck
21
Use technology to solve the following problem: A bottler of drinking water fills plastic bottles with a mean volume of 1,000 milliliters (mL) and standard deviation 7 mL. The fill volumes are normally
Distributed. What proportion of bottles have volumes greater than 1,002 mL?
A) 1.0000
B) 0.9568
C) 0.6575
D) 0.3875
Distributed. What proportion of bottles have volumes greater than 1,002 mL?
A) 1.0000
B) 0.9568
C) 0.6575
D) 0.3875
Unlock Deck
Unlock for access to all 131 flashcards in this deck.
Unlock Deck
k this deck
22
Use technology to solve the following problem: A recent study reported that diastolic blood pressures of adult women in the United States are approximately normally distributed with mean
80)8 and standard deviation 9.2. What proportion of women have blood pressures between 70.4 and
83)4?
A) 0.4821
B) 1.4130
C) 0.7404
D) 0.5179
80)8 and standard deviation 9.2. What proportion of women have blood pressures between 70.4 and
83)4?
A) 0.4821
B) 1.4130
C) 0.7404
D) 0.5179
Unlock Deck
Unlock for access to all 131 flashcards in this deck.
Unlock Deck
k this deck
23
Use technology to solve the following problem: A bottler of drinking water fills plastic bottles with a mean volume of 1,002 milliliters (mL) and standard deviation 4 mL. The fill volumes are normally
Distributed. What proportion of bottles have volumes less than 1,002 mL?
A) 0.5517
B) 1.0000
C) 0.5000
D) 0.9987
Distributed. What proportion of bottles have volumes less than 1,002 mL?
A) 0.5517
B) 1.0000
C) 0.5000
D) 0.9987
Unlock Deck
Unlock for access to all 131 flashcards in this deck.
Unlock Deck
k this deck
24
The weights of 6-week-old poults (juvenile turkeys) are normally distributed with a mean 9.0 pounds and standard deviation 2.5 pound(s). Find the 75th percentile of the weights.
A) 11.74 lb
B) 10.67 lb
C) 8.54 lb
D) 9.60 lb
A) 11.74 lb
B) 10.67 lb
C) 8.54 lb
D) 9.60 lb
Unlock Deck
Unlock for access to all 131 flashcards in this deck.
Unlock Deck
k this deck
25
A recent study reported that diastolic blood pressures of adult women in the United States are approximately normally distributed with mean 80.1 and standard deviation 9.5. What proportion of
Women have blood pressures lower than 67.9?
A) 0.0501
B) 0.9499
C) 0.8997
D) 0.1003
Women have blood pressures lower than 67.9?
A) 0.0501
B) 0.9499
C) 0.8997
D) 0.1003
Unlock Deck
Unlock for access to all 131 flashcards in this deck.
Unlock Deck
k this deck
26
A bottler of drinking water fills plastic bottles with a mean volume of 1,007 milliliters (mL) and standard deviation 6 mL. The fill volumes are normally distributed. What proportion of bottles have
Volumes less than 1,015 mL?
A) 1.0000
B) 0.9082
C) 0.6293
D) 0.9251
Volumes less than 1,015 mL?
A) 1.0000
B) 0.9082
C) 0.6293
D) 0.9251
Unlock Deck
Unlock for access to all 131 flashcards in this deck.
Unlock Deck
k this deck
27
A bottler of drinking water fills plastic bottles with a mean volume of 998 milliliters (mL) and standard deviation 7 mL. The fill volumes are normally distributed. What proportion of bottles have
Volumes between 988 mL and 991 mL?
A) 0.0764
B) 0.4549
C) 0.0823
D) 0.1587
Volumes between 988 mL and 991 mL?
A) 0.0764
B) 0.4549
C) 0.0823
D) 0.1587
Unlock Deck
Unlock for access to all 131 flashcards in this deck.
Unlock Deck
k this deck
28
Use technology to solve the following problem: A normal population has a mean and standard deviation What proportion of the population is between 18 and 26?
A) 0.3217
B) 0.0478
C) 0.6783
D) 0.3694
and standard deviation What proportion of the population is between 18 and 26?A) 0.3217
B) 0.0478
C) 0.6783
D) 0.3694
Unlock Deck
Unlock for access to all 131 flashcards in this deck.
Unlock Deck
k this deck
29
A normal population has a mean and standard deviation . What proportion of the population is between 23 and 32?
A) 0.6306
B) 0.2177
C) 0.3694
D) 0.5871
and standard deviation . What proportion of the population is between 23 and 32?A) 0.6306
B) 0.2177
C) 0.3694
D) 0.5871
Unlock Deck
Unlock for access to all 131 flashcards in this deck.
Unlock Deck
k this deck
30
Use technology to solve the following problem: A recent study reported that diastolic blood pressures of adult women in the United States are approximately normally distributed with mean
80)9 and standard deviation 8.8. What proportion of women have blood pressures lower than 65.8?
A) 0.9569
B) 0.9785
C) 0.0431
D) 0.0215
80)9 and standard deviation 8.8. What proportion of women have blood pressures lower than 65.8?
A) 0.9569
B) 0.9785
C) 0.0431
D) 0.0215
Unlock Deck
Unlock for access to all 131 flashcards in this deck.
Unlock Deck
k this deck
31
A bottler of drinking water fills plastic bottles with a mean volume of 1,006 milliliters (mL) and standard deviation 6 mL. The fill volumes are normally distributed. What proportion of bottles have
Volumes greater than 1,009 mL?
A) 1.0000
B) 0.9998
C) 0.6331
D) 0.3085
Volumes greater than 1,009 mL?
A) 1.0000
B) 0.9998
C) 0.6331
D) 0.3085
Unlock Deck
Unlock for access to all 131 flashcards in this deck.
Unlock Deck
k this deck
32
Use technology to solve the following problem: A normal population has a mean and standard deviation What is the probability that a randomly chosen value will be greater than
18?
A) 0.9684
B) 0.6386
C) 0.9088
D) 0.0316
and standard deviation What is the probability that a randomly chosen value will be greater than18?
A) 0.9684
B) 0.6386
C) 0.9088
D) 0.0316
Unlock Deck
Unlock for access to all 131 flashcards in this deck.
Unlock Deck
k this deck
33
Use technology to solve the following problem: A normal population has a mean and standard deviation What is the 58th percentile of the population?
A) 29.60
B) 26.64
C) 32.56
D) 35.52
and standard deviation What is the 58th percentile of the population?A) 29.60
B) 26.64
C) 32.56
D) 35.52
Unlock Deck
Unlock for access to all 131 flashcards in this deck.
Unlock Deck
k this deck
34
Use technology to solve the following problem: A recent study reported that diastolic blood pressures of adult women in the United States are approximately normally distributed with mean
80)6 and standard deviation 9.9. What proportion of women have blood pressures higher than 85.8?
A) 0.7003
B) 0.3501
C) 0.6499
D) 0.2997
80)6 and standard deviation 9.9. What proportion of women have blood pressures higher than 85.8?
A) 0.7003
B) 0.3501
C) 0.6499
D) 0.2997
Unlock Deck
Unlock for access to all 131 flashcards in this deck.
Unlock Deck
k this deck
35
A normal population has a mean and standard deviation . What is the 43rd percentile of the population?
A) 15.00
B) 12.28
C) 16.37
D) 13.64
and standard deviation . What is the 43rd percentile of the population?A) 15.00
B) 12.28
C) 16.37
D) 13.64
Unlock Deck
Unlock for access to all 131 flashcards in this deck.
Unlock Deck
k this deck
36
A recent study reported that diastolic blood pressures of adult women in the United States are approximately normally distributed with mean 80.3 and standard deviation 8.6. What proportion of
Women have blood pressures between 88.1 and 89.4?
A) 0.9632
B) 0.0368
C) 1.6740
D) 0.1500
Women have blood pressures between 88.1 and 89.4?
A) 0.9632
B) 0.0368
C) 1.6740
D) 0.1500
Unlock Deck
Unlock for access to all 131 flashcards in this deck.
Unlock Deck
k this deck
37
A recent study reported that diastolic blood pressures of adult women in the United States are approximately normally distributed with mean 80.3 and standard deviation 8.9. What proportion of
Women have blood pressures higher than 85.8?
A) 0.3662
B) 0.7324
C) 0.2676
D) 0.6338
Women have blood pressures higher than 85.8?
A) 0.3662
B) 0.7324
C) 0.2676
D) 0.6338
Unlock Deck
Unlock for access to all 131 flashcards in this deck.
Unlock Deck
k this deck
38
The weights of 6-week-old poults (juvenile turkeys) are normally distributed with a mean 8.5 pounds and standard deviation 1.4 pounds. Find the first quartile of the weight.
A) 6.05 lb
B) 9.07 lb
C) 6.80 lb
D) 7.56 lb
A) 6.05 lb
B) 9.07 lb
C) 6.80 lb
D) 7.56 lb
Unlock Deck
Unlock for access to all 131 flashcards in this deck.
Unlock Deck
k this deck
39
Use technology to solve the following problem: A bottler of drinking water fills plastic bottles with a mean volume of 990 milliliters (mL) and standard deviation 7 mL. The fill volumes are normally
Distributed. What proportion of bottles have volumes between 985 mL and 988 mL?
A) 0.3875
B) 0.2375
C) 0.3603
D) 0.1500
Distributed. What proportion of bottles have volumes between 985 mL and 988 mL?
A) 0.3875
B) 0.2375
C) 0.3603
D) 0.1500
Unlock Deck
Unlock for access to all 131 flashcards in this deck.
Unlock Deck
k this deck
40
Use technology to solve the following problem: The weights of 6-week-old poults (juvenile turkeys) are normally distributed with a mean 8.7 pounds and standard deviation 2.0 pound(s). Find the 84th
Percentile of the weights.
A) 10.68 lb
B) 12.82 lb
C) 8.54 lb
D) 11.75 lb
Percentile of the weights.
A) 10.68 lb
B) 12.82 lb
C) 8.54 lb
D) 11.75 lb
Unlock Deck
Unlock for access to all 131 flashcards in this deck.
Unlock Deck
k this deck
41
Use technology to solve the following problem: A sample of size 70 will be drawn from a population with mean 25 and standard deviation 11. Find the probability that will be between 23
And 26.
A) 0.2234
B) 0.0641
C) 0.6789
D) 0.7124
will be between 23And 26.
A) 0.2234
B) 0.0641
C) 0.6789
D) 0.7124
Unlock Deck
Unlock for access to all 131 flashcards in this deck.
Unlock Deck
k this deck
42
A sample of size 50 will be drawn from a population with mean 73 and standard deviation 8. Find the 19th percentile of
A) 73.8
B) 75.8
C) 72.0
D) 75.7
A) 73.8
B) 75.8
C) 72.0
D) 75.7
Unlock Deck
Unlock for access to all 131 flashcards in this deck.
Unlock Deck
k this deck
43
The lifetime of a certain type of automobile tire (in thousands of miles) is normally distributed with mean and standard deviation . What proportion of tires have lifetimes of less than 42
Thousand miles?
A) 0.3070
B) 0.6930
C) 0.3859
D) 0.6141
and standard deviation . What proportion of tires have lifetimes of less than 42Thousand miles?
A) 0.3070
B) 0.6930
C) 0.3859
D) 0.6141
Unlock Deck
Unlock for access to all 131 flashcards in this deck.
Unlock Deck
k this deck
44
Use technology to solve the following problem: The weights of 6-week-old poults (juvenile turkeys) are normally distributed with a mean 9.1 pounds and standard deviation 2.4 pounds. A turkey farmer
Wants to provide a money-back guarantee that her 6-week poults will weigh at least a certain
Amount. What weight should she guarantee so that she will have to give her customer's money back
Only 1% of the time?
A) 3.51 lb
B) 2.81 lb
C) 3.86 lb
D) 3.16 lb
Wants to provide a money-back guarantee that her 6-week poults will weigh at least a certain
Amount. What weight should she guarantee so that she will have to give her customer's money back
Only 1% of the time?
A) 3.51 lb
B) 2.81 lb
C) 3.86 lb
D) 3.16 lb
Unlock Deck
Unlock for access to all 131 flashcards in this deck.
Unlock Deck
k this deck
45
The lifetime of a certain type of automobile tire (in thousands of miles) is normally distributed with mean and standard deviation . What proportion of tires have lifetimes between 40 and
50 thousand miles?
A) 0.6450
B) 2.0000
C) 0.3550
D) 1.1935
and standard deviation . What proportion of tires have lifetimes between 40 and50 thousand miles?
A) 0.6450
B) 2.0000
C) 0.3550
D) 1.1935
Unlock Deck
Unlock for access to all 131 flashcards in this deck.
Unlock Deck
k this deck
46
A sample of size 85 will be drawn from a population with mean 20 and standard deviation 8. Find the probability that will be between 19 and 22.
A) 0.8256
B) 0.8642
C) 0.0107
D) 0.1251
will be between 19 and 22.A) 0.8256
B) 0.8642
C) 0.0107
D) 0.1251
Unlock Deck
Unlock for access to all 131 flashcards in this deck.
Unlock Deck
k this deck
47
According to a recent study, the weight of male babies less than two months old in the United States is normally distributed with mean 11.4 pounds and standard deviation 2.8 pounds. What proportion
Of babies weigh between 10.3 and 12.5 pounds?
A) 0.6965
B) 0.3035
C) 1.0000
D) 0.7800
Of babies weigh between 10.3 and 12.5 pounds?
A) 0.6965
B) 0.3035
C) 1.0000
D) 0.7800
Unlock Deck
Unlock for access to all 131 flashcards in this deck.
Unlock Deck
k this deck
48
Use technology to solve the following problem: According to a recent study, the weight of male babies less than two months old in the United States is normally distributed with mean 12.0 pounds
And standard deviation 2.6 pounds. What proportion of babies weigh less than 10.3 pounds?
A) 0.8717
B) 0.7434
C) 0.1283
D) 0.2566
And standard deviation 2.6 pounds. What proportion of babies weigh less than 10.3 pounds?
A) 0.8717
B) 0.7434
C) 0.1283
D) 0.2566
Unlock Deck
Unlock for access to all 131 flashcards in this deck.
Unlock Deck
k this deck
49
Use technology to solve the following problem: According to a recent study, the weight of male babies less than two months old in the United States is normally distributed with mean 11.4 pounds
And standard deviation 2.7 pounds. What proportion of babies weigh between 9.7 and 11.5 pounds?
A) 0.6667
B) 0.7497
C) 0.2503
D) 0.7792
And standard deviation 2.7 pounds. What proportion of babies weigh between 9.7 and 11.5 pounds?
A) 0.6667
B) 0.7497
C) 0.2503
D) 0.7792
Unlock Deck
Unlock for access to all 131 flashcards in this deck.
Unlock Deck
k this deck
50
Use technology to solve the following problem: The lifetime of a certain type of automobile tire (in thousands of miles) is normally distributed with mean and standard deviation . What
Proportion of tires have lifetimes greater than 32 thousand miles?
A) 0.9544
B) 0.9088
C) 0.0456
D) 0.0912
and standard deviation . WhatProportion of tires have lifetimes greater than 32 thousand miles?
A) 0.9544
B) 0.9088
C) 0.0456
D) 0.0912
Unlock Deck
Unlock for access to all 131 flashcards in this deck.
Unlock Deck
k this deck
51
According to a recent study, the weight of male babies less than two months old in the United States is normally distributed with mean 12.0 pounds and standard deviation 2.4 pounds. What proportion
Of babies weigh less than 9.1 pounds?
A) 0.9434
B) 0.0566
C) 0.1131
D) 0.8869
Of babies weigh less than 9.1 pounds?
A) 0.9434
B) 0.0566
C) 0.1131
D) 0.8869
Unlock Deck
Unlock for access to all 131 flashcards in this deck.
Unlock Deck
k this deck
52
According to a recent study, the weight of male babies less than two months old in the United States is normally distributed with mean 11.9 pounds and standard deviation 2.6 pounds. What proportion
Of babies weigh more than 10.1 pounds?
A) 0.7549
B) 0.2451
C) 0.8775
D) 0.1225
Of babies weigh more than 10.1 pounds?
A) 0.7549
B) 0.2451
C) 0.8775
D) 0.1225
Unlock Deck
Unlock for access to all 131 flashcards in this deck.
Unlock Deck
k this deck
53
The weights of 6-week-old poults (juvenile turkeys) are normally distributed with a mean 9.0 pounds and standard deviation 2.4 pounds. A turkey farmer wants to provide a money-back
Guarantee that her 6-week poults will weigh at least a certain amount. What weight should she
Guarantee so that she will have to give her customer's money back only 1% of the time?
A) 3.41 lb
B) 3.07 lb
C) 2.73 lb
D) 4.09 lb
Guarantee that her 6-week poults will weigh at least a certain amount. What weight should she
Guarantee so that she will have to give her customer's money back only 1% of the time?
A) 3.41 lb
B) 3.07 lb
C) 2.73 lb
D) 4.09 lb
Unlock Deck
Unlock for access to all 131 flashcards in this deck.
Unlock Deck
k this deck
54
The lifetime of a certain type of automobile tire (in thousands of miles) is normally distributed with mean and standard deviation . What proportion of tires have lifetimes greater than 48
Thousand miles?
A) 0.4666
B) 0.0668
C) 0.5334
D) 0.9332
and standard deviation . What proportion of tires have lifetimes greater than 48Thousand miles?
A) 0.4666
B) 0.0668
C) 0.5334
D) 0.9332
Unlock Deck
Unlock for access to all 131 flashcards in this deck.
Unlock Deck
k this deck
55
Use technology to solve the following problem: The weights of 6-week-old poults (juvenile turkeys) are normally distributed with a mean 8.8 pounds and standard deviation 1.8 pounds. Find the first
Quartile of the weight.
A) 6.07 lb
B) 6.83 lb
C) 9.11 lb
D) 7.59 lb
Quartile of the weight.
A) 6.07 lb
B) 6.83 lb
C) 9.11 lb
D) 7.59 lb
Unlock Deck
Unlock for access to all 131 flashcards in this deck.
Unlock Deck
k this deck
56
Use technology to solve the following problem: The lifetime of a certain type of automobile tire (in thousands of miles) is normally distributed with mean and standard deviation . What
Proportion of tires have lifetimes of less than 49 thousand miles?
A) 0.1056
B) 0.4472
C) 0.8944
D) 0.5528
and standard deviation . WhatProportion of tires have lifetimes of less than 49 thousand miles?
A) 0.1056
B) 0.4472
C) 0.8944
D) 0.5528
Unlock Deck
Unlock for access to all 131 flashcards in this deck.
Unlock Deck
k this deck
57
Use technology to solve the following problem: According to a recent study, the weight of male babies less than two months old in the United States is normally distributed with mean 11.0 pounds
And standard deviation 2.4 pounds. What proportion of babies weigh more than 11.7 pounds?
A) 0.3853
B) 0.3074
C) 0.6926
D) 0.6147
And standard deviation 2.4 pounds. What proportion of babies weigh more than 11.7 pounds?
A) 0.3853
B) 0.3074
C) 0.6926
D) 0.6147
Unlock Deck
Unlock for access to all 131 flashcards in this deck.
Unlock Deck
k this deck
58
A sample of size 39 will be drawn from a population with mean 15 and standard deviation 6. Find the probability that will be greater than 16.
A) 0.1271
B) 0.1170
C) 0.1492
D) 0.8508
will be greater than 16.A) 0.1271
B) 0.1170
C) 0.1492
D) 0.8508
Unlock Deck
Unlock for access to all 131 flashcards in this deck.
Unlock Deck
k this deck
59
Use technology to solve the following problem: The lifetime of a certain type of automobile tire (in thousands of miles) is normally distributed with mean and standard deviation . What
Proportion of tires have lifetimes between 33 and 48 thousand miles?
A) 1.1980
B) 0.7742
C) 3.0000
D) 0.2258
and standard deviation . WhatProportion of tires have lifetimes between 33 and 48 thousand miles?
A) 1.1980
B) 0.7742
C) 3.0000
D) 0.2258
Unlock Deck
Unlock for access to all 131 flashcards in this deck.
Unlock Deck
k this deck
60
Use technology to solve the following problem: A sample of size 45 will be drawn from a population with mean 94 and standard deviation 14. Find the 32nd percentile of
A) 97.7
B) 93.0
C) 95.4
D) 91.2
A) 97.7
B) 93.0
C) 95.4
D) 91.2
Unlock Deck
Unlock for access to all 131 flashcards in this deck.
Unlock Deck
k this deck
61
A survey reported that in a recent year, the mean serum cholesterol level in milligrams per deciliter for U.S. adults was 203 with a standard deviation of 39. A random sample of 102 adults was
Chosen. What is the probability that the mean cholesterol level is between 199 and 208?
A) 0.7523
B) 0.2477
C) 0.9015
D) 1.2900
Chosen. What is the probability that the mean cholesterol level is between 199 and 208?
A) 0.7523
B) 0.2477
C) 0.9015
D) 1.2900
Unlock Deck
Unlock for access to all 131 flashcards in this deck.
Unlock Deck
k this deck
62
Use technology to solve the following problem: The mean number of pets per household is 3.03 with standard deviation 1.5. A sample of 56 households is drawn. Find the 62nd percentile of the
Sample mean.
A) 3.95
B) 2.57
C) 3.09
D) 3.65
Sample mean.
A) 3.95
B) 2.57
C) 3.09
D) 3.65
Unlock Deck
Unlock for access to all 131 flashcards in this deck.
Unlock Deck
k this deck
63
Use technology to solve the following problem: A certain car model has a mean gas mileage of 29 miles per gallon (mpg) with a standard deviation 5 mpg. A pizza delivery company buys 40 of these
Cars. What is the probability that the average mileage of the fleet is greater than 27.8 mpg?
A) 0.9655
B) 0.9355
C) 0.0345
D) 0.9062
Cars. What is the probability that the average mileage of the fleet is greater than 27.8 mpg?
A) 0.9655
B) 0.9355
C) 0.0345
D) 0.9062
Unlock Deck
Unlock for access to all 131 flashcards in this deck.
Unlock Deck
k this deck
64
A certain car model has a mean gas mileage of 28 miles per gallon (mpg) with a standard deviation 3 mpg. A pizza delivery company buys 43 of these cars. What is the probability that the average
Mileage of the fleet is greater than 27.6 mpg?
A) 0.9147
B) 0.8078
C) 0.0853
D) 0.6808
Mileage of the fleet is greater than 27.6 mpg?
A) 0.9147
B) 0.8078
C) 0.0853
D) 0.6808
Unlock Deck
Unlock for access to all 131 flashcards in this deck.
Unlock Deck
k this deck
65
Use technology to solve the following problem: A survey reported that in a recent year, the mean serum cholesterol level in milligrams per deciliter for U.S. adults was 198 with a standard deviation
Of 36. A random sample of 114 adults was chosen. What is the probability that the mean
Cholesterol level is less than 194?
A) 0.4558
B) 0.5442
C) 0.1177
D) 0.8823
Of 36. A random sample of 114 adults was chosen. What is the probability that the mean
Cholesterol level is less than 194?
A) 0.4558
B) 0.5442
C) 0.1177
D) 0.8823
Unlock Deck
Unlock for access to all 131 flashcards in this deck.
Unlock Deck
k this deck
66
Use technology to solve the following problem: A sample of size 51 will be drawn from a population with mean 11 and standard deviation 7. Find the probability that will be less than 12.
A) 0.8106
B) 0.8462
C) 0.8390
D) 0.1538
will be less than 12.A) 0.8106
B) 0.8462
C) 0.8390
D) 0.1538
Unlock Deck
Unlock for access to all 131 flashcards in this deck.
Unlock Deck
k this deck
67
A sample of size 56 will be drawn from a population with mean 26 and standard deviation 11. Find the probability that will be less than 28.
A) 0.9131
B) 0.0869
C) 0.9394
D) 0.9406
will be less than 28.A) 0.9131
B) 0.0869
C) 0.9394
D) 0.9406
Unlock Deck
Unlock for access to all 131 flashcards in this deck.
Unlock Deck
k this deck
68
The mean annual income for people in a certain city (in thousands of dollars) is 46, with a standard deviation of 33. A pollster draws a sample of 55 people to interview. What is the probability that the
Sample mean income is between 42 and 50 (thousands of dollars)?
A) 0.3681
B) 0.6319
C) 0.1841
D) 0.8159
Sample mean income is between 42 and 50 (thousands of dollars)?
A) 0.3681
B) 0.6319
C) 0.1841
D) 0.8159
Unlock Deck
Unlock for access to all 131 flashcards in this deck.
Unlock Deck
k this deck
69
A survey reported that in a recent year, the mean serum cholesterol level in milligrams per deciliter for U.S. adults was 199 with a standard deviation of 44. A random sample of 104 adults was
Chosen. What is the probability that the mean cholesterol level is less than 198?
A) 0.4920
B) 0.5080
C) 0.5910
D) 0.4090
Chosen. What is the probability that the mean cholesterol level is less than 198?
A) 0.4920
B) 0.5080
C) 0.5910
D) 0.4090
Unlock Deck
Unlock for access to all 131 flashcards in this deck.
Unlock Deck
k this deck
70
The mean annual income for people in a certain city (in thousands of dollars) is 42, with a standard deviation of 30. A pollster draws a sample of 47 people to interview. Find the 84th percentile of the
Sample mean.
A) 49.0 thousand dollars
B) 43.6 thousand dollars
C) 44.0 thousand dollars
D) 46.3 thousand dollars
Sample mean.
A) 49.0 thousand dollars
B) 43.6 thousand dollars
C) 44.0 thousand dollars
D) 46.3 thousand dollars
Unlock Deck
Unlock for access to all 131 flashcards in this deck.
Unlock Deck
k this deck
71
A certain car model has a mean gas mileage of 34 miles per gallon (mpg) with a standard deviation 4 mpg. A pizza delivery company buys 54 of these cars. What is the probability that the average
Mileage of the fleet is between 33.3 and 34.3 mpg?
A) 0.6103
B) 0.0985
C) 0.7088
D) 0.3897
Mileage of the fleet is between 33.3 and 34.3 mpg?
A) 0.6103
B) 0.0985
C) 0.7088
D) 0.3897
Unlock Deck
Unlock for access to all 131 flashcards in this deck.
Unlock Deck
k this deck
72
Use technology to solve the following problem: A ferry will safely accommodate 79 tons of passenger cars. Assume that the mean weight of a passenger car is 1.9 tons with standard deviation
0)5 tons. If a random sample of 39 cars are loaded onto the ferry, what is the probability that the
Maximum safe weight will be exceeded?
A) 0.0516
B) 0.9417
C) 0.0583
D) 0.0669
0)5 tons. If a random sample of 39 cars are loaded onto the ferry, what is the probability that the
Maximum safe weight will be exceeded?
A) 0.0516
B) 0.9417
C) 0.0583
D) 0.0669
Unlock Deck
Unlock for access to all 131 flashcards in this deck.
Unlock Deck
k this deck
73
Use technology to solve the following problem: A certain car model has a mean gas mileage of 33 miles per gallon (mpg) with a standard deviation 3 mpg. A pizza delivery company buys 48 of these
Cars. What is the probability that the average mileage of the fleet is between 32.7 and 33.3 mpg?
A) 0.5116
B) 0.4884
C) 0.2442
D) 0.7558
Cars. What is the probability that the average mileage of the fleet is between 32.7 and 33.3 mpg?
A) 0.5116
B) 0.4884
C) 0.2442
D) 0.7558
Unlock Deck
Unlock for access to all 131 flashcards in this deck.
Unlock Deck
k this deck
74
Use technology to solve the following problem: A sample of size 52 will be drawn from a population with mean 11 and standard deviation 11. Find the probability that will be greater than
13)
A) 0.1001
B) 0.0667
C) 0.0949
D) 0.9051
will be greater than13)
A) 0.1001
B) 0.0667
C) 0.0949
D) 0.9051
Unlock Deck
Unlock for access to all 131 flashcards in this deck.
Unlock Deck
k this deck
75
The mean number of pets per household is 3.33 with standard deviation 1.6. A sample of 53 households is drawn. Find the 78th percentile of the sample mean.
A) 4.35
B) 3.50
C) 4.20
D) 2.89
A) 4.35
B) 3.50
C) 4.20
D) 2.89
Unlock Deck
Unlock for access to all 131 flashcards in this deck.
Unlock Deck
k this deck
76
The mean annual income for people in a certain city (in thousands of dollars) is 39, with a standard deviation of 36. A pollster draws a sample of 43 people to interview. What is the probability that the
Sample mean income is less than 33 (thousands of dollars)?
A) 0.1379
B) 0.8186
C) 0.1814
D) 0.1151
Sample mean income is less than 33 (thousands of dollars)?
A) 0.1379
B) 0.8186
C) 0.1814
D) 0.1151
Unlock Deck
Unlock for access to all 131 flashcards in this deck.
Unlock Deck
k this deck
77
Use technology to solve the following problem: The mean annual income for people in a certain city (in thousands of dollars) is 45, with a standard deviation of 37. A pollster draws a sample of 37
People to interview. What is the probability that the sample mean income is less than 52 (thousands
Of dollars)?
A) 0.8751
B) 0.8391
C) 0.1019
D) 0.8981
People to interview. What is the probability that the sample mean income is less than 52 (thousands
Of dollars)?
A) 0.8751
B) 0.8391
C) 0.1019
D) 0.8981
Unlock Deck
Unlock for access to all 131 flashcards in this deck.
Unlock Deck
k this deck
78
A ferry will safely accommodate 86 tons of passenger cars. Assume that the mean weight of a passenger car is 2.1 tons with standard deviation 0.6 tons. If a random sample of 38 cars are loaded
Onto the ferry, what is the probability that the maximum safe weight will be exceeded?
A) 0.0485
B) 0.9535
C) 0.0465
D) 0.0668
Onto the ferry, what is the probability that the maximum safe weight will be exceeded?
A) 0.0485
B) 0.9535
C) 0.0465
D) 0.0668
Unlock Deck
Unlock for access to all 131 flashcards in this deck.
Unlock Deck
k this deck
79
Use technology to solve the following problem: The mean annual income for people in a certain city (in thousands of dollars) is 40, with a standard deviation of 38. A pollster draws a sample of 35
People to interview. Find the 50th percentile of the sample mean.
A) 37.1 thousand dollars
B) 43.1 thousand dollars
C) 38.2 thousand dollars
D) 40.0 thousand dollars
People to interview. Find the 50th percentile of the sample mean.
A) 37.1 thousand dollars
B) 43.1 thousand dollars
C) 38.2 thousand dollars
D) 40.0 thousand dollars
Unlock Deck
Unlock for access to all 131 flashcards in this deck.
Unlock Deck
k this deck
80
Use technology to solve the following problem: The mean annual income for people in a certain city (in thousands of dollars) is 44, with a standard deviation of 35. A pollster draws a sample of 59
People to interview. What is the probability that the sample mean income is between 42 and
48 (thousands of dollars)?
A) 0.5204
B) 0.4796
C) 0.8100
D) 0.1900
People to interview. What is the probability that the sample mean income is between 42 and
48 (thousands of dollars)?
A) 0.5204
B) 0.4796
C) 0.8100
D) 0.1900
Unlock Deck
Unlock for access to all 131 flashcards in this deck.
Unlock Deck
k this deck
Unlock Deck
Unlock for access to all 131 flashcards in this deck.


