Deck 9: Hypothesis Testing
Full screen (f)
Question
A test is made of  . A sample of size n = 67 is drawn, and
  . The population standard deviation is
  . Compute the value of the test statistic z.
A) 0.15
B) -1.02
C) -5.01
D) -0.12
. A sample of size n = 67 is drawn, and . The population standard deviation is . Compute the value of the test statistic z.A) 0.15
B) -1.02
C) -5.01
D) -0.12
Question
A fleet of rental cars - all the same make, model, and year - has a mean fuel efficiency of 25 miles per gallon (mpg). A random sample of 57 cars are selected and the air filter of each is replaced with
A new one. Let be the population mean fuel efficiency score that would occur if every car's air
Filter were replaced. The air filter change is deemed effective if mpg. A test is made of
  . Consider these possible conclusions:
i. The air filter changes are effective.
ii. The air filter changes are not effective.
iii.. The air filter changes might not be effective.
Which of the three conclusions is best if is not rejected?
A) ii
B) i
C) iii
A new one. Let
be the population mean fuel efficiency score that would occur if every car's airFilter were replaced. The air filter change is deemed effective if
mpg. A test is made of . Consider these possible conclusions:i. The air filter changes are effective.
ii. The air filter changes are not effective.
iii.. The air filter changes might not be effective.
Which of the three conclusions is best if
is not rejected?A) ii
B) i
C) iii
Question
A test is made of  versus
  . A sample of size n=60 is drawn, and
  The population standard deviation is
  . Compute the value of the test statistic z and determine if
  is rejected at the
  level.
A) 0.22, not rejected
B) 1.68, rejected
C) 0.22, rejected
D) 1.68, not rejected
versus . A sample of size n=60 is drawn, and The population standard deviation is . Compute the value of the test statistic z and determine if is rejected at the level.A) 0.22,
not rejectedB) 1.68,
rejectedC) 0.22,
rejectedD) 1.68,
not rejected Question
A new organic pest control formula is being tested on potato plants to see whether it can reduce the level of potato beetle infestation. The mean number of beetles per untreated plant is 8. It is hoped That the new formula may reduce this infestation rate. State the appropriate null and alternate
Hypotheses.
A)
B)
C)
D)
Hypotheses.
A)
B)
C)
D)
Question
A garden supplier claims that its new variety of giant tomato produces fruit with a mean weight of 38 ounces. A test is made of  versus
  . The null hypothesis is rejected. State the
Appropriate conclusion.
A) There is not enough evidence to conclude that the mean weight is 38 ounces.
B) The mean weight is equal to 38 ounces.
C) There is not enough evidence to conclude that the mean weight differs from 38 ounces.
D) The mean weight is not equal to 38 ounces.
versus . The null hypothesis is rejected. State theAppropriate conclusion.
A) There is not enough evidence to conclude that the mean weight is 38 ounces.
B) The mean weight is equal to 38 ounces.
C) There is not enough evidence to conclude that the mean weight differs from 38 ounces.
D) The mean weight is not equal to 38 ounces.
Question
A garden supplier claims that its new variety of giant tomato produces fruit with a mean weight of 42 ounces. A test is made of  . The null hypothesis is not rejected. State
The appropriate conclusion.
A) There is not enough evidence to conclude that the mean weight is 42 ounces.
B) The mean weight is not equal to 42 ounces.
C) The mean weight is equal to 42 ounces.
D) There is not enough evidence to conclude that the mean weight differs from 42 ounces.
. The null hypothesis is not rejected. StateThe appropriate conclusion.
A) There is not enough evidence to conclude that the mean weight is 42 ounces.
B) The mean weight is not equal to 42 ounces.
C) The mean weight is equal to 42 ounces.
D) There is not enough evidence to conclude that the mean weight differs from 42 ounces.
Question
A fleet of rental cars - all the same make, model, and year - has a mean fuel efficiency of 24 miles per gallon (mpg). A random sample of 44 cars are selected and the air filter of each is replaced with a new one. Let = be the population mean fuel efficiency score that would occur if every car's air filter were replaced. The air filter change is deemed effective if
  >24 mpg. A test is made of
  versus https://d2lvgg3v3hfg70.cloudfront.net/TB34225555/
 . Consider these possible conclusions:
i. The air filter changes are effective.
ii. The air filter changes are not effective.
Iii. The air filter changes might not be successful.
Which of the three conclusions is best if is rejected?
A) iii
B) ii
C) i
be the population mean fuel efficiency score that would occur if every car's air filter were replaced. The air filter change is deemed effective if >24 mpg. A test is made of versus https://d2lvgg3v3hfg70.cloudfront.net/TB34225555/. Consider these possible conclusions:i. The air filter changes are effective.
ii. The air filter changes are not effective.
Iii. The air filter changes might not be successful.
Which of the three conclusions is best if
is rejected?A) iii
B) ii
C) i
Question
A sample of 50 chewable vitamin tablets have a sample mean of 300 milligrams of vitamin C. Nutritionists want to perform a hypothesis test to determine how strong the evidence is that the
Mean mass of vitamin C per tablet differs from 297 milligrams. State the appropriate null and
Alternate hypotheses.
A)
B)
C)
D)
Mean mass of vitamin C per tablet differs from 297 milligrams. State the appropriate null and
Alternate hypotheses.
A)
B)
C)
D)
Question
Question
A grocery store owner claims that the mean amount spent per checkout is more than $74. A test is made of  . The null hypothesis is rejected. State the appropriate
Conclusion.
A) The mean checkout amount is greater than $74.
B) There is not enough evidence to conclude that the mean checkout price is greater than $74.
C) The mean checkout amount is less than or equal to $74.
D) There is not enough evidence to conclude that the mean checkout price is less than or equal to $74.
. The null hypothesis is rejected. State the appropriateConclusion.
A) The mean checkout amount is greater than $74.
B) There is not enough evidence to conclude that the mean checkout price is greater than $74.
C) The mean checkout amount is less than or equal to $74.
D) There is not enough evidence to conclude that the mean checkout price is less than or equal to $74.
Question
A sample of 60 chewable vitamin tablets have a sample mean of 275 milligrams of vitamin C. Nutritionists want to perform a hypothesis test to determine how strong the evidence is that the
Mean mass of vitamin C per tablet exceeds 272 milligrams. State the appropriate null and alternate
Hypotheses.
A)
B)
C)
D)
Mean mass of vitamin C per tablet exceeds 272 milligrams. State the appropriate null and alternate
Hypotheses.
A)
B)
C)
D)
Question
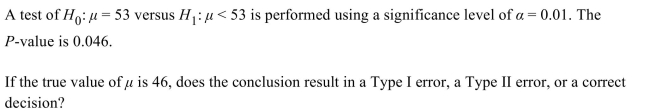
A test of  versus
  is performed using a significance level of
  =0.05. The value of the test statistic is z=-1.81. Is
  rejected?
A) Yes
B) No
C) It cannot be determined.
versus is performed using a significance level of =0.05. The value of the test statistic is z=-1.81. Is rejected?A) Yes
B) No
C) It cannot be determined.
Question
A test is made of  versus
  . A sample of size n=76 is drawn, and
  . The population standard deviation is https://d2lvgg3v3hfg70.cloudfront.net/TB34225555/
 . Compute the value of the test statistic z and determine if
  is rejected at the
  level.
A) 0.16, H0 rejected
B) 1.39, H0 rejected
C) 1.39, H0 not rejected
D) 0.16, H0 not rejected
versus . A sample of size n=76 is drawn, and . The population standard deviation is https://d2lvgg3v3hfg70.cloudfront.net/TB34225555/. Compute the value of the test statistic z and determine if is rejected at the level.A) 0.16, H0 rejected
B) 1.39, H0 rejected
C) 1.39, H0 not rejected
D) 0.16, H0 not rejected
Question
A fleet of rental cars - all the same make, model, and year - has a mean fuel efficiency of 23.4 miles per gallon (mpg). A random sample of 41 cars are selected and the air filter of each is replaced with
A new one. Let μ be the population mean fuel efficiency score that would occur if every car's air
Filter were replaced. The air filter change is deemed effective if mpg. A test is made of
  Assume that the air filter changes are effective but the conclusion is reached that the changes might not be
Effective. Which type of error, of any, has occurred?
A) Type II
B) No error - correct decision
C) Type I
D) Mechanical failure
A new one. Let μ be the population mean fuel efficiency score that would occur if every car's air
Filter were replaced. The air filter change is deemed effective if
mpg. A test is made of Assume that the air filter changes are effective but the conclusion is reached that the changes might not beEffective. Which type of error, of any, has occurred?
A) Type II
B) No error - correct decision
C) Type I
D) Mechanical failure
Question
A test is made of  versus
  A sample of size n=67 is drawn, and
  =45 . The population standard deviation is
  =29 . Compute the value of the test statistic
A) 0.14
B) 1.13
C) 6.08
D) 0.87
versus A sample of size n=67 is drawn, and =45 . The population standard deviation is =29 . Compute the value of the test statistic A) 0.14
B) 1.13
C) 6.08
D) 0.87
Question
Determine whether the alternative hypothesis is left-tailed, right-tailed, or two-tailed. 
A) two-tailed
B) right-tailed
C) left-tailed
A) two-tailed
B) right-tailed
C) left-tailed
Question
A fleet of rental cars - all the same make, model, and year - has a mean fuel efficiency of 24.3 miles per gallon (mpg). A random sample of 43 cars are selected and the air filter of each is replaced with
A new one. Let μ be the population mean fuel efficiency score that would occur if every car's air
Filter were replaced. The air filter change is deemed effective if . A test is made of
  Assume that the air filter changes are not effective. Which type of error is impossible?
A) Type I
B) Type II
A new one. Let μ be the population mean fuel efficiency score that would occur if every car's air
Filter were replaced. The air filter change is deemed effective if
. A test is made of Assume that the air filter changes are not effective. Which type of error is impossible?A) Type I
B) Type II
Question
Determine whether the outcome is a Type I error, a Type II error, or a correct decision. A test is made of H0:μ=62 versus H1:μ≠62
The true value of is 64 and H0 is rejected.
A) Type I error
B) Type II error
C) Correct decision
The true value of
is 64 and H0 is rejected.A) Type I error
B) Type II error
C) Correct decision
Question
A grocery store owner claims that the mean amount spent per checkout is more than $85. A test is made of  . The null hypothesis is not rejected. State the appropriate
Conclusion.
A) The mean checkout amount is less than or equal to $85.
B) There is not enough evidence to conclude that the mean checkout price is less than or equal to $85.
C) The mean checkout amount is greater than $85.
D) There is not enough evidence to conclude that the mean checkout price is greater than $85.
. The null hypothesis is not rejected. State the appropriateConclusion.
A) The mean checkout amount is less than or equal to $85.
B) There is not enough evidence to conclude that the mean checkout price is less than or equal to $85.
C) The mean checkout amount is greater than $85.
D) There is not enough evidence to conclude that the mean checkout price is greater than $85.
Question
A fleet of rental cars - all the same make, model, and year - has a mean fuel efficiency of 25.2 miles per gallon (mpg). A random sample of 59 cars are selected and the air filter of each is replaced with
A new one. Let μ be the population mean fuel efficiency score that would occur if every car's air Filter were replaced. The air filter change is deemed effective if mpg. A test is made of
  Assume that the air filter changes are effective. Which type of error is impossible?
A) Type I
B) Type II
A new one. Let μ be the population mean fuel efficiency score that would occur if every car's air Filter were replaced. The air filter change is deemed effective if
mpg. A test is made of Assume that the air filter changes are effective. Which type of error is impossible?A) Type I
B) Type II
Question
A test of H0:  =57 versus H1:
  57 is performed using a significance level of
  :=0.05. The P-value is 0.138 . Is H0 rejected?
A) It cannot be determined.
B) Yes
C) No
=57 versus H1: 57 is performed using a significance level of :=0.05. The P-value is 0.138 . Is H0 rejected?A) It cannot be determined.
B) Yes
C) No
Question


A) Type I error
B) Type II error
C) Correct decision
Question
Alice will perform a hypothesis test at the  =0.05 level. Bob will perform the same test at the
  = 0.01 level. If H0 is true, who has the greater probability of making a type I error?
A) Alice
B) Bob
C) Neither
=0.05 level. Bob will perform the same test at the = 0.01 level. If H0 is true, who has the greater probability of making a type I error?A) Alice
B) Bob
C) Neither
Question
A) Correct decision
B) Type I error
C) Type II error
Question
The Golden Comet is a hybrid chicken that is prized for its high egg production rate and gentle disposition. According to recent studies, the mean rate of egg production for 1-year-old Golden Comets is 5.1 eggs/week.
Sarah has 35 1-year-old hens that are fed exclusively on natural scratch feed: insects, seeds, and plants that the hens obtain as they range freely around the farm. Her hens exhibit a mean egg-laying rate of 5.4 eggs/day.
Sarah wants to determine whether the mean laying rate for her hens is higher than the mean rate for all Golden Comets. Assume the population standard deviation to be
i. State the appropriate null and alternate hypotheses.
ii. Compute the value of the test statistic.
iii. State a conclusion. Use the level of significance.
Sarah has 35 1-year-old hens that are fed exclusively on natural scratch feed: insects, seeds, and plants that the hens obtain as they range freely around the farm. Her hens exhibit a mean egg-laying rate of 5.4 eggs/day.
Sarah wants to determine whether the mean laying rate
for her hens is higher than the mean rate for all Golden Comets. Assume the population standard deviation to be i. State the appropriate null and alternate hypotheses.
ii. Compute the value of the test statistic.
iii. State a conclusion. Use the
level of significance. Question
The Golden Comet is a hybrid chicken that is prized for its high egg production rate and gentle disposition. According to recent studies, the mean rate of egg production for 1-year-old Golden
Comets is 5.4 eggs/week.
Sarah has 46 1-year-old hens that are fed exclusively on natural scratch feed: insects, seeds, and
Plants that the hens obtain as they range freely around the farm. Her hens exhibit a mean egg-laying
Rate of 5.9 eggs/day.
Sarah wants to determine whether the mean laying rate for her hens is higher than the mean rate for all
Golden Comets. State the appropriate null and alternate hypotheses.
A)
B)
C)
D)
Comets is 5.4 eggs/week.
Sarah has 46 1-year-old hens that are fed exclusively on natural scratch feed: insects, seeds, and
Plants that the hens obtain as they range freely around the farm. Her hens exhibit a mean egg-laying
Rate of 5.9 eggs/day.
Sarah wants to determine whether the mean laying rate
for her hens is higher than the mean rate for allGolden Comets. State the appropriate null and alternate hypotheses.
A)
B)
C)
D)
Question
Question
A test of H0:  =59 versus H1:
  59 is performed using a significance level of
  =0.01 . The value of the test statistic is z=-2.66.
If the true value of is 55 , does the conclusion result in a Type I error, a Type II error, or a correct decision?
A) Type I error
B) Correct decision
C) Type II error
=59 versus H1: 59 is performed using a significance level of =0.01 . The value of the test statistic is z=-2.66.If the true value of
is 55 , does the conclusion result in a Type I error, a Type II error, or a correct decision?A) Type I error
B) Correct decision
C) Type II error
Question
Mercury is a heavy metal that can cause severe health problems in even small concentrations. Fish and shellfish efficiently concentrate mercury into their flesh, so it is important to monitor seafood for its mercury
Content.
An extensive study conducted in 1980 concluded that the mean mercury level in oysters from the White Bear
Estuary was 0.021 parts per million (ppm) with a standard deviation In 2012, a
Sample of 47 oysters from the same estuary exhibited a mean mercury concentration of 0.017 ppm.
Can you conclude that the 2012 mercury concentration is lower than in 1980? Use the level of
Significance.
A) No. There is insufficient evidence to conclude that the mercury concentration has decreased from 1980 to 2012.
B) Yes. The mercury concentration appears to be lower in 2012.
C) There is not enough information to reach a conclusion.
Content.
An extensive study conducted in 1980 concluded that the mean mercury level in oysters from the White Bear
Estuary was 0.021 parts per million (ppm) with a standard deviation
In 2012, aSample of 47 oysters from the same estuary exhibited a mean mercury concentration of 0.017 ppm.
Can you conclude that the 2012 mercury concentration is lower than in 1980? Use the
level ofSignificance.
A) No. There is insufficient evidence to conclude that the mercury concentration has decreased from 1980 to 2012.
B) Yes. The mercury concentration appears to be lower in 2012.
C) There is not enough information to reach a conclusion.
Question
A test of H0: =41 versus H1:
  41 is performed using a significance level of
  =0.05 . The value of the test statistic is z=-1.84. Is H0 rejected?
A) No
B) It cannot be determined.
C) Yes
=41 versus H1: 41 is performed using a significance level of =0.05 . The value of the test statistic is z=-1.84. Is H0 rejected?A) No
B) It cannot be determined.
C) Yes
Question
At a water bottling facility, a technician is testing a bottle filling machine that is supposed to deliver
500 milliliters of water. The technician dispenses 38 samples of water and determines the volume of
each sample. The 38 samples have a mean volume of . The machine is out of
calibration if the mean volume differs from 500 mL.
The technician wants to perform a hypothesis test to determine whether the machine is out of calibration. The
standard deviation of the dispensed volume is known to be
i). State the appropriate null and alternate hypotheses.
ii). Compute the value of the test statistic.
iii). State a conclusion. Use the level of significance.
500 milliliters of water. The technician dispenses 38 samples of water and determines the volume of
each sample. The 38 samples have a mean volume of
. The machine is out ofcalibration if the mean volume differs from 500 mL.
The technician wants to perform a hypothesis test to determine whether the machine is out of calibration. The
standard deviation of the dispensed volume is known to be
i). State the appropriate null and alternate hypotheses.
ii). Compute the value of the test statistic.
iii). State a conclusion. Use the
level of significance. Question
A test of  versus
  is performed using a significance level of
  =0.01 . The value of the test statistic is z=-2.24.
If the true value of is 49 does the conclusion result in a Type I error, a Type II error, or a correct decision?
A) Type II error
B) Type I error
C) Correct decision
versus is performed using a significance level of =0.01 . The value of the test statistic is z=-2.24.If the true value of
is 49 does the conclusion result in a Type I error, a Type II error, or a correct decision?A) Type II error
B) Type I error
C) Correct decision
Question
A test of  45 versus
  is performed using a significance level of
  =0.01. The value of the test statistic is z=-2.24.
If the true value of is 45 , does the conclusion result in a Type I error, a Type II error, or a correct decision?
A) Type I error
B) Correct decision
C) Type II error
45 versus is performed using a significance level of =0.01. The value of the test statistic is z=-2.24.If the true value of
is 45 , does the conclusion result in a Type I error, a Type II error, or a correct decision?A) Type I error
B) Correct decision
C) Type II error
Question
A test of H0: =55 versus H1:
  55 is performed using a significance level of
  :=0.05 . The P-value is 0.048 .
If the true value of : is 59 , does the conclusion result in a Type I error, a Type II error, or a correct decision?
A) Type I error
B) Type II error
C) Correct decision
=55 versus H1: 55 is performed using a significance level of :=0.05 . The P-value is 0.048 .If the true value of
: is 59 , does the conclusion result in a Type I error, a Type II error, or a correct decision?A) Type I error
B) Type II error
C) Correct decision
Question
A test of H0:  =58 versus H1:
  58 is performed using a significance level of
  =0.05 . The value of the test statistic is z=-2.08.
If the true value of =: is 58 , does the conclusion result in a Type I error, a Type II error, or a correct decision?
A) Correct decision
B) Type II error
C) Type I error
=58 versus H1: 58 is performed using a significance level of =0.05 . The value of the test statistic is z=-2.08.If the true value of
=: is 58 , does the conclusion result in a Type I error, a Type II error, or a correct decision?A) Correct decision
B) Type II error
C) Type I error
Question

A) Yes
B) It cannot be determined.
C) No
Question
At a water bottling facility, a technician is testing a bottle filling machine that is supposed to deliver 750 milliliters of water. The technician dispenses 38 samples of water and determines the volume of
Each sample. The 38 samples have a mean volume of . The machine is out of
Calibration if the mean volume differs from 750 mL.
The technician wants to perform a hypothesis test to determine whether the machine is out of calibration. The
Standard deviation of the dispensed volume is known to be Compute the value of the test statistic.
A) 3.00
B) 1.33
C) 0.18
D) 0.22
Each sample. The 38 samples have a mean volume of
. The machine is out ofCalibration if the mean volume differs from 750 mL.
The technician wants to perform a hypothesis test to determine whether the machine is out of calibration. The
Standard deviation of the dispensed volume is known to be
Compute the value of the test statistic.A) 3.00
B) 1.33
C) 0.18
D) 0.22
Question
The Golden Comet is a hybrid chicken that is prized for its high egg production rate and gentle disposition. According to recent studies, the mean rate of egg production for 1-year-old Golden
Comets is 5.6 eggs/week.
Sarah has 41 1-year-old hens that are fed exclusively on natural scratch feed: insects, seeds, and
Plants that the hens obtain as they range freely around the farm. Her hens exhibit a mean egg-laying
Rate of 5.9 eggs/day.
Sarah wants to determine whether the mean laying rate μ for her hens is higher than the mean rate for all
Golden Comets. Assume the population standard deviation to be y. Compute the
Value of the test statistic.
A) 0.87
B) 0.18
C) 1.47
D) 1.13
Comets is 5.6 eggs/week.
Sarah has 41 1-year-old hens that are fed exclusively on natural scratch feed: insects, seeds, and
Plants that the hens obtain as they range freely around the farm. Her hens exhibit a mean egg-laying
Rate of 5.9 eggs/day.
Sarah wants to determine whether the mean laying rate μ for her hens is higher than the mean rate for all
Golden Comets. Assume the population standard deviation to be
y. Compute theValue of the test statistic.
A) 0.87
B) 0.18
C) 1.47
D) 1.13
Question
A test of H0: =59 versus H1:
  59 is performed using a significance level of
  =0.01 . The P-value is 0.115.
If the true value of is 59 , does the conclusion result in a Type I error, a Type II error, or a correct decision?
A) Type II error
B) Type I error
C) Correct decision
=59 versus H1: 59 is performed using a significance level of =0.01 . The P-value is 0.115.If the true value of
is 59 , does the conclusion result in a Type I error, a Type II error, or a correct decision?A) Type II error
B) Type I error
C) Correct decision
Question
At a water bottling facility, a technician is testing a bottle filling machine that is supposed to deliver 1,000 milliliters of water. The technician dispenses 46 samples of water and determines the volume
Of each sample. The 46 samples have a mean volume of https://d2lvgg3v3hfg70.cloudfront.net/TB34225555/ . The machine is out of
Calibration if the mean volume differs from 1,000 mL.
The technician wants to perform a hypothesis test to determine whether the machine is out of calibration.
State the appropriate null and alternate hypotheses.
A)
B)
C)
D)
Of each sample. The 46 samples have a mean volume of https://d2lvgg3v3hfg70.cloudfront.net/TB34225555/
. The machine is out ofCalibration if the mean volume differs from 1,000 mL.
The technician wants to perform a hypothesis test to determine whether the machine is out of calibration.
State the appropriate null and alternate hypotheses.
A)
B)
C)
D)
Question
A sample of 39 students enroll in a program that claims to improve scores on the quantitative reasoning
portion of the Graduate Record Examination (GRE). The participants take a mock GRE test before the
program begins and again at the end to measure their improvement. The mean number of points improved was =7. Assume the standard deviation is
  =56 and let
  be، the population mean number of points improved. To determine whether the program is effective, a test is made of the hypotheses
i). Compute the value of the test statistic.
ii). Compute the P-value.
iii). Do you reject H0 at the level?
portion of the Graduate Record Examination (GRE). The participants take a mock GRE test before the
program begins and again at the end to measure their improvement. The mean number of points improved was
=7. Assume the standard deviation is =56 and let be، the population mean number of points improved. To determine whether the program is effective, a test is made of the hypotheses i). Compute the value of the test statistic.
ii). Compute the P-value.
iii). Do you reject H0 at the
level? Question
A sample of 39 students enroll in a program that claims to improve scores on the quantitative reasoning portion of the Graduate Record Examination (GRE). The participants take a mock GRE test before the
Program begins and again at the end to measure their improvement.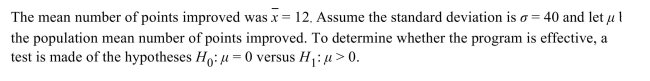 Compute the P-value.
A) 0.0305
B) 0.0076
C) 1.8735
D) 0.0153
Program begins and again at the end to measure their improvement.
Compute the P-value.A) 0.0305
B) 0.0076
C) 1.8735
D) 0.0153
Question
The following output from MINITAB presents the results of a hypothesis test. 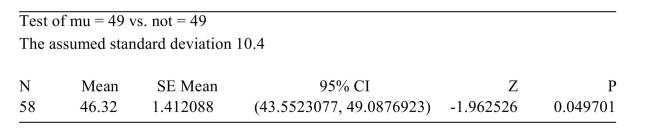
Do you reject H0 at the level?
A) No
B) Yes
C) There is not enough information to draw a conclusion.
Do you reject H0 at the
level?A) No
B) Yes
C) There is not enough information to draw a conclusion.
Question
The following output from MINITAB presents the results of a hypothesis test. 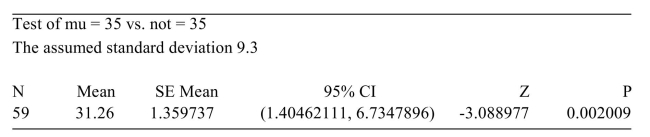 What is the value of the test statistic?
A) 0.002009
B) 1.359737
C) -3.088977
D) 31.26
What is the value of the test statistic?A) 0.002009
B) 1.359737
C) -3.088977
D) 31.26
Question
Forty members of a bowling league sign up for a program that claims to improve bowling scores. The participants bowl a set of five games before the program begins and a set of five games again at the end to
Measure their improvement.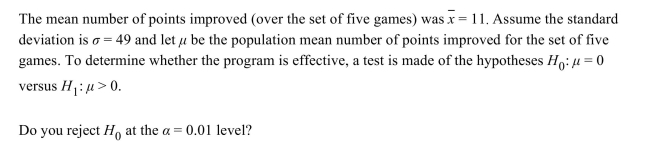
A) Yes
B) There is not enough information to draw a conclusion.
C) No
Measure their improvement.
A) Yes
B) There is not enough information to draw a conclusion.
C) No
Question
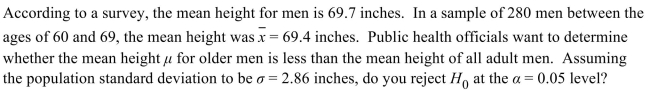
According to a survey, the mean height for men is 68.6 inches. In a sample of 320 men between the ages of 60 and 69 , the mean height was  inches. Public health officials want to determine whether the mean height
  for older men is less than the mean height of all adult men. Assuming the population standard deviation to be
  inches, compute the value of the test statistic.
A) 0.74
B) 429.95
C) -0.63
D) 0.63
inches. Public health officials want to determine whether the mean height for older men is less than the mean height of all adult men. Assuming the population standard deviation to be inches, compute the value of the test statistic.A) 0.74
B) 429.95
C) -0.63
D) 0.63
Question
Forty-three members of a bowling league sign up for a program that claims to improve bowling scores. The participants bowl a set of five games before the program begins and a set of five games again at
The end to measure their improvement.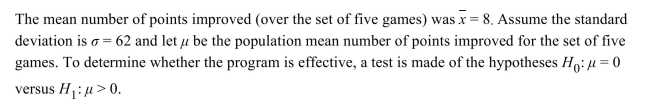 Using technology, compute the P-value.
A) 0.0994
B) 0.1987
C) 0.0497
D) 0.8461
The end to measure their improvement.
Using technology, compute the P-value.A) 0.0994
B) 0.1987
C) 0.0497
D) 0.8461
Question
The following display from a TI-84 Plus calculator presents the results of a hypothesis test. 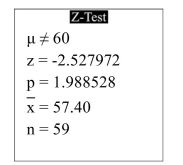 What is the value of the test statistic?
A) -2.527972
B) 1.988528
C) 60
D) 57.40
What is the value of the test statistic?A) -2.527972
B) 1.988528
C) 60
D) 57.40
Question
The following display from a TI-84 Plus calculator presents the results of a hypothesis test. 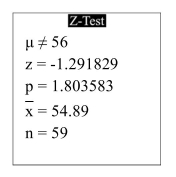 What is the P-value?
A) 54.89
B) 1.803583
C) 56
D) -1.291829
What is the P-value?A) 54.89
B) 1.803583
C) 56
D) -1.291829
Question
Forty-three members of a bowling league sign up for a program that claims to improve bowling scores. The participants bowl a set of five games before the program begins and a set of five games again at
The end to measure their improvement.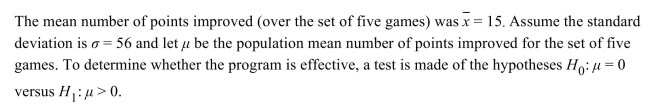 Compute the P-value.
A) 0.0198
B) 0.0395
C) 0.0099
D) 1.7565
The end to measure their improvement.
Compute the P-value.A) 0.0198
B) 0.0395
C) 0.0099
D) 1.7565
Question
The following display from a TI-84 Plus calculator presents the results of a hypothesis test. 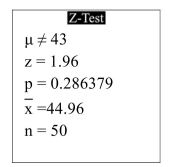 What are the null and alternate hypotheses?
A)
B)
C)
D)
What are the null and alternate hypotheses? A)
B)
C)
D)
Question
The following output from MINITAB presents the results of a hypothesis test. 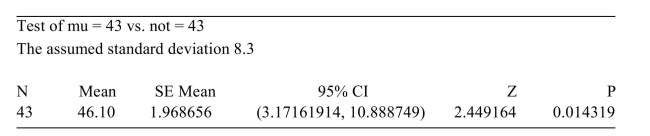 What is the P-value?
A) 1.968656
B) 0.014319
C) 46.10
D) 2.449164
What is the P-value?A) 1.968656
B) 0.014319
C) 46.10
D) 2.449164
Question
The following output from MINITAB presents the results of a hypothesis test. 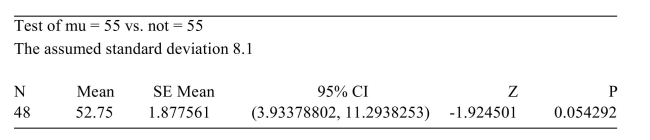 What are the null and alternate hypotheses?
A)
B)
C)
D)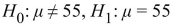
What are the null and alternate hypotheses? A)
B)
C)
D)
Question
A) Yes
B) There is not enough information to draw a conclusion.
C) No
Question
Forty-six members of a bowling league sign up for a program that claims to improve bowling scores. The participants bowl a set of five games before the program begins and a set of five games again at the end to
Measure their improvement.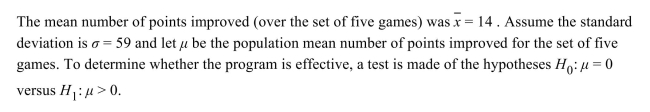 Compute the value of the test statistic.
A) 1.61
B) 12.36
C) 0.24
D) 0.0537
Measure their improvement.
Compute the value of the test statistic.A) 1.61
B) 12.36
C) 0.24
D) 0.0537
Question
A sample of 43 students enroll in a program that claims to improve scores on the quantitative reasoning portion of the Graduate Record Examination (GRE). The participants take a mock GRE test before the
Program begins and again at the end to measure their improvement.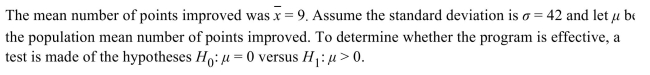 Using technology, compute the P-value.
A) 0.039993052
B) 1.405165398
C) 0.019996526
D) 0.079986104
Program begins and again at the end to measure their improvement.
Using technology, compute the P-value.A) 0.039993052
B) 1.405165398
C) 0.019996526
D) 0.079986104
Question
A sample of 46 students enroll in a program that claims to improve scores on the quantitative reasoning portion of the Graduate Record Examination (GRE). The participants take a mock GRE test before the
Program begins and again at the end to measure their improvement.
The mean number of points improved was Assume the standard deviation is
  and let
  be
be
The population mean number of points improved. To determine whether the program is effective, a
Test is made of the hypotheses versus
  Compute the value of the test statistic.
A) 0.28
B) 0.0307
C) 1.87
D) 11.80
Program begins and again at the end to measure their improvement.
The mean number of points improved was
Assume the standard deviation is and let beThe population mean number of points improved. To determine whether the program is effective, a
Test is made of the hypotheses
versus Compute the value of the test statistic.A) 0.28
B) 0.0307
C) 1.87
D) 11.80
Question
Forty-three members of a bowling league sign up for a program that claims to improve bowling scores. The participants bowl a set of five games before the program begins and a set of five games again at the end to measure their improvement. The mean number of points improved (over the set of five games) was  Assume the standard deviation is
  and let \mu be the population mean number of points improved for the set of five games. To determine whether the program is effective, a test is made of the hypotheses
  versus
i). Compute the value of the test statistic.
ii). Compute the P-value.
iii). Do you reject H0 at the =0.01 level?
Assume the standard deviation is and let \mu be the population mean number of points improved for the set of five games. To determine whether the program is effective, a test is made of the hypotheses versus i). Compute the value of the test statistic.
ii). Compute the P-value.
iii). Do you reject H0 at the
=0.01 level? Question
A sample of 36 students enroll in a program that claims to improve scores on the quantitative reasoning portion of the Graduate Record Examination (GRE). The participants take a mock GRE test before the
Program begins and again at the end to measure their improvement.
A) No
B) There is not enough information to draw a conclusion.
C) Yes
Program begins and again at the end to measure their improvement.
A) No
B) There is not enough information to draw a conclusion.
C) Yes
Question
According to a survey, the mean height for men is 68.9 inches. In a sample of 320 men between the ages of 60 and 69 , the mean height was  inches. Public health officials want to determine whether the mean height
  for older men is less than the mean height of all adult men. Assuming the population standard deviation to be
  inches, compute the P-value.
A) 0.0287
B) -1.9030
C) 0.0574
D) 0.9713
inches. Public health officials want to determine whether the mean height for older men is less than the mean height of all adult men. Assuming the population standard deviation to be inches, compute the P-value.A) 0.0287
B) -1.9030
C) 0.0574
D) 0.9713
Question
Find the P-value for the given test statistic t, sample size n, and alternate hypothesis H1. t=13.989, n=3, 
A) 0.0025
B) 0.005
C) 0.002
D) 0.001
A) 0.0025
B) 0.005
C) 0.002
D) 0.001
Question

A) 0.25 < P < 0.4
B) 0.05 < P < 0.1
C) 0.025 < P < 0.05
D) 0.01 < P < 0.025
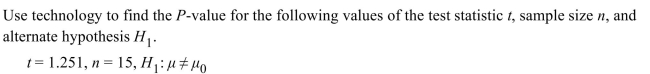
Question
A) 0.1355
B) 0.1398
C) 0.2710
D) 0.2796
Question
A market research firm reported that the mean annual earnings of all family practitioners in the United States was $180,612. A random sample of 56 family practitioners in New York that month had mean earnings of  =$190,854 with a standard deviation of $41,847. You wish to test whether family practitioners in New York make more than the national average.
State the null and alternate hypotheses.
A)
B)
C)
D)
=$190,854 with a standard deviation of $41,847. You wish to test whether family practitioners in New York make more than the national average.State the null and alternate hypotheses.
A)
B)
C)
D)
Question
A market research firm reported that the mean annual earnings of all family practitioners in the United States was $179,574. A random sample of 38 family practitioners in New York that month
Had mean earnings of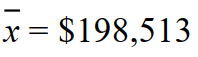 with a standard deviation of $35,113. You wish to test whether Family practitioners in New York make more than the national average. State a conclusion regarding H0. Use the
  level of significance.
A) Do not reject H0: there is insufficient evidence to conclude that the mean annual earnings are greater than the national average.
B) Reject H0 : the mean annual earnings appear to be greater than the national average.
C) There is not enough information to draw a conclusion.
Had mean earnings of
with a standard deviation of $35,113. You wish to test whether Family practitioners in New York make more than the national average. State a conclusion regarding H0. Use the level of significance.A) Do not reject H0: there is insufficient evidence to conclude that the mean annual earnings are greater than the national average.
B) Reject H0 : the mean annual earnings appear to be greater than the national average.
C) There is not enough information to draw a conclusion.
Question
The following prices, in dollars, of 7.5-cubic-foot refrigerators were recorded from a random sample. 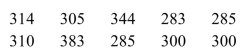 A consumer organization reports that the mean price of 7.5-cubic-foot refrigerators is greater than $300. Do the data provide convincing evidence of this claim? Use the
  level of significance and assume the
Population is normally distributed.
A) Reject . There is sufficient evidence to conclude that the mean price is greater than $300
B) Do not reject
There is not sufficient evidence to conclude that the mean price is greater than $300
C) There is not enough information to draw a conclusion.
A consumer organization reports that the mean price of 7.5-cubic-foot refrigerators is greater than $300. Do the data provide convincing evidence of this claim? Use the level of significance and assume thePopulation is normally distributed.
A) Reject
. There is sufficient evidence to conclude that the mean price is greater than $300B) Do not reject
There is not sufficient evidence to conclude that the mean price is greater than $300
C) There is not enough information to draw a conclusion.
Question
In a study to determine whether counseling could help people lose weight, a sample of people experienced a group-based behavioral intervention, which involved weekly meetings with a trained interventionist for a
Period of six months. The following data are numbers of pounds lost for 14 people.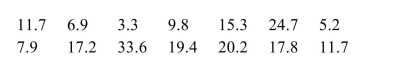 The following is a boxplot for these data. Is it reasonable to assume that the conditions for performing a
Hypothesis test are satisfied?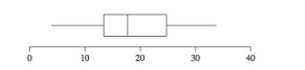
A) Yes
B) No
Period of six months. The following data are numbers of pounds lost for 14 people.
The following is a boxplot for these data. Is it reasonable to assume that the conditions for performing aHypothesis test are satisfied?
A) Yes
B) No
Question
A psychologist is designing an experiment in which rats will navigate a maze. Ten rats run the maze, and the time it takes for each to complete the maze is recorded. The results are as follows: 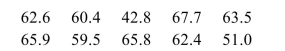 Following is a boxplot for the data. Is it reasonable to assume the conditions for performing a hypothesis test
Are satisfied?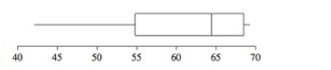
A) Yes
B) No
Following is a boxplot for the data. Is it reasonable to assume the conditions for performing a hypothesis testAre satisfied?
A) Yes
B) No
Question
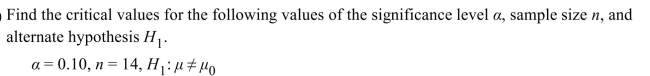
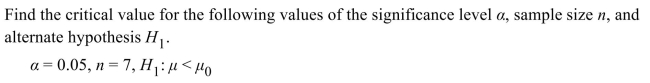
A) -1.771, 1.771
B) -1.761, 1.761
C) -1.282, 1.282
D) -1.350, 1.350
Question
Question
A market research firm reported that the mean annual earnings of all family practitioners in the United States was $178,695. A random sample of 53 family practitioners in New York that month
Had mean earnings of with a standard deviation of $35,332. You wish to test whether
Family practitioners in New York make more than the national average.
Compute the value of the test statistic and state the number of degrees of freedom.
A) 3.785; 53 degrees of freedom
B) 0.010; 52 degrees of freedom
C) 0.010; 53 degrees of freedom
D) 3.785; 52 degrees of freedom
Had mean earnings of
with a standard deviation of $35,332. You wish to test whetherFamily practitioners in New York make more than the national average.
Compute the value of the test statistic and state the number of degrees of freedom.
A) 3.785; 53 degrees of freedom
B) 0.010; 52 degrees of freedom
C) 0.010; 53 degrees of freedom
D) 3.785; 52 degrees of freedom
Question
A market research firm reported that the mean annual earnings of all family practitioners in the
United States was $178,011. A random sample of 38 family practitioners in New York that month
had mean earnings of with a standard deviation of $35,332. You wish to test whether
family practitioners in New York make more than the national average.
i). State the null and alternate hypotheses.
ii). Compute the value of the test statistic and state the number of degrees of freedom.
iii). State a conclusion regarding H0 . Use the =0.1 level of significance.
United States was $178,011. A random sample of 38 family practitioners in New York that month
had mean earnings of
with a standard deviation of $35,332. You wish to test whetherfamily practitioners in New York make more than the national average.
i). State the null and alternate hypotheses.
ii). Compute the value of the test statistic and state the number of degrees of freedom.
iii). State a conclusion regarding H0 . Use the
=0.1 level of significance. Question
In an attempt to increase business on Monday nights, a restaurant offers a free dessert with every dinner order. Before the offer, the mean number of dinner customers on Monday was 150. Following are the numbers of
Diners on a random sample of Mondays while the offer was in effect.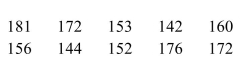 Can you conclude that the mean number of diners increased while the offer was in effect? Use the α =
Level of significance and assume the population is normally distributed.
A) Reject . There is sufficient evidence to conclude that the mean number of diners increased
While the offer was in effect.
B) Do not reject . There is insufficient evidence to conclude that the mean number of diners
Increased while the offer was in effect.
C) There is not enough information to draw a conclusion.
Diners on a random sample of Mondays while the offer was in effect.
Can you conclude that the mean number of diners increased while the offer was in effect? Use the α =Level of significance and assume the population is normally distributed.
A) Reject
. There is sufficient evidence to conclude that the mean number of diners increasedWhile the offer was in effect.
B) Do not reject
. There is insufficient evidence to conclude that the mean number of dinersIncreased while the offer was in effect.
C) There is not enough information to draw a conclusion.
Question
The mean annual tuition and fees for a sample of 12 private colleges was $40,500 with a standard deviation of $5,000 A dotplot shows that it is reasonable to assume that the population is
Approximately normal. You wish to test whether the mean tuition and fees for private colleges is
Different from $37,400. State a conclusion regarding H0 . Use the level of significance.
A) There is not enough information to draw a conclusion.
B) Reject H0. The mean annual tuition and fees appears to be different from $37,400.
C) Do not reject H0.
Approximately normal. You wish to test whether the mean tuition and fees for private colleges is
Different from $37,400. State a conclusion regarding H0 . Use the
level of significance.A) There is not enough information to draw a conclusion.
B) Reject H0. The mean annual tuition and fees appears to be different from $37,400.
C) Do not reject H0.
Question
A) -1.895
B) -2.447
C) -1.943
D) -1.645
Question
A) 0.2314
B) 0.1157
C) 0.2300
D) 0.1150
Question
A machine that fills beverage cans is supposed to put 12 ounces of beverage in each can. The amounts measured in a simple random sample of eight cans are: 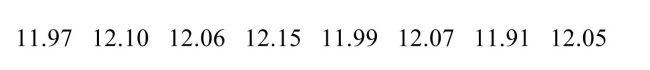 The following is a dotplot for these data. Is it reasonable to assume the conditions for performing a hypothesis
Test are satisfied?
A) No
B) Yes
The following is a dotplot for these data. Is it reasonable to assume the conditions for performing a hypothesisTest are satisfied?
A) No
B) Yes
Question
Following are outstanding credit card balances for a sample of 16 college seniors at a large university. 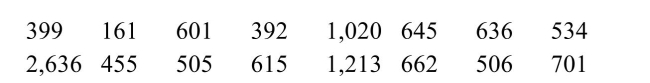 The dotplot of this data is below. Is it reasonable to assume that the conditions for performing a hypothesis test are satisfied?
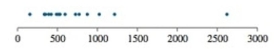
A) Yes
B) No
The dotplot of this data is below. Is it reasonable to assume that the conditions for performing a hypothesis test are satisfied? A) Yes
B) No
Question
The mean annual tuition and fees for a sample of 15 private colleges was $41,200 with a standard deviation of $5,300. A dotplot shows that it is reasonable to assume that the population is
Approximately normal. You wish to test whether the mean tuition and fees for private colleges is
Different from $38,000.
State the null and alternate hypotheses.
A)
B)
C)
D)
Approximately normal. You wish to test whether the mean tuition and fees for private colleges is
Different from $38,000.
State the null and alternate hypotheses.
A)
B)
C)
D)
Question
The mean annual tuition and fees for a sample of 11 private colleges was $26,500 with a standard
deviation of $6,000. A dotplot shows that it is reasonable to assume that the population is
approximately normal. You wish to test whether the mean tuition and fees for private colleges is
different from $31,000.
i). State the null and alternate hypotheses.
ii). Compute the value of the test statistic and state the number of degrees of freedom.
iii). State a conclusion regarding H0. Use the =0.05 level of significance.
deviation of $6,000. A dotplot shows that it is reasonable to assume that the population is
approximately normal. You wish to test whether the mean tuition and fees for private colleges is
different from $31,000.
i). State the null and alternate hypotheses.
ii). Compute the value of the test statistic and state the number of degrees of freedom.
iii). State a conclusion regarding H0. Use the
=0.05 level of significance.
Unlock Deck
Sign up to unlock the cards in this deck!
Unlock Deck
Unlock Deck
1/115
Play
Full screen (f)
Deck 9: Hypothesis Testing
1
A test is made of . A sample of size n = 67 is drawn, and . The population standard deviation is . Compute the value of the test statistic z.
A) 0.15
B) -1.02
C) -5.01
D) -0.12
. A sample of size n = 67 is drawn, and . The population standard deviation is . Compute the value of the test statistic z.A) 0.15
B) -1.02
C) -5.01
D) -0.12
-1.02
2
A fleet of rental cars - all the same make, model, and year - has a mean fuel efficiency of 25 miles per gallon (mpg). A random sample of 57 cars are selected and the air filter of each is replaced with
A new one. Let be the population mean fuel efficiency score that would occur if every car's air
Filter were replaced. The air filter change is deemed effective if mpg. A test is made of . Consider these possible conclusions:
i. The air filter changes are effective.
ii. The air filter changes are not effective.
iii.. The air filter changes might not be effective.
Which of the three conclusions is best if is not rejected?
A) ii
B) i
C) iii
A new one. Let
be the population mean fuel efficiency score that would occur if every car's airFilter were replaced. The air filter change is deemed effective if
mpg. A test is made of . Consider these possible conclusions:i. The air filter changes are effective.
ii. The air filter changes are not effective.
iii.. The air filter changes might not be effective.
Which of the three conclusions is best if
is not rejected?A) ii
B) i
C) iii
iii
3
A test is made of versus . A sample of size n=60 is drawn, and The population standard deviation is . Compute the value of the test statistic z and determine if is rejected at the level.
A) 0.22, not rejected
B) 1.68, rejected
C) 0.22, rejected
D) 1.68, not rejected
versus . A sample of size n=60 is drawn, and The population standard deviation is . Compute the value of the test statistic z and determine if is rejected at the level.A) 0.22,
not rejectedB) 1.68,
rejectedC) 0.22,
rejectedD) 1.68,
not rejected1.68, not rejected
not rejected 4
A new organic pest control formula is being tested on potato plants to see whether it can reduce the level of potato beetle infestation. The mean number of beetles per untreated plant is 8. It is hoped That the new formula may reduce this infestation rate. State the appropriate null and alternate
Hypotheses.
A)
B)
C)
D)
Hypotheses.
A)
B)
C)
D)
Unlock Deck
Unlock for access to all 115 flashcards in this deck.
Unlock Deck
k this deck
5
A garden supplier claims that its new variety of giant tomato produces fruit with a mean weight of 38 ounces. A test is made of versus . The null hypothesis is rejected. State the
Appropriate conclusion.
A) There is not enough evidence to conclude that the mean weight is 38 ounces.
B) The mean weight is equal to 38 ounces.
C) There is not enough evidence to conclude that the mean weight differs from 38 ounces.
D) The mean weight is not equal to 38 ounces.
versus . The null hypothesis is rejected. State theAppropriate conclusion.
A) There is not enough evidence to conclude that the mean weight is 38 ounces.
B) The mean weight is equal to 38 ounces.
C) There is not enough evidence to conclude that the mean weight differs from 38 ounces.
D) The mean weight is not equal to 38 ounces.
Unlock Deck
Unlock for access to all 115 flashcards in this deck.
Unlock Deck
k this deck
6
A garden supplier claims that its new variety of giant tomato produces fruit with a mean weight of 42 ounces. A test is made of . The null hypothesis is not rejected. State
The appropriate conclusion.
A) There is not enough evidence to conclude that the mean weight is 42 ounces.
B) The mean weight is not equal to 42 ounces.
C) The mean weight is equal to 42 ounces.
D) There is not enough evidence to conclude that the mean weight differs from 42 ounces.
. The null hypothesis is not rejected. StateThe appropriate conclusion.
A) There is not enough evidence to conclude that the mean weight is 42 ounces.
B) The mean weight is not equal to 42 ounces.
C) The mean weight is equal to 42 ounces.
D) There is not enough evidence to conclude that the mean weight differs from 42 ounces.
Unlock Deck
Unlock for access to all 115 flashcards in this deck.
Unlock Deck
k this deck
7
A fleet of rental cars - all the same make, model, and year - has a mean fuel efficiency of 24 miles per gallon (mpg). A random sample of 44 cars are selected and the air filter of each is replaced with a new one. Let = be the population mean fuel efficiency score that would occur if every car's air filter were replaced. The air filter change is deemed effective if >24 mpg. A test is made of versus https://d2lvgg3v3hfg70.cloudfront.net/TB34225555/. Consider these possible conclusions:
i. The air filter changes are effective.
ii. The air filter changes are not effective.
Iii. The air filter changes might not be successful.
Which of the three conclusions is best if is rejected?
A) iii
B) ii
C) i
be the population mean fuel efficiency score that would occur if every car's air filter were replaced. The air filter change is deemed effective if >24 mpg. A test is made of versus https://d2lvgg3v3hfg70.cloudfront.net/TB34225555/. Consider these possible conclusions:i. The air filter changes are effective.
ii. The air filter changes are not effective.
Iii. The air filter changes might not be successful.
Which of the three conclusions is best if
is rejected?A) iii
B) ii
C) i
Unlock Deck
Unlock for access to all 115 flashcards in this deck.
Unlock Deck
k this deck
8
A sample of 50 chewable vitamin tablets have a sample mean of 300 milligrams of vitamin C. Nutritionists want to perform a hypothesis test to determine how strong the evidence is that the
Mean mass of vitamin C per tablet differs from 297 milligrams. State the appropriate null and
Alternate hypotheses.
A)
B)
C)
D)
Mean mass of vitamin C per tablet differs from 297 milligrams. State the appropriate null and
Alternate hypotheses.
A)
B)
C)
D)
Unlock Deck
Unlock for access to all 115 flashcards in this deck.
Unlock Deck
k this deck
9
Determine whether the outcome is a Type I error, a Type II error, or a correct decision. A test is made of H0: μ=48 versus H1:μ≠ 48. The true value of is 48 and H0 is not rejected.
A) Correct decision
B) Type I error
C) Type II error
A) Correct decision
B) Type I error
C) Type II error
Unlock Deck
Unlock for access to all 115 flashcards in this deck.
Unlock Deck
k this deck
10
A grocery store owner claims that the mean amount spent per checkout is more than $74. A test is made of . The null hypothesis is rejected. State the appropriate
Conclusion.
A) The mean checkout amount is greater than $74.
B) There is not enough evidence to conclude that the mean checkout price is greater than $74.
C) The mean checkout amount is less than or equal to $74.
D) There is not enough evidence to conclude that the mean checkout price is less than or equal to $74.
. The null hypothesis is rejected. State the appropriateConclusion.
A) The mean checkout amount is greater than $74.
B) There is not enough evidence to conclude that the mean checkout price is greater than $74.
C) The mean checkout amount is less than or equal to $74.
D) There is not enough evidence to conclude that the mean checkout price is less than or equal to $74.
Unlock Deck
Unlock for access to all 115 flashcards in this deck.
Unlock Deck
k this deck
11
A sample of 60 chewable vitamin tablets have a sample mean of 275 milligrams of vitamin C. Nutritionists want to perform a hypothesis test to determine how strong the evidence is that the
Mean mass of vitamin C per tablet exceeds 272 milligrams. State the appropriate null and alternate
Hypotheses.
A)
B)
C)
D)
Mean mass of vitamin C per tablet exceeds 272 milligrams. State the appropriate null and alternate
Hypotheses.
A)
B)
C)
D)
Unlock Deck
Unlock for access to all 115 flashcards in this deck.
Unlock Deck
k this deck
12
A test of versus is performed using a significance level of =0.05. The value of the test statistic is z=-1.81. Is rejected?
A) Yes
B) No
C) It cannot be determined.
versus is performed using a significance level of =0.05. The value of the test statistic is z=-1.81. Is rejected?A) Yes
B) No
C) It cannot be determined.
Unlock Deck
Unlock for access to all 115 flashcards in this deck.
Unlock Deck
k this deck
13
A test is made of versus . A sample of size n=76 is drawn, and . The population standard deviation is https://d2lvgg3v3hfg70.cloudfront.net/TB34225555/. Compute the value of the test statistic z and determine if is rejected at the level.
A) 0.16, H0 rejected
B) 1.39, H0 rejected
C) 1.39, H0 not rejected
D) 0.16, H0 not rejected
versus . A sample of size n=76 is drawn, and . The population standard deviation is https://d2lvgg3v3hfg70.cloudfront.net/TB34225555/. Compute the value of the test statistic z and determine if is rejected at the level.A) 0.16, H0 rejected
B) 1.39, H0 rejected
C) 1.39, H0 not rejected
D) 0.16, H0 not rejected
Unlock Deck
Unlock for access to all 115 flashcards in this deck.
Unlock Deck
k this deck
14
A fleet of rental cars - all the same make, model, and year - has a mean fuel efficiency of 23.4 miles per gallon (mpg). A random sample of 41 cars are selected and the air filter of each is replaced with
A new one. Let μ be the population mean fuel efficiency score that would occur if every car's air
Filter were replaced. The air filter change is deemed effective if mpg. A test is made of Assume that the air filter changes are effective but the conclusion is reached that the changes might not be
Effective. Which type of error, of any, has occurred?
A) Type II
B) No error - correct decision
C) Type I
D) Mechanical failure
A new one. Let μ be the population mean fuel efficiency score that would occur if every car's air
Filter were replaced. The air filter change is deemed effective if
mpg. A test is made of Assume that the air filter changes are effective but the conclusion is reached that the changes might not beEffective. Which type of error, of any, has occurred?
A) Type II
B) No error - correct decision
C) Type I
D) Mechanical failure
Unlock Deck
Unlock for access to all 115 flashcards in this deck.
Unlock Deck
k this deck
15
A test is made of versus A sample of size n=67 is drawn, and =45 . The population standard deviation is =29 . Compute the value of the test statistic
A) 0.14
B) 1.13
C) 6.08
D) 0.87
versus A sample of size n=67 is drawn, and =45 . The population standard deviation is =29 . Compute the value of the test statistic A) 0.14
B) 1.13
C) 6.08
D) 0.87
Unlock Deck
Unlock for access to all 115 flashcards in this deck.
Unlock Deck
k this deck
16
Determine whether the alternative hypothesis is left-tailed, right-tailed, or two-tailed.
A) two-tailed
B) right-tailed
C) left-tailed
A) two-tailed
B) right-tailed
C) left-tailed
Unlock Deck
Unlock for access to all 115 flashcards in this deck.
Unlock Deck
k this deck
17
A fleet of rental cars - all the same make, model, and year - has a mean fuel efficiency of 24.3 miles per gallon (mpg). A random sample of 43 cars are selected and the air filter of each is replaced with
A new one. Let μ be the population mean fuel efficiency score that would occur if every car's air
Filter were replaced. The air filter change is deemed effective if . A test is made of Assume that the air filter changes are not effective. Which type of error is impossible?
A) Type I
B) Type II
A new one. Let μ be the population mean fuel efficiency score that would occur if every car's air
Filter were replaced. The air filter change is deemed effective if
. A test is made of Assume that the air filter changes are not effective. Which type of error is impossible?A) Type I
B) Type II
Unlock Deck
Unlock for access to all 115 flashcards in this deck.
Unlock Deck
k this deck
18
Determine whether the outcome is a Type I error, a Type II error, or a correct decision. A test is made of H0:μ=62 versus H1:μ≠62
The true value of is 64 and H0 is rejected.
A) Type I error
B) Type II error
C) Correct decision
The true value of
is 64 and H0 is rejected.A) Type I error
B) Type II error
C) Correct decision
Unlock Deck
Unlock for access to all 115 flashcards in this deck.
Unlock Deck
k this deck
19
A grocery store owner claims that the mean amount spent per checkout is more than $85. A test is made of . The null hypothesis is not rejected. State the appropriate
Conclusion.
A) The mean checkout amount is less than or equal to $85.
B) There is not enough evidence to conclude that the mean checkout price is less than or equal to $85.
C) The mean checkout amount is greater than $85.
D) There is not enough evidence to conclude that the mean checkout price is greater than $85.
. The null hypothesis is not rejected. State the appropriateConclusion.
A) The mean checkout amount is less than or equal to $85.
B) There is not enough evidence to conclude that the mean checkout price is less than or equal to $85.
C) The mean checkout amount is greater than $85.
D) There is not enough evidence to conclude that the mean checkout price is greater than $85.
Unlock Deck
Unlock for access to all 115 flashcards in this deck.
Unlock Deck
k this deck
20
A fleet of rental cars - all the same make, model, and year - has a mean fuel efficiency of 25.2 miles per gallon (mpg). A random sample of 59 cars are selected and the air filter of each is replaced with
A new one. Let μ be the population mean fuel efficiency score that would occur if every car's air Filter were replaced. The air filter change is deemed effective if mpg. A test is made of Assume that the air filter changes are effective. Which type of error is impossible?
A) Type I
B) Type II
A new one. Let μ be the population mean fuel efficiency score that would occur if every car's air Filter were replaced. The air filter change is deemed effective if
mpg. A test is made of Assume that the air filter changes are effective. Which type of error is impossible?A) Type I
B) Type II
Unlock Deck
Unlock for access to all 115 flashcards in this deck.
Unlock Deck
k this deck
21
A test of H0: =57 versus H1: 57 is performed using a significance level of :=0.05. The P-value is 0.138 . Is H0 rejected?
A) It cannot be determined.
B) Yes
C) No
=57 versus H1: 57 is performed using a significance level of :=0.05. The P-value is 0.138 . Is H0 rejected?A) It cannot be determined.
B) Yes
C) No
Unlock Deck
Unlock for access to all 115 flashcards in this deck.
Unlock Deck
k this deck
22
A) Type I error
B) Type II error
C) Correct decision
Unlock Deck
Unlock for access to all 115 flashcards in this deck.
Unlock Deck
k this deck
23
Alice will perform a hypothesis test at the =0.05 level. Bob will perform the same test at the = 0.01 level. If H0 is true, who has the greater probability of making a type I error?
A) Alice
B) Bob
C) Neither
=0.05 level. Bob will perform the same test at the = 0.01 level. If H0 is true, who has the greater probability of making a type I error?A) Alice
B) Bob
C) Neither
Unlock Deck
Unlock for access to all 115 flashcards in this deck.
Unlock Deck
k this deck
24
A) Correct decision
B) Type I error
C) Type II error
Unlock Deck
Unlock for access to all 115 flashcards in this deck.
Unlock Deck
k this deck
25
The Golden Comet is a hybrid chicken that is prized for its high egg production rate and gentle disposition. According to recent studies, the mean rate of egg production for 1-year-old Golden Comets is 5.1 eggs/week.
Sarah has 35 1-year-old hens that are fed exclusively on natural scratch feed: insects, seeds, and plants that the hens obtain as they range freely around the farm. Her hens exhibit a mean egg-laying rate of 5.4 eggs/day.
Sarah wants to determine whether the mean laying rate for her hens is higher than the mean rate for all Golden Comets. Assume the population standard deviation to be
i. State the appropriate null and alternate hypotheses.
ii. Compute the value of the test statistic.
iii. State a conclusion. Use the level of significance.
Sarah has 35 1-year-old hens that are fed exclusively on natural scratch feed: insects, seeds, and plants that the hens obtain as they range freely around the farm. Her hens exhibit a mean egg-laying rate of 5.4 eggs/day.
Sarah wants to determine whether the mean laying rate
for her hens is higher than the mean rate for all Golden Comets. Assume the population standard deviation to be i. State the appropriate null and alternate hypotheses.
ii. Compute the value of the test statistic.
iii. State a conclusion. Use the
level of significance. Unlock Deck
Unlock for access to all 115 flashcards in this deck.
Unlock Deck
k this deck
26
The Golden Comet is a hybrid chicken that is prized for its high egg production rate and gentle disposition. According to recent studies, the mean rate of egg production for 1-year-old Golden
Comets is 5.4 eggs/week.
Sarah has 46 1-year-old hens that are fed exclusively on natural scratch feed: insects, seeds, and
Plants that the hens obtain as they range freely around the farm. Her hens exhibit a mean egg-laying
Rate of 5.9 eggs/day.
Sarah wants to determine whether the mean laying rate for her hens is higher than the mean rate for all
Golden Comets. State the appropriate null and alternate hypotheses.
A)
B)
C)
D)
Comets is 5.4 eggs/week.
Sarah has 46 1-year-old hens that are fed exclusively on natural scratch feed: insects, seeds, and
Plants that the hens obtain as they range freely around the farm. Her hens exhibit a mean egg-laying
Rate of 5.9 eggs/day.
Sarah wants to determine whether the mean laying rate
for her hens is higher than the mean rate for allGolden Comets. State the appropriate null and alternate hypotheses.
A)
B)
C)
D)
Unlock Deck
Unlock for access to all 115 flashcards in this deck.
Unlock Deck
k this deck
27
If P=0.016, which of the following is the best conclusion?
A) If H0 is false, the probability of obtaining a test statistic as extreme as or more extreme than the one actually observed is 0.016.
B) If H0 is true, the probability of obtaining a test statistic as extreme as or more extreme than the one actually observed is 0.016.
C) The probability that H0 is true is 0.016.
D) The probability that H0 is false is 0.016 .
Unlock Deck
Unlock for access to all 115 flashcards in this deck.
Unlock Deck
k this deck
28
A test of H0: =59 versus H1: 59 is performed using a significance level of =0.01 . The value of the test statistic is z=-2.66.
If the true value of is 55 , does the conclusion result in a Type I error, a Type II error, or a correct decision?
A) Type I error
B) Correct decision
C) Type II error
=59 versus H1: 59 is performed using a significance level of =0.01 . The value of the test statistic is z=-2.66.If the true value of
is 55 , does the conclusion result in a Type I error, a Type II error, or a correct decision?A) Type I error
B) Correct decision
C) Type II error
Unlock Deck
Unlock for access to all 115 flashcards in this deck.
Unlock Deck
k this deck
29
Mercury is a heavy metal that can cause severe health problems in even small concentrations. Fish and shellfish efficiently concentrate mercury into their flesh, so it is important to monitor seafood for its mercury
Content.
An extensive study conducted in 1980 concluded that the mean mercury level in oysters from the White Bear
Estuary was 0.021 parts per million (ppm) with a standard deviation In 2012, a
Sample of 47 oysters from the same estuary exhibited a mean mercury concentration of 0.017 ppm.
Can you conclude that the 2012 mercury concentration is lower than in 1980? Use the level of
Significance.
A) No. There is insufficient evidence to conclude that the mercury concentration has decreased from 1980 to 2012.
B) Yes. The mercury concentration appears to be lower in 2012.
C) There is not enough information to reach a conclusion.
Content.
An extensive study conducted in 1980 concluded that the mean mercury level in oysters from the White Bear
Estuary was 0.021 parts per million (ppm) with a standard deviation
In 2012, aSample of 47 oysters from the same estuary exhibited a mean mercury concentration of 0.017 ppm.
Can you conclude that the 2012 mercury concentration is lower than in 1980? Use the
level ofSignificance.
A) No. There is insufficient evidence to conclude that the mercury concentration has decreased from 1980 to 2012.
B) Yes. The mercury concentration appears to be lower in 2012.
C) There is not enough information to reach a conclusion.
Unlock Deck
Unlock for access to all 115 flashcards in this deck.
Unlock Deck
k this deck
30
A test of H0:=41 versus H1: 41 is performed using a significance level of =0.05 . The value of the test statistic is z=-1.84. Is H0 rejected?
A) No
B) It cannot be determined.
C) Yes
=41 versus H1: 41 is performed using a significance level of =0.05 . The value of the test statistic is z=-1.84. Is H0 rejected?A) No
B) It cannot be determined.
C) Yes
Unlock Deck
Unlock for access to all 115 flashcards in this deck.
Unlock Deck
k this deck
31
At a water bottling facility, a technician is testing a bottle filling machine that is supposed to deliver
500 milliliters of water. The technician dispenses 38 samples of water and determines the volume of
each sample. The 38 samples have a mean volume of . The machine is out of
calibration if the mean volume differs from 500 mL.
The technician wants to perform a hypothesis test to determine whether the machine is out of calibration. The
standard deviation of the dispensed volume is known to be
i). State the appropriate null and alternate hypotheses.
ii). Compute the value of the test statistic.
iii). State a conclusion. Use the level of significance.
500 milliliters of water. The technician dispenses 38 samples of water and determines the volume of
each sample. The 38 samples have a mean volume of
. The machine is out ofcalibration if the mean volume differs from 500 mL.
The technician wants to perform a hypothesis test to determine whether the machine is out of calibration. The
standard deviation of the dispensed volume is known to be
i). State the appropriate null and alternate hypotheses.
ii). Compute the value of the test statistic.
iii). State a conclusion. Use the
level of significance. Unlock Deck
Unlock for access to all 115 flashcards in this deck.
Unlock Deck
k this deck
32
A test of versus is performed using a significance level of =0.01 . The value of the test statistic is z=-2.24.
If the true value of is 49 does the conclusion result in a Type I error, a Type II error, or a correct decision?
A) Type II error
B) Type I error
C) Correct decision
versus is performed using a significance level of =0.01 . The value of the test statistic is z=-2.24.If the true value of
is 49 does the conclusion result in a Type I error, a Type II error, or a correct decision?A) Type II error
B) Type I error
C) Correct decision
Unlock Deck
Unlock for access to all 115 flashcards in this deck.
Unlock Deck
k this deck
33
A test of 45 versus is performed using a significance level of =0.01. The value of the test statistic is z=-2.24.
If the true value of is 45 , does the conclusion result in a Type I error, a Type II error, or a correct decision?
A) Type I error
B) Correct decision
C) Type II error
45 versus is performed using a significance level of =0.01. The value of the test statistic is z=-2.24.If the true value of
is 45 , does the conclusion result in a Type I error, a Type II error, or a correct decision?A) Type I error
B) Correct decision
C) Type II error
Unlock Deck
Unlock for access to all 115 flashcards in this deck.
Unlock Deck
k this deck
34
A test of H0:=55 versus H1: 55 is performed using a significance level of :=0.05 . The P-value is 0.048 .
If the true value of: is 59 , does the conclusion result in a Type I error, a Type II error, or a correct decision?
A) Type I error
B) Type II error
C) Correct decision
=55 versus H1: 55 is performed using a significance level of :=0.05 . The P-value is 0.048 .If the true value of
: is 59 , does the conclusion result in a Type I error, a Type II error, or a correct decision?A) Type I error
B) Type II error
C) Correct decision
Unlock Deck
Unlock for access to all 115 flashcards in this deck.
Unlock Deck
k this deck
35
A test of H0: =58 versus H1: 58 is performed using a significance level of =0.05 . The value of the test statistic is z=-2.08.
If the true value of=: is 58 , does the conclusion result in a Type I error, a Type II error, or a correct decision?
A) Correct decision
B) Type II error
C) Type I error
=58 versus H1: 58 is performed using a significance level of =0.05 . The value of the test statistic is z=-2.08.If the true value of
=: is 58 , does the conclusion result in a Type I error, a Type II error, or a correct decision?A) Correct decision
B) Type II error
C) Type I error
Unlock Deck
Unlock for access to all 115 flashcards in this deck.
Unlock Deck
k this deck
36
A) Yes
B) It cannot be determined.
C) No
Unlock Deck
Unlock for access to all 115 flashcards in this deck.
Unlock Deck
k this deck
37
At a water bottling facility, a technician is testing a bottle filling machine that is supposed to deliver 750 milliliters of water. The technician dispenses 38 samples of water and determines the volume of
Each sample. The 38 samples have a mean volume of . The machine is out of
Calibration if the mean volume differs from 750 mL.
The technician wants to perform a hypothesis test to determine whether the machine is out of calibration. The
Standard deviation of the dispensed volume is known to be Compute the value of the test statistic.
A) 3.00
B) 1.33
C) 0.18
D) 0.22
Each sample. The 38 samples have a mean volume of
. The machine is out ofCalibration if the mean volume differs from 750 mL.
The technician wants to perform a hypothesis test to determine whether the machine is out of calibration. The
Standard deviation of the dispensed volume is known to be
Compute the value of the test statistic.A) 3.00
B) 1.33
C) 0.18
D) 0.22
Unlock Deck
Unlock for access to all 115 flashcards in this deck.
Unlock Deck
k this deck
38
The Golden Comet is a hybrid chicken that is prized for its high egg production rate and gentle disposition. According to recent studies, the mean rate of egg production for 1-year-old Golden
Comets is 5.6 eggs/week.
Sarah has 41 1-year-old hens that are fed exclusively on natural scratch feed: insects, seeds, and
Plants that the hens obtain as they range freely around the farm. Her hens exhibit a mean egg-laying
Rate of 5.9 eggs/day.
Sarah wants to determine whether the mean laying rate μ for her hens is higher than the mean rate for all
Golden Comets. Assume the population standard deviation to be y. Compute the
Value of the test statistic.
A) 0.87
B) 0.18
C) 1.47
D) 1.13
Comets is 5.6 eggs/week.
Sarah has 41 1-year-old hens that are fed exclusively on natural scratch feed: insects, seeds, and
Plants that the hens obtain as they range freely around the farm. Her hens exhibit a mean egg-laying
Rate of 5.9 eggs/day.
Sarah wants to determine whether the mean laying rate μ for her hens is higher than the mean rate for all
Golden Comets. Assume the population standard deviation to be
y. Compute theValue of the test statistic.
A) 0.87
B) 0.18
C) 1.47
D) 1.13
Unlock Deck
Unlock for access to all 115 flashcards in this deck.
Unlock Deck
k this deck
39
A test of H0:=59 versus H1: 59 is performed using a significance level of =0.01 . The P-value is 0.115.
If the true value of is 59 , does the conclusion result in a Type I error, a Type II error, or a correct decision?
A) Type II error
B) Type I error
C) Correct decision
=59 versus H1: 59 is performed using a significance level of =0.01 . The P-value is 0.115.If the true value of
is 59 , does the conclusion result in a Type I error, a Type II error, or a correct decision?A) Type II error
B) Type I error
C) Correct decision
Unlock Deck
Unlock for access to all 115 flashcards in this deck.
Unlock Deck
k this deck
40
At a water bottling facility, a technician is testing a bottle filling machine that is supposed to deliver 1,000 milliliters of water. The technician dispenses 46 samples of water and determines the volume
Of each sample. The 46 samples have a mean volume of https://d2lvgg3v3hfg70.cloudfront.net/TB34225555/. The machine is out of
Calibration if the mean volume differs from 1,000 mL.
The technician wants to perform a hypothesis test to determine whether the machine is out of calibration.
State the appropriate null and alternate hypotheses.
A)
B)
C)
D)
Of each sample. The 46 samples have a mean volume of https://d2lvgg3v3hfg70.cloudfront.net/TB34225555/
. The machine is out ofCalibration if the mean volume differs from 1,000 mL.
The technician wants to perform a hypothesis test to determine whether the machine is out of calibration.
State the appropriate null and alternate hypotheses.
A)
B)
C)
D)
Unlock Deck
Unlock for access to all 115 flashcards in this deck.
Unlock Deck
k this deck
41
A sample of 39 students enroll in a program that claims to improve scores on the quantitative reasoning
portion of the Graduate Record Examination (GRE). The participants take a mock GRE test before the
program begins and again at the end to measure their improvement. The mean number of points improved was=7. Assume the standard deviation is =56 and let be، the population mean number of points improved. To determine whether the program is effective, a test is made of the hypotheses
i). Compute the value of the test statistic.
ii). Compute the P-value.
iii). Do you reject H0 at the level?
portion of the Graduate Record Examination (GRE). The participants take a mock GRE test before the
program begins and again at the end to measure their improvement. The mean number of points improved was
=7. Assume the standard deviation is =56 and let be، the population mean number of points improved. To determine whether the program is effective, a test is made of the hypotheses i). Compute the value of the test statistic.
ii). Compute the P-value.
iii). Do you reject H0 at the
level? Unlock Deck
Unlock for access to all 115 flashcards in this deck.
Unlock Deck
k this deck
42
A sample of 39 students enroll in a program that claims to improve scores on the quantitative reasoning portion of the Graduate Record Examination (GRE). The participants take a mock GRE test before the
Program begins and again at the end to measure their improvement. Compute the P-value.
A) 0.0305
B) 0.0076
C) 1.8735
D) 0.0153
Program begins and again at the end to measure their improvement.
Compute the P-value.A) 0.0305
B) 0.0076
C) 1.8735
D) 0.0153
Unlock Deck
Unlock for access to all 115 flashcards in this deck.
Unlock Deck
k this deck
43
The following output from MINITAB presents the results of a hypothesis test.
Do you reject H0 at the level?
A) No
B) Yes
C) There is not enough information to draw a conclusion.
Do you reject H0 at the
level?A) No
B) Yes
C) There is not enough information to draw a conclusion.
Unlock Deck
Unlock for access to all 115 flashcards in this deck.
Unlock Deck
k this deck
44
The following output from MINITAB presents the results of a hypothesis test. What is the value of the test statistic?
A) 0.002009
B) 1.359737
C) -3.088977
D) 31.26
What is the value of the test statistic?A) 0.002009
B) 1.359737
C) -3.088977
D) 31.26
Unlock Deck
Unlock for access to all 115 flashcards in this deck.
Unlock Deck
k this deck
45
Forty members of a bowling league sign up for a program that claims to improve bowling scores. The participants bowl a set of five games before the program begins and a set of five games again at the end to
Measure their improvement.
A) Yes
B) There is not enough information to draw a conclusion.
C) No
Measure their improvement.
A) Yes
B) There is not enough information to draw a conclusion.
C) No
Unlock Deck
Unlock for access to all 115 flashcards in this deck.
Unlock Deck
k this deck
46
According to a survey, the mean height for men is 68.6 inches. In a sample of 320 men between the ages of 60 and 69 , the mean height was inches. Public health officials want to determine whether the mean height for older men is less than the mean height of all adult men. Assuming the population standard deviation to be inches, compute the value of the test statistic.
A) 0.74
B) 429.95
C) -0.63
D) 0.63
inches. Public health officials want to determine whether the mean height for older men is less than the mean height of all adult men. Assuming the population standard deviation to be inches, compute the value of the test statistic.A) 0.74
B) 429.95
C) -0.63
D) 0.63
Unlock Deck
Unlock for access to all 115 flashcards in this deck.
Unlock Deck
k this deck
47
Forty-three members of a bowling league sign up for a program that claims to improve bowling scores. The participants bowl a set of five games before the program begins and a set of five games again at
The end to measure their improvement. Using technology, compute the P-value.
A) 0.0994
B) 0.1987
C) 0.0497
D) 0.8461
The end to measure their improvement.
Using technology, compute the P-value.A) 0.0994
B) 0.1987
C) 0.0497
D) 0.8461
Unlock Deck
Unlock for access to all 115 flashcards in this deck.
Unlock Deck
k this deck
48
The following display from a TI-84 Plus calculator presents the results of a hypothesis test. What is the value of the test statistic?
A) -2.527972
B) 1.988528
C) 60
D) 57.40
What is the value of the test statistic?A) -2.527972
B) 1.988528
C) 60
D) 57.40
Unlock Deck
Unlock for access to all 115 flashcards in this deck.
Unlock Deck
k this deck
49
The following display from a TI-84 Plus calculator presents the results of a hypothesis test. What is the P-value?
A) 54.89
B) 1.803583
C) 56
D) -1.291829
What is the P-value?A) 54.89
B) 1.803583
C) 56
D) -1.291829
Unlock Deck
Unlock for access to all 115 flashcards in this deck.
Unlock Deck
k this deck
50
Forty-three members of a bowling league sign up for a program that claims to improve bowling scores. The participants bowl a set of five games before the program begins and a set of five games again at
The end to measure their improvement. Compute the P-value.
A) 0.0198
B) 0.0395
C) 0.0099
D) 1.7565
The end to measure their improvement.
Compute the P-value.A) 0.0198
B) 0.0395
C) 0.0099
D) 1.7565
Unlock Deck
Unlock for access to all 115 flashcards in this deck.
Unlock Deck
k this deck
51
The following display from a TI-84 Plus calculator presents the results of a hypothesis test. What are the null and alternate hypotheses?
A)
B)
C)
D)
What are the null and alternate hypotheses? A)
B)
C)
D)
Unlock Deck
Unlock for access to all 115 flashcards in this deck.
Unlock Deck
k this deck
52
The following output from MINITAB presents the results of a hypothesis test. What is the P-value?
A) 1.968656
B) 0.014319
C) 46.10
D) 2.449164
What is the P-value?A) 1.968656
B) 0.014319
C) 46.10
D) 2.449164
Unlock Deck
Unlock for access to all 115 flashcards in this deck.
Unlock Deck
k this deck
53
The following output from MINITAB presents the results of a hypothesis test. What are the null and alternate hypotheses?
A)
B)
C)
D)
What are the null and alternate hypotheses? A)
B)
C)
D)
Unlock Deck
Unlock for access to all 115 flashcards in this deck.
Unlock Deck
k this deck
54
A) Yes
B) There is not enough information to draw a conclusion.
C) No
Unlock Deck
Unlock for access to all 115 flashcards in this deck.
Unlock Deck
k this deck
55
Forty-six members of a bowling league sign up for a program that claims to improve bowling scores. The participants bowl a set of five games before the program begins and a set of five games again at the end to
Measure their improvement. Compute the value of the test statistic.
A) 1.61
B) 12.36
C) 0.24
D) 0.0537
Measure their improvement.
Compute the value of the test statistic.A) 1.61
B) 12.36
C) 0.24
D) 0.0537
Unlock Deck
Unlock for access to all 115 flashcards in this deck.
Unlock Deck
k this deck
56
A sample of 43 students enroll in a program that claims to improve scores on the quantitative reasoning portion of the Graduate Record Examination (GRE). The participants take a mock GRE test before the
Program begins and again at the end to measure their improvement. Using technology, compute the P-value.
A) 0.039993052
B) 1.405165398
C) 0.019996526
D) 0.079986104
Program begins and again at the end to measure their improvement.
Using technology, compute the P-value.A) 0.039993052
B) 1.405165398
C) 0.019996526
D) 0.079986104
Unlock Deck
Unlock for access to all 115 flashcards in this deck.
Unlock Deck
k this deck
57
A sample of 46 students enroll in a program that claims to improve scores on the quantitative reasoning portion of the Graduate Record Examination (GRE). The participants take a mock GRE test before the
Program begins and again at the end to measure their improvement.
The mean number of points improved was Assume the standard deviation is and let be
The population mean number of points improved. To determine whether the program is effective, a
Test is made of the hypotheses versus Compute the value of the test statistic.
A) 0.28
B) 0.0307
C) 1.87
D) 11.80
Program begins and again at the end to measure their improvement.
The mean number of points improved was
Assume the standard deviation is and let beThe population mean number of points improved. To determine whether the program is effective, a
Test is made of the hypotheses
versus Compute the value of the test statistic.A) 0.28
B) 0.0307
C) 1.87
D) 11.80
Unlock Deck
Unlock for access to all 115 flashcards in this deck.
Unlock Deck
k this deck
58
Forty-three members of a bowling league sign up for a program that claims to improve bowling scores. The participants bowl a set of five games before the program begins and a set of five games again at the end to measure their improvement. The mean number of points improved (over the set of five games) was Assume the standard deviation is and let \mu be the population mean number of points improved for the set of five games. To determine whether the program is effective, a test is made of the hypotheses versus
i). Compute the value of the test statistic.
ii). Compute the P-value.
iii). Do you reject H0 at the=0.01 level?
Assume the standard deviation is and let \mu be the population mean number of points improved for the set of five games. To determine whether the program is effective, a test is made of the hypotheses versus i). Compute the value of the test statistic.
ii). Compute the P-value.
iii). Do you reject H0 at the
=0.01 level? Unlock Deck
Unlock for access to all 115 flashcards in this deck.
Unlock Deck
k this deck
59
A sample of 36 students enroll in a program that claims to improve scores on the quantitative reasoning portion of the Graduate Record Examination (GRE). The participants take a mock GRE test before the
Program begins and again at the end to measure their improvement.
A) No
B) There is not enough information to draw a conclusion.
C) Yes
Program begins and again at the end to measure their improvement.
A) No
B) There is not enough information to draw a conclusion.
C) Yes
Unlock Deck
Unlock for access to all 115 flashcards in this deck.
Unlock Deck
k this deck
60
According to a survey, the mean height for men is 68.9 inches. In a sample of 320 men between the ages of 60 and 69 , the mean height was inches. Public health officials want to determine whether the mean height for older men is less than the mean height of all adult men. Assuming the population standard deviation to be inches, compute the P-value.
A) 0.0287
B) -1.9030
C) 0.0574
D) 0.9713
inches. Public health officials want to determine whether the mean height for older men is less than the mean height of all adult men. Assuming the population standard deviation to be inches, compute the P-value.A) 0.0287
B) -1.9030
C) 0.0574
D) 0.9713
Unlock Deck
Unlock for access to all 115 flashcards in this deck.
Unlock Deck
k this deck
61
Find the P-value for the given test statistic t, sample size n, and alternate hypothesis H1. t=13.989, n=3,
A) 0.0025
B) 0.005
C) 0.002
D) 0.001
A) 0.0025
B) 0.005
C) 0.002
D) 0.001
Unlock Deck
Unlock for access to all 115 flashcards in this deck.
Unlock Deck
k this deck
62
A) 0.25 < P < 0.4
B) 0.05 < P < 0.1
C) 0.025 < P < 0.05
D) 0.01 < P < 0.025
Unlock Deck
Unlock for access to all 115 flashcards in this deck.
Unlock Deck
k this deck
63
A) 0.1355
B) 0.1398
C) 0.2710
D) 0.2796
Unlock Deck
Unlock for access to all 115 flashcards in this deck.
Unlock Deck
k this deck
64
A market research firm reported that the mean annual earnings of all family practitioners in the United States was $180,612. A random sample of 56 family practitioners in New York that month had mean earnings of =$190,854 with a standard deviation of $41,847. You wish to test whether family practitioners in New York make more than the national average.
State the null and alternate hypotheses.
A)
B)
C)
D)
=$190,854 with a standard deviation of $41,847. You wish to test whether family practitioners in New York make more than the national average.State the null and alternate hypotheses.
A)
B)
C)
D)
Unlock Deck
Unlock for access to all 115 flashcards in this deck.
Unlock Deck
k this deck
65
A market research firm reported that the mean annual earnings of all family practitioners in the United States was $179,574. A random sample of 38 family practitioners in New York that month
Had mean earnings of with a standard deviation of $35,113. You wish to test whether Family practitioners in New York make more than the national average. State a conclusion regarding H0. Use the level of significance.
A) Do not reject H0: there is insufficient evidence to conclude that the mean annual earnings are greater than the national average.
B) Reject H0 : the mean annual earnings appear to be greater than the national average.
C) There is not enough information to draw a conclusion.
Had mean earnings of
with a standard deviation of $35,113. You wish to test whether Family practitioners in New York make more than the national average. State a conclusion regarding H0. Use the level of significance.A) Do not reject H0: there is insufficient evidence to conclude that the mean annual earnings are greater than the national average.
B) Reject H0 : the mean annual earnings appear to be greater than the national average.
C) There is not enough information to draw a conclusion.
Unlock Deck
Unlock for access to all 115 flashcards in this deck.
Unlock Deck
k this deck
66
The following prices, in dollars, of 7.5-cubic-foot refrigerators were recorded from a random sample. A consumer organization reports that the mean price of 7.5-cubic-foot refrigerators is greater than $300. Do the data provide convincing evidence of this claim? Use the level of significance and assume the
Population is normally distributed.
A) Reject . There is sufficient evidence to conclude that the mean price is greater than $300
B) Do not reject
There is not sufficient evidence to conclude that the mean price is greater than $300
C) There is not enough information to draw a conclusion.
A consumer organization reports that the mean price of 7.5-cubic-foot refrigerators is greater than $300. Do the data provide convincing evidence of this claim? Use the level of significance and assume thePopulation is normally distributed.
A) Reject
. There is sufficient evidence to conclude that the mean price is greater than $300B) Do not reject
There is not sufficient evidence to conclude that the mean price is greater than $300
C) There is not enough information to draw a conclusion.
Unlock Deck
Unlock for access to all 115 flashcards in this deck.
Unlock Deck
k this deck
67
In a study to determine whether counseling could help people lose weight, a sample of people experienced a group-based behavioral intervention, which involved weekly meetings with a trained interventionist for a
Period of six months. The following data are numbers of pounds lost for 14 people. The following is a boxplot for these data. Is it reasonable to assume that the conditions for performing a
Hypothesis test are satisfied?
A) Yes
B) No
Period of six months. The following data are numbers of pounds lost for 14 people.
The following is a boxplot for these data. Is it reasonable to assume that the conditions for performing aHypothesis test are satisfied?
A) Yes
B) No
Unlock Deck
Unlock for access to all 115 flashcards in this deck.
Unlock Deck
k this deck
68
A psychologist is designing an experiment in which rats will navigate a maze. Ten rats run the maze, and the time it takes for each to complete the maze is recorded. The results are as follows: Following is a boxplot for the data. Is it reasonable to assume the conditions for performing a hypothesis test
Are satisfied?
A) Yes
B) No
Following is a boxplot for the data. Is it reasonable to assume the conditions for performing a hypothesis testAre satisfied?
A) Yes
B) No
Unlock Deck
Unlock for access to all 115 flashcards in this deck.
Unlock Deck
k this deck
69
A) -1.771, 1.771
B) -1.761, 1.761
C) -1.282, 1.282
D) -1.350, 1.350
Unlock Deck
Unlock for access to all 115 flashcards in this deck.
Unlock Deck
k this deck
70
The mean annual tuition and fees for a sample of 8 private colleges was $33,700 with a standard deviation of $5,800. A dotplot shows that it is reasonable to assume that the population is
Approximately normal. You wish to test whether the mean tuition and fees for private colleges is
Different from $37,400.
Compute the value of the test statistic and state the number of degrees of freedom.
A) -1.804; 7 degrees of freedom
B) -1.804; 8 degrees of freedom
C) -0.638; 8 degrees of freedom
D) -0.638; 7 degrees of freedom
Unlock Deck
Unlock for access to all 115 flashcards in this deck.
Unlock Deck
k this deck
71
A market research firm reported that the mean annual earnings of all family practitioners in the United States was $178,695. A random sample of 53 family practitioners in New York that month
Had mean earnings of with a standard deviation of $35,332. You wish to test whether
Family practitioners in New York make more than the national average.
Compute the value of the test statistic and state the number of degrees of freedom.
A) 3.785; 53 degrees of freedom
B) 0.010; 52 degrees of freedom
C) 0.010; 53 degrees of freedom
D) 3.785; 52 degrees of freedom
Had mean earnings of
with a standard deviation of $35,332. You wish to test whetherFamily practitioners in New York make more than the national average.
Compute the value of the test statistic and state the number of degrees of freedom.
A) 3.785; 53 degrees of freedom
B) 0.010; 52 degrees of freedom
C) 0.010; 53 degrees of freedom
D) 3.785; 52 degrees of freedom
Unlock Deck
Unlock for access to all 115 flashcards in this deck.
Unlock Deck
k this deck
72
A market research firm reported that the mean annual earnings of all family practitioners in the
United States was $178,011. A random sample of 38 family practitioners in New York that month
had mean earnings of with a standard deviation of $35,332. You wish to test whether
family practitioners in New York make more than the national average.
i). State the null and alternate hypotheses.
ii). Compute the value of the test statistic and state the number of degrees of freedom.
iii). State a conclusion regarding H0 . Use the=0.1 level of significance.
United States was $178,011. A random sample of 38 family practitioners in New York that month
had mean earnings of
with a standard deviation of $35,332. You wish to test whetherfamily practitioners in New York make more than the national average.
i). State the null and alternate hypotheses.
ii). Compute the value of the test statistic and state the number of degrees of freedom.
iii). State a conclusion regarding H0 . Use the
=0.1 level of significance. Unlock Deck
Unlock for access to all 115 flashcards in this deck.
Unlock Deck
k this deck
73
In an attempt to increase business on Monday nights, a restaurant offers a free dessert with every dinner order. Before the offer, the mean number of dinner customers on Monday was 150. Following are the numbers of
Diners on a random sample of Mondays while the offer was in effect. Can you conclude that the mean number of diners increased while the offer was in effect? Use the α =
Level of significance and assume the population is normally distributed.
A) Reject . There is sufficient evidence to conclude that the mean number of diners increased
While the offer was in effect.
B) Do not reject . There is insufficient evidence to conclude that the mean number of diners
Increased while the offer was in effect.
C) There is not enough information to draw a conclusion.
Diners on a random sample of Mondays while the offer was in effect.
Can you conclude that the mean number of diners increased while the offer was in effect? Use the α =Level of significance and assume the population is normally distributed.
A) Reject
. There is sufficient evidence to conclude that the mean number of diners increasedWhile the offer was in effect.
B) Do not reject
. There is insufficient evidence to conclude that the mean number of dinersIncreased while the offer was in effect.
C) There is not enough information to draw a conclusion.
Unlock Deck
Unlock for access to all 115 flashcards in this deck.
Unlock Deck
k this deck
74
The mean annual tuition and fees for a sample of 12 private colleges was $40,500 with a standard deviation of $5,000 A dotplot shows that it is reasonable to assume that the population is
Approximately normal. You wish to test whether the mean tuition and fees for private colleges is
Different from $37,400. State a conclusion regarding H0 . Use the level of significance.
A) There is not enough information to draw a conclusion.
B) Reject H0. The mean annual tuition and fees appears to be different from $37,400.
C) Do not reject H0.
Approximately normal. You wish to test whether the mean tuition and fees for private colleges is
Different from $37,400. State a conclusion regarding H0 . Use the
level of significance.A) There is not enough information to draw a conclusion.
B) Reject H0. The mean annual tuition and fees appears to be different from $37,400.
C) Do not reject H0.
Unlock Deck
Unlock for access to all 115 flashcards in this deck.
Unlock Deck
k this deck
75
A) -1.895
B) -2.447
C) -1.943
D) -1.645
Unlock Deck
Unlock for access to all 115 flashcards in this deck.
Unlock Deck
k this deck
76
A) 0.2314
B) 0.1157
C) 0.2300
D) 0.1150
Unlock Deck
Unlock for access to all 115 flashcards in this deck.
Unlock Deck
k this deck
77
A machine that fills beverage cans is supposed to put 12 ounces of beverage in each can. The amounts measured in a simple random sample of eight cans are: The following is a dotplot for these data. Is it reasonable to assume the conditions for performing a hypothesis
Test are satisfied?
A) No
B) Yes
The following is a dotplot for these data. Is it reasonable to assume the conditions for performing a hypothesisTest are satisfied?
A) No
B) Yes
Unlock Deck
Unlock for access to all 115 flashcards in this deck.
Unlock Deck
k this deck
78
Following are outstanding credit card balances for a sample of 16 college seniors at a large university. The dotplot of this data is below. Is it reasonable to assume that the conditions for performing a hypothesis test are satisfied?
A) Yes
B) No
The dotplot of this data is below. Is it reasonable to assume that the conditions for performing a hypothesis test are satisfied? A) Yes
B) No
Unlock Deck
Unlock for access to all 115 flashcards in this deck.
Unlock Deck
k this deck
79
The mean annual tuition and fees for a sample of 15 private colleges was $41,200 with a standard deviation of $5,300. A dotplot shows that it is reasonable to assume that the population is
Approximately normal. You wish to test whether the mean tuition and fees for private colleges is
Different from $38,000.
State the null and alternate hypotheses.
A)
B)
C)
D)
Approximately normal. You wish to test whether the mean tuition and fees for private colleges is
Different from $38,000.
State the null and alternate hypotheses.
A)
B)
C)
D)
Unlock Deck
Unlock for access to all 115 flashcards in this deck.
Unlock Deck
k this deck
80
The mean annual tuition and fees for a sample of 11 private colleges was $26,500 with a standard
deviation of $6,000. A dotplot shows that it is reasonable to assume that the population is
approximately normal. You wish to test whether the mean tuition and fees for private colleges is
different from $31,000.
i). State the null and alternate hypotheses.
ii). Compute the value of the test statistic and state the number of degrees of freedom.
iii). State a conclusion regarding H0. Use the=0.05 level of significance.
deviation of $6,000. A dotplot shows that it is reasonable to assume that the population is
approximately normal. You wish to test whether the mean tuition and fees for private colleges is
different from $31,000.
i). State the null and alternate hypotheses.
ii). Compute the value of the test statistic and state the number of degrees of freedom.
iii). State a conclusion regarding H0. Use the
=0.05 level of significance. Unlock Deck
Unlock for access to all 115 flashcards in this deck.
Unlock Deck
k this deck
Unlock Deck
Unlock for access to all 115 flashcards in this deck.


