Deck 3: Numerical Summaries of Data
Full screen (f)
Question
Question
Find the mode for the following data set: 
A) 27.2
B) 26
C) 26.5
D) 20
A) 27.2
B) 26
C) 26.5
D) 20
Question
Find the mode for the following data set: 
A) 17.8
B) 17
C) 13
D) 12
A) 17.8
B) 17
C) 13
D) 12
Question
Question
Question
Use the given frequency distribution to approximate the mean. 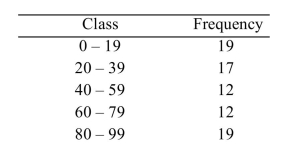
A) 48.7
B) 30.4
C) 15.8
D) 30.2
A) 48.7
B) 30.4
C) 15.8
D) 30.2
Question
Find the median for the following data set: 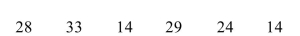
A) 26
B) 19
C) 23.7
D) 14
A) 26
B) 19
C) 23.7
D) 14
Question
Following are heights, in inches, for a sample of college basketball players. 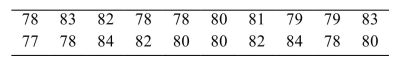 Find the mean height of the basketball players.
A) 70 inches
B) 80.5 inches
C) 4.6 inches
D) 80.3 inches
Find the mean height of the basketball players.A) 70 inches
B) 80.5 inches
C) 4.6 inches
D) 80.3 inches
Question
Find the median of the data in the following stem-and-leaf plot. The leaf represents the ones digit. 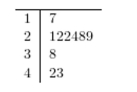
A) 26
B) 22
C) 28.6
D) 25.9
A) 26
B) 22
C) 28.6
D) 25.9
Question
Find the mean for the following data set: 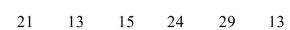
A) 19.2
B) 16
C) 18
D) 13
A) 19.2
B) 16
C) 18
D) 13
Question
Question
Question
For the data shown in the histogram, which of the following choices best describes the relationship between the median and the mean? 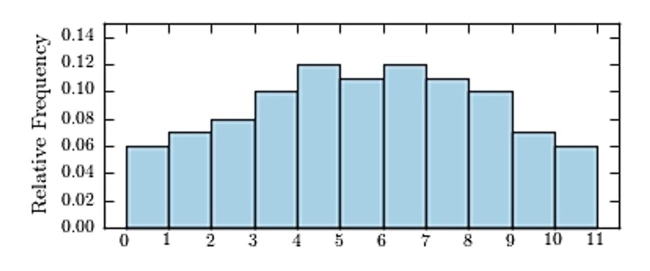
A) median > mean
B) median < mean
C) median mean
A) median > mean
B) median < mean
C) median mean
Question
A botany student measured the lengths of a sample of leaves to the nearest centimeter. The data is shown in the frequency distribution below. Use the data to approximate the mean to the nearest
Tenth of a centimeter.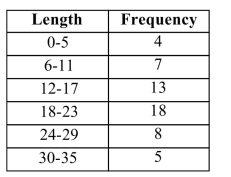
A) 18.2 cm
B) 9.2 cm
C) 18.7 cm
D) 5.8 cm
Tenth of a centimeter.
A) 18.2 cm
B) 9.2 cm
C) 18.7 cm
D) 5.8 cm
Question
Question
Find the median for the following data set: 
A) 5.4
B) 18.8
C) 20
D) 15
A) 5.4
B) 18.8
C) 20
D) 15
Question
Question
Find the mode of the data in the following stem-and-leaf plot. The leaf represents the ones digit. 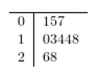
A) 11.2
B) 12.3
C) 13.3
D) 14
A) 11.2
B) 12.3
C) 13.3
D) 14
Question
Find the mean for the following data set: 
A) 26.2
B) 6.6
C) 19
D) 27
A) 26.2
B) 6.6
C) 19
D) 27
Question
Find the mean of the data in the following stem-and-leaf plot. The leaf represents the ones digit. 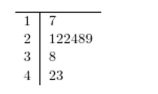
A) 26
B) 22
C) 27
D) 28.6
A) 26
B) 22
C) 27
D) 28.6
Question
Find the sample standard deviation for the following data set: 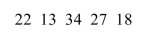
A) 7.2
B) 52.6
C) 65.7
D) 8.1
A) 7.2
B) 52.6
C) 65.7
D) 8.1
Question
The following table presents the number of monthly users for the 7 most popular mobile apps. 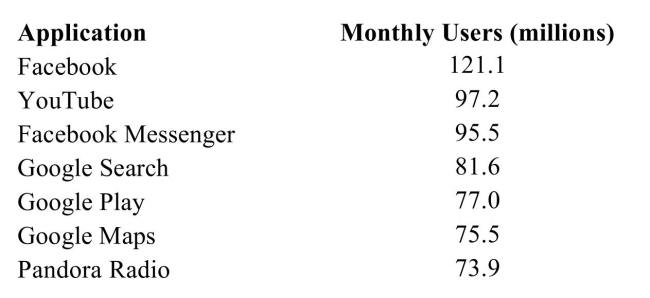 Find the mean number of monthly users.
A) 621.8
B) 88.8
C) 103.6
D) 81.6
Find the mean number of monthly users.A) 621.8
B) 88.8
C) 103.6
D) 81.6
Question
The following data represent the total price, in dollars, of 20 randomly-selected gasoline purchases at a certain convenience store. 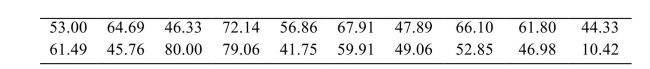 Which value in this data set is most accurately described as an extreme value?
A) $80.00
B) $10.42
C) $53.00
D) $69.58
Which value in this data set is most accurately described as an extreme value?A) $80.00
B) $10.42
C) $53.00
D) $69.58
Question
The following data represent the total price, in dollars, of 20 randomly-selected gasoline purchases at a certain convenience store. 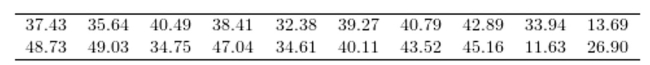 Find the median price for these purchases.
A) $95.11
B) $36.82
C) $38.84
D) $37.40
Find the median price for these purchases.A) $95.11
B) $36.82
C) $38.84
D) $37.40
Question
The following data represent the ice cream flavor choices of 20 diners at a college cafeteria. 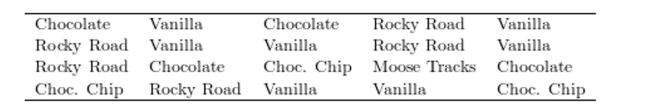 Which flavor ice cream is the mode?
A) Chocolate Chip
B) Rocky Road
C) Moose Tracks
D) Vanilla
Which flavor ice cream is the mode?A) Chocolate Chip
B) Rocky Road
C) Moose Tracks
D) Vanilla
Question
Find the sample variance for the following data set: 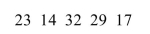
A) 7.6
B) 18
C) 58.5
D) 46.8
A) 7.6
B) 18
C) 58.5
D) 46.8
Question
Question
The following data represent the total price, in dollars, of 20 randomly-selected gasoline purchases at a certain convenience store. 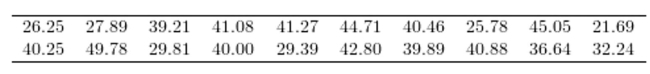 Find the mean price for these purchases.
A) $55.30
B) $36.75
C) $28.09
D) $39.95
Find the mean price for these purchases.A) $55.30
B) $36.75
C) $28.09
D) $39.95
Question
The following tables present the number of specimens that tested positive for Type A and Type B influenza in the United States during the first 15 weeks of a recent flu season.
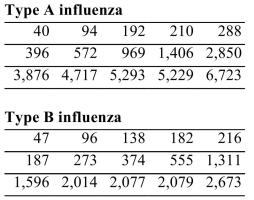
Find the mean number of type A and type B cases in the first 15 weeks of the flu season.
A) Type A: 2,190
Type B: 921
B) Type A: 1,095
Type B: 461
C) Type A: 1,556
Type B: 1,556
D) Type A: 969
Type B: 374
Find the mean number of type A and type B cases in the first 15 weeks of the flu season.
A) Type A: 2,190
Type B: 921
B) Type A: 1,095
Type B: 461
C) Type A: 1,556
Type B: 1,556
D) Type A: 969
Type B: 374
Question
The table below lists the populations, in thousands, of several rural western counties. What is the mean population? 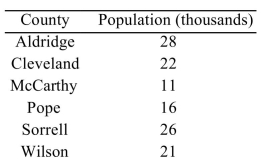
A) 17 thousand
B) 20.7 thousand
C) 21.5 thousand
D) 19.5 thousand
A) 17 thousand
B) 20.7 thousand
C) 21.5 thousand
D) 19.5 thousand
Question
The following table presents the number of monthly users for the 7 most popular mobile apps. 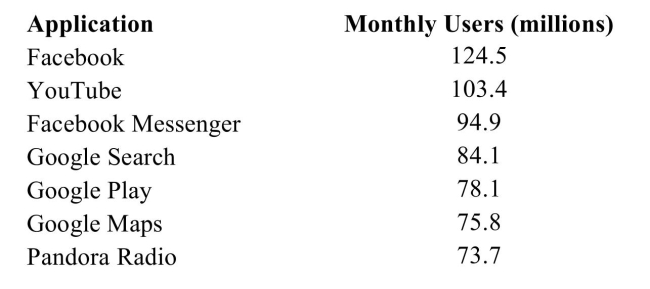 Find the median number of monthly users.
A) 84.1
B) 105.8
C) 90.6
D) 634.5
Find the median number of monthly users.A) 84.1
B) 105.8
C) 90.6
D) 634.5
Question
Question
Question
Find the population standard deviation for the following data set: 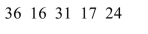
A) 7.8
B) 75.7
C) 60.6
D) 8.7
A) 7.8
B) 75.7
C) 60.6
D) 8.7
Question
Question
The table below lists the populations, in thousands, of several rural western counties. What is the median population? 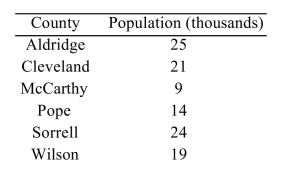
A) 18.7 thousand
B) 20 thousand
C) 17 thousand
D) 16 thousand
A) 18.7 thousand
B) 20 thousand
C) 17 thousand
D) 16 thousand
Question
Question
Question
Find the population variance for the following data set: 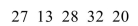
A) 19
B) 7.5
C) 56.5
D) 45.2
A) 19
B) 7.5
C) 56.5
D) 45.2
Question
The following tables present the number of specimens that tested positive for Type A and Type B influenza in the United States during the first 15 weeks of a recent flu season.
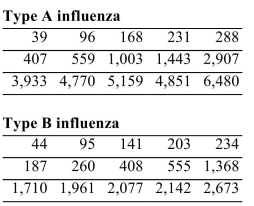
Find the median number of type A and type B cases in the first 15 weeks of the flu season.
A) Type A: 1,078
Type B: 469
B) Type A: 1,003
Type B: 408
C) Type A: 1,546
Type B: 1,546
D) Type A: 2,156
Type B: 937
Find the median number of type A and type B cases in the first 15 weeks of the flu season.
A) Type A: 1,078
Type B: 469
B) Type A: 1,003
Type B: 408
C) Type A: 1,546
Type B: 1,546
D) Type A: 2,156
Type B: 937
Question
A population has a mean μ = 46 and standard deviation  Find the z-score for a population value of 13.
A) -33
B) -2.2
C) -0.5
D) 0.9
Find the z-score for a population value of 13.A) -33
B) -2.2
C) -0.5
D) 0.9
Question
Approximate the sample variance given the following frequency distribution. 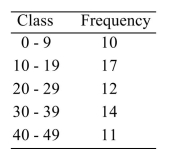
A) 179.7
B) 13.5
C) 182.5
D) 13.4
A) 179.7
B) 13.5
C) 182.5
D) 13.4
Question
For the data set below, find the IQR. 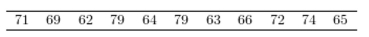
A) 10
B) 17
C) 64
D) 74
A) 10
B) 17
C) 64
D) 74
Question
Question
Approximate the population standard deviation given the following frequency distribution. 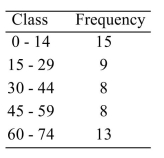
A) 23.6
B) 556.1
C) 545.6
D) 23.4
A) 23.6
B) 556.1
C) 545.6
D) 23.4
Question
A population has a mean  and standard deviation
  What number has a z-score of -0.1?
A) 15.6
B) -1.2
C) -18.4
D) -1.4
and standard deviation What number has a z-score of -0.1?A) 15.6
B) -1.2
C) -18.4
D) -1.4
Question
For the data set below, find the third quartile. 
A) 66
B) 52.5
C) 60
D) 75
A) 66
B) 52.5
C) 60
D) 75
Question
Approximate the sample standard deviation given the following frequency distribution. 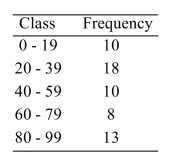
A) 798.2
B) 28.3
C) 28.5
D) 811.9
A) 798.2
B) 28.3
C) 28.5
D) 811.9
Question
Question
The following population parameters were obtained from a graphing calculator. 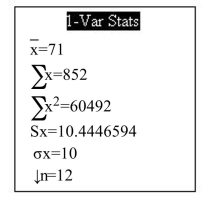 Assuming the population is bell-shaped, approximately what percentage of the population values are between 51 and 91?
A) 95%
B) almost all (greater than 95%)
C) 5%
D) 68%
Assuming the population is bell-shaped, approximately what percentage of the population values are between 51 and 91?A) 95%
B) almost all (greater than 95%)
C) 5%
D) 68%
Question
Question
Question
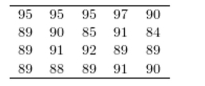
Following are the closing prices (in dollars) of a certain stock for the past 20 trading days. 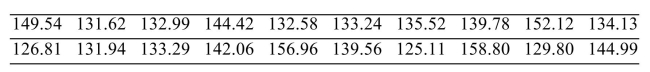 Find the population standard deviation for the closing prices.
A) $9.44
B) $138.76
C) $9.68
D) $33.69
Find the population standard deviation for the closing prices.A) $9.44
B) $138.76
C) $9.68
D) $33.69
Question
The following table presents the heights (in inches) of a sample of college basketball players. 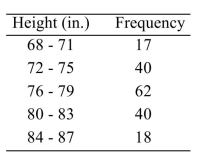 Considering the data to be a population, approximate the standard deviation of the heights.
A) 78
B) 4
C) 19.9
D) 4.5
Considering the data to be a population, approximate the standard deviation of the heights.A) 78
B) 4
C) 19.9
D) 4.5
Question
Approximate the population variance given the following frequency distribution. 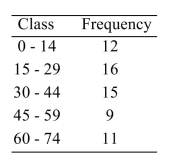
A) 20.3
B) 413.3
C) 419.9
D) 20.5
A) 20.3
B) 413.3
C) 419.9
D) 20.5
Question
The following population parameters were obtained from a graphing calculator. 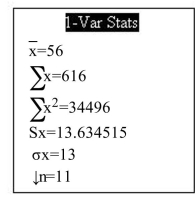 Assuming the population is bell-shaped, between what two values will approximately 95% of the population be?
A) 43 to 69
B) 56 to 95
C) 30 to 82
D) 17 to 95
Assuming the population is bell-shaped, between what two values will approximately 95% of the population be?A) 43 to 69
B) 56 to 95
C) 30 to 82
D) 17 to 95
Question
The following table presents the heights (in inches) of a sample of college basketball players. 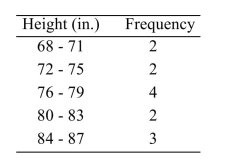 Considering the data to be a population, approximate the variance of the heights.
A) 5.4
B) 5.6
C) 29.2
D) 31.6
Considering the data to be a population, approximate the variance of the heights.A) 5.4
B) 5.6
C) 29.2
D) 31.6
Question
Following are heights, in inches, for a sample of college basketball players. 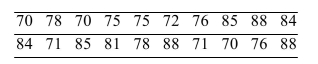 Find the sample standard deviation for the heights of the basketball players.
A) 6.6
B) 78.3
C) 6.4
D) 18
Find the sample standard deviation for the heights of the basketball players.A) 6.6
B) 78.3
C) 6.4
D) 18
Question
Question
For the data set below, find the first quartile. 
A) 60
B) 76
C) 48.5
D) 65
A) 60
B) 76
C) 48.5
D) 65
Question
For the data set below, find the upper outlier boundary. 
A) 232.5
B) 247.5
C) 131.5
D) 253
A) 232.5
B) 247.5
C) 131.5
D) 253
Question
A soft-drink bottling company fills and ships soda in plastic bottles with a target volume of 354 milliliters. The filling machinery does not deliver a perfectly consistent volume of liquid to each
Bottle, and the three quartiles for the fill volume are A fill volume of 345 mL is considered low. Would a fill volume of 345 mL be considered an outlier?
A) No
B) Yes
Bottle, and the three quartiles for the fill volume are
A fill volume of 345 mL is considered low. Would a fill volume of 345 mL be considered an outlier?A) No
B) Yes
Question
Question
Question
Construct a boxplot for the data set below.
A)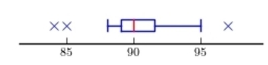
B)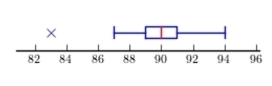
C)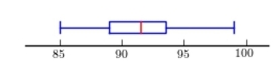
D)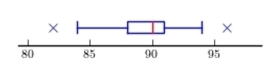
A)
B)
C)
D)
Question
For the data set below, find the IQR. 
A) 18
B) 83
C) 21
D) 25
A) 18
B) 83
C) 21
D) 25
Question
For the data set below, find the outlier(s). 
A) 202
B) 252
C) 202 and 210
D) None are outliers.
A) 202
B) 252
C) 202 and 210
D) None are outliers.
Question
For the data set below, find the upper outlier boundary. 
A) 45
B) 176
C) 195
D) 243.5
A) 45
B) 176
C) 195
D) 243.5
Question
For the data set below, list the outliers, if any. 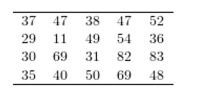
A) 83
B) 82 and 83
C) 11, 82, and 83
D) There are no outliers.
A) 83
B) 82 and 83
C) 11, 82, and 83
D) There are no outliers.
Question
Question
For the data set below, find the third quartile. 
A) 183.5
B) 201
C) 194
D) 177
A) 183.5
B) 201
C) 194
D) 177
Question
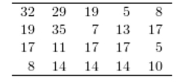
For the data set below, find the 37th percentile. 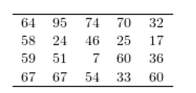
A) 36
B) 46
C) 48.5
D) 37
A) 36
B) 46
C) 48.5
D) 37
Question
For the data set below, find the first quartile. 
A) 186.5
B) 204
C) 179
D) 195
A) 186.5
B) 204
C) 179
D) 195
Question
For the data set below, find the outlier(s). 
A) 189
B) 141 and 150
C) 141 and 189
D) None are outliers.
A) 189
B) 141 and 150
C) 141 and 189
D) None are outliers.
Question
A soft-drink bottling company fills and ships soda in plastic bottles with a target volume of 354 milliliters. The filling machinery does not deliver a perfectly consistent volume of liquid to each
Bottle, and the three quartiles for the fill volume are Find the IQR.
A) 13.5
B) 10.8
C) 3
D) 9
Bottle, and the three quartiles for the fill volume are
Find the IQR.A) 13.5
B) 10.8
C) 3
D) 9
Question
Construct a boxplot for the data set below.
A)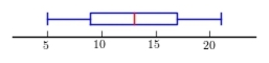
B)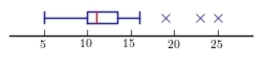
C)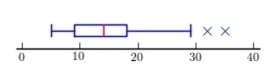
D)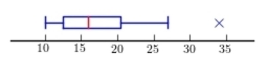
A)
B)
C)
D)

Unlock Deck
Sign up to unlock the cards in this deck!
Unlock Deck
Unlock Deck
1/76
Play
Full screen (f)
Deck 3: Numerical Summaries of Data
1
Find the mean for the following data set:
15 31 34 20 26
A)7.0
B) 25.2
C)19
D)26
15 31 34 20 26
A)7.0
B) 25.2
C)19
D)26
25.2
2
Find the mode for the following data set:
A) 27.2
B) 26
C) 26.5
D) 20
A) 27.2
B) 26
C) 26.5
D) 20
26
3
Find the mode for the following data set:
A) 17.8
B) 17
C) 13
D) 12
A) 17.8
B) 17
C) 13
D) 12
13
4
Find the median for the following data set:
12 13 20 15 23
A)15
B)11
C)4.2
D) 16.6
12 13 20 15 23
A)15
B)11
C)4.2
D) 16.6
Unlock Deck
Unlock for access to all 76 flashcards in this deck.
Unlock Deck
k this deck
5
Find the median for the following data set:
22 13 20 13 19
A)13
B)19
C)17.4
D)9
22 13 20 13 19
A)13
B)19
C)17.4
D)9
Unlock Deck
Unlock for access to all 76 flashcards in this deck.
Unlock Deck
k this deck
6
Use the given frequency distribution to approximate the mean.
A) 48.7
B) 30.4
C) 15.8
D) 30.2
A) 48.7
B) 30.4
C) 15.8
D) 30.2
Unlock Deck
Unlock for access to all 76 flashcards in this deck.
Unlock Deck
k this deck
7
Find the median for the following data set:
A) 26
B) 19
C) 23.7
D) 14
A) 26
B) 19
C) 23.7
D) 14
Unlock Deck
Unlock for access to all 76 flashcards in this deck.
Unlock Deck
k this deck
8
Following are heights, in inches, for a sample of college basketball players. Find the mean height of the basketball players.
A) 70 inches
B) 80.5 inches
C) 4.6 inches
D) 80.3 inches
Find the mean height of the basketball players.A) 70 inches
B) 80.5 inches
C) 4.6 inches
D) 80.3 inches
Unlock Deck
Unlock for access to all 76 flashcards in this deck.
Unlock Deck
k this deck
9
Find the median of the data in the following stem-and-leaf plot. The leaf represents the ones digit.
A) 26
B) 22
C) 28.6
D) 25.9
A) 26
B) 22
C) 28.6
D) 25.9
Unlock Deck
Unlock for access to all 76 flashcards in this deck.
Unlock Deck
k this deck
10
Find the mean for the following data set:
A) 19.2
B) 16
C) 18
D) 13
A) 19.2
B) 16
C) 18
D) 13
Unlock Deck
Unlock for access to all 76 flashcards in this deck.
Unlock Deck
k this deck
11
A study found that the mean amount of time that people in the United States spent watching TV was 108.1 hours per year. The same study found that the median was 109.2 hours per year. If a histogram
Were constructed for the data, would you expect it to be skewed to the right, to the left, or
Approximately symmetric?
A) skewed to the left
B) skewed to the right
C) approximately symmetric
Were constructed for the data, would you expect it to be skewed to the right, to the left, or
Approximately symmetric?
A) skewed to the left
B) skewed to the right
C) approximately symmetric
Unlock Deck
Unlock for access to all 76 flashcards in this deck.
Unlock Deck
k this deck
12
A survey found that the median number of calories consumed per day in a certain country was 3,304 and the mean was 3,204.9 calories. If a histogram were constructed for the data, would you expect it
To be skewed to the right, to the left, or approximately symmetric?
A) skewed to the right
B) skewed to the left
C) approximately symmetric
To be skewed to the right, to the left, or approximately symmetric?
A) skewed to the right
B) skewed to the left
C) approximately symmetric
Unlock Deck
Unlock for access to all 76 flashcards in this deck.
Unlock Deck
k this deck
13
For the data shown in the histogram, which of the following choices best describes the relationship between the median and the mean?
A) median > mean
B) median < mean
C) median mean
A) median > mean
B) median < mean
C) median mean
Unlock Deck
Unlock for access to all 76 flashcards in this deck.
Unlock Deck
k this deck
14
A botany student measured the lengths of a sample of leaves to the nearest centimeter. The data is shown in the frequency distribution below. Use the data to approximate the mean to the nearest
Tenth of a centimeter.
A) 18.2 cm
B) 9.2 cm
C) 18.7 cm
D) 5.8 cm
Tenth of a centimeter.
A) 18.2 cm
B) 9.2 cm
C) 18.7 cm
D) 5.8 cm
Unlock Deck
Unlock for access to all 76 flashcards in this deck.
Unlock Deck
k this deck
15
Find the mean for the following data set:
16 10 22 23 10
A)10
B)16
C)13
D)16.2
16 10 22 23 10
A)10
B)16
C)13
D)16.2
Unlock Deck
Unlock for access to all 76 flashcards in this deck.
Unlock Deck
k this deck
16
Find the median for the following data set:
A) 5.4
B) 18.8
C) 20
D) 15
A) 5.4
B) 18.8
C) 20
D) 15
Unlock Deck
Unlock for access to all 76 flashcards in this deck.
Unlock Deck
k this deck
17
A report states that the mean household income last year for a certain rural county was $46,200 and the median was $37,800. If a histogram were constructed for the incomes of all households in the
County, would you expect it to be skewed to the right, to the left, or approximately symmetric?
A) approximately symmetric
B) skewed to the right
C) skewed to the left
County, would you expect it to be skewed to the right, to the left, or approximately symmetric?
A) approximately symmetric
B) skewed to the right
C) skewed to the left
Unlock Deck
Unlock for access to all 76 flashcards in this deck.
Unlock Deck
k this deck
18
Find the mode of the data in the following stem-and-leaf plot. The leaf represents the ones digit.
A) 11.2
B) 12.3
C) 13.3
D) 14
A) 11.2
B) 12.3
C) 13.3
D) 14
Unlock Deck
Unlock for access to all 76 flashcards in this deck.
Unlock Deck
k this deck
19
Find the mean for the following data set:
A) 26.2
B) 6.6
C) 19
D) 27
A) 26.2
B) 6.6
C) 19
D) 27
Unlock Deck
Unlock for access to all 76 flashcards in this deck.
Unlock Deck
k this deck
20
Find the mean of the data in the following stem-and-leaf plot. The leaf represents the ones digit.
A) 26
B) 22
C) 27
D) 28.6
A) 26
B) 22
C) 27
D) 28.6
Unlock Deck
Unlock for access to all 76 flashcards in this deck.
Unlock Deck
k this deck
21
Find the sample standard deviation for the following data set:
A) 7.2
B) 52.6
C) 65.7
D) 8.1
A) 7.2
B) 52.6
C) 65.7
D) 8.1
Unlock Deck
Unlock for access to all 76 flashcards in this deck.
Unlock Deck
k this deck
22
The following table presents the number of monthly users for the 7 most popular mobile apps. Find the mean number of monthly users.
A) 621.8
B) 88.8
C) 103.6
D) 81.6
Find the mean number of monthly users.A) 621.8
B) 88.8
C) 103.6
D) 81.6
Unlock Deck
Unlock for access to all 76 flashcards in this deck.
Unlock Deck
k this deck
23
The following data represent the total price, in dollars, of 20 randomly-selected gasoline purchases at a certain convenience store. Which value in this data set is most accurately described as an extreme value?
A) $80.00
B) $10.42
C) $53.00
D) $69.58
Which value in this data set is most accurately described as an extreme value?A) $80.00
B) $10.42
C) $53.00
D) $69.58
Unlock Deck
Unlock for access to all 76 flashcards in this deck.
Unlock Deck
k this deck
24
The following data represent the total price, in dollars, of 20 randomly-selected gasoline purchases at a certain convenience store. Find the median price for these purchases.
A) $95.11
B) $36.82
C) $38.84
D) $37.40
Find the median price for these purchases.A) $95.11
B) $36.82
C) $38.84
D) $37.40
Unlock Deck
Unlock for access to all 76 flashcards in this deck.
Unlock Deck
k this deck
25
The following data represent the ice cream flavor choices of 20 diners at a college cafeteria. Which flavor ice cream is the mode?
A) Chocolate Chip
B) Rocky Road
C) Moose Tracks
D) Vanilla
Which flavor ice cream is the mode?A) Chocolate Chip
B) Rocky Road
C) Moose Tracks
D) Vanilla
Unlock Deck
Unlock for access to all 76 flashcards in this deck.
Unlock Deck
k this deck
26
Find the sample variance for the following data set:
A) 7.6
B) 18
C) 58.5
D) 46.8
A) 7.6
B) 18
C) 58.5
D) 46.8
Unlock Deck
Unlock for access to all 76 flashcards in this deck.
Unlock Deck
k this deck
27
Elizabeth worked at three part-time jobs last week. At one job, she worked 5 hours at a salary of $12 per hour, at the second she worked 15 hours at $10 per hour, and at the third she worked 20
Hours at $15 per hour. What was her mean hourly wage?
A) $12.75
B) $13.78
C) $40.00
D) $12.33
Hours at $15 per hour. What was her mean hourly wage?
A) $12.75
B) $13.78
C) $40.00
D) $12.33
Unlock Deck
Unlock for access to all 76 flashcards in this deck.
Unlock Deck
k this deck
28
The following data represent the total price, in dollars, of 20 randomly-selected gasoline purchases at a certain convenience store. Find the mean price for these purchases.
A) $55.30
B) $36.75
C) $28.09
D) $39.95
Find the mean price for these purchases.A) $55.30
B) $36.75
C) $28.09
D) $39.95
Unlock Deck
Unlock for access to all 76 flashcards in this deck.
Unlock Deck
k this deck
29
The following tables present the number of specimens that tested positive for Type A and Type B influenza in the United States during the first 15 weeks of a recent flu season.
Find the mean number of type A and type B cases in the first 15 weeks of the flu season.
A) Type A: 2,190
Type B: 921
B) Type A: 1,095
Type B: 461
C) Type A: 1,556
Type B: 1,556
D) Type A: 969
Type B: 374
Find the mean number of type A and type B cases in the first 15 weeks of the flu season.
A) Type A: 2,190
Type B: 921
B) Type A: 1,095
Type B: 461
C) Type A: 1,556
Type B: 1,556
D) Type A: 969
Type B: 374
Unlock Deck
Unlock for access to all 76 flashcards in this deck.
Unlock Deck
k this deck
30
The table below lists the populations, in thousands, of several rural western counties. What is the mean population?
A) 17 thousand
B) 20.7 thousand
C) 21.5 thousand
D) 19.5 thousand
A) 17 thousand
B) 20.7 thousand
C) 21.5 thousand
D) 19.5 thousand
Unlock Deck
Unlock for access to all 76 flashcards in this deck.
Unlock Deck
k this deck
31
The following table presents the number of monthly users for the 7 most popular mobile apps. Find the median number of monthly users.
A) 84.1
B) 105.8
C) 90.6
D) 634.5
Find the median number of monthly users.A) 84.1
B) 105.8
C) 90.6
D) 634.5
Unlock Deck
Unlock for access to all 76 flashcards in this deck.
Unlock Deck
k this deck
32
A data set has a median of 64, and six of the numbers in the data set are less than median. The data set contains a total of n numbers.
If n is odd, and exactly one number in the data set is equal to 64, what is the value of n?
A) 17
B) 16
C) 15
D) 13
If n is odd, and exactly one number in the data set is equal to 64, what is the value of n?
A) 17
B) 16
C) 15
D) 13
Unlock Deck
Unlock for access to all 76 flashcards in this deck.
Unlock Deck
k this deck
33
In Steve's statistics class, the final grade is a weighted mean of a homework grade, three midterm grades, and a final exam grade. The homework counts for 15% of the grade, each midterm counts
For 15%, and the final exam counts for 40%. Steve got an average score of 60 on the homework, 80,
70, and 75 on the midterms, and 75 on the final. What is Steve's final grade?
A) 72
B) 41
C) 69
D) 73
For 15%, and the final exam counts for 40%. Steve got an average score of 60 on the homework, 80,
70, and 75 on the midterms, and 75 on the final. What is Steve's final grade?
A) 72
B) 41
C) 69
D) 73
Unlock Deck
Unlock for access to all 76 flashcards in this deck.
Unlock Deck
k this deck
34
Find the population standard deviation for the following data set:
A) 7.8
B) 75.7
C) 60.6
D) 8.7
A) 7.8
B) 75.7
C) 60.6
D) 8.7
Unlock Deck
Unlock for access to all 76 flashcards in this deck.
Unlock Deck
k this deck
35
A student has an average of 79 on seven chapter tests. If the student's scores on six of the tests are 77, 73, 87, 67, 80, and 71, what was the score on the remaining test?
A) 90
B) 76
C) 98
D) 79
A) 90
B) 76
C) 98
D) 79
Unlock Deck
Unlock for access to all 76 flashcards in this deck.
Unlock Deck
k this deck
36
The table below lists the populations, in thousands, of several rural western counties. What is the median population?
A) 18.7 thousand
B) 20 thousand
C) 17 thousand
D) 16 thousand
A) 18.7 thousand
B) 20 thousand
C) 17 thousand
D) 16 thousand
Unlock Deck
Unlock for access to all 76 flashcards in this deck.
Unlock Deck
k this deck
37
A data set has a median of 63, and six of the numbers in the data set are less than median. The data set contains a total of n numbers.
If n is even, and none of the numbers in the data set are equal to 63, what is the value of n?
A) 13
B) 10
C) 12
D) 16
If n is even, and none of the numbers in the data set are equal to 63, what is the value of n?
A) 13
B) 10
C) 12
D) 16
Unlock Deck
Unlock for access to all 76 flashcards in this deck.
Unlock Deck
k this deck
38
A data set contains three unique values. Which of the following must be true?
A) median = midrange
B) none of these
C) mean = median
D) mean = median = midrange
A) median = midrange
B) none of these
C) mean = median
D) mean = median = midrange
Unlock Deck
Unlock for access to all 76 flashcards in this deck.
Unlock Deck
k this deck
39
Find the population variance for the following data set:
A) 19
B) 7.5
C) 56.5
D) 45.2
A) 19
B) 7.5
C) 56.5
D) 45.2
Unlock Deck
Unlock for access to all 76 flashcards in this deck.
Unlock Deck
k this deck
40
The following tables present the number of specimens that tested positive for Type A and Type B influenza in the United States during the first 15 weeks of a recent flu season.
Find the median number of type A and type B cases in the first 15 weeks of the flu season.
A) Type A: 1,078
Type B: 469
B) Type A: 1,003
Type B: 408
C) Type A: 1,546
Type B: 1,546
D) Type A: 2,156
Type B: 937
Find the median number of type A and type B cases in the first 15 weeks of the flu season.
A) Type A: 1,078
Type B: 469
B) Type A: 1,003
Type B: 408
C) Type A: 1,546
Type B: 1,546
D) Type A: 2,156
Type B: 937
Unlock Deck
Unlock for access to all 76 flashcards in this deck.
Unlock Deck
k this deck
41
A population has a mean μ = 46 and standard deviation Find the z-score for a population value of 13.
A) -33
B) -2.2
C) -0.5
D) 0.9
Find the z-score for a population value of 13.A) -33
B) -2.2
C) -0.5
D) 0.9
Unlock Deck
Unlock for access to all 76 flashcards in this deck.
Unlock Deck
k this deck
42
Approximate the sample variance given the following frequency distribution.
A) 179.7
B) 13.5
C) 182.5
D) 13.4
A) 179.7
B) 13.5
C) 182.5
D) 13.4
Unlock Deck
Unlock for access to all 76 flashcards in this deck.
Unlock Deck
k this deck
43
For the data set below, find the IQR.
A) 10
B) 17
C) 64
D) 74
A) 10
B) 17
C) 64
D) 74
Unlock Deck
Unlock for access to all 76 flashcards in this deck.
Unlock Deck
k this deck
44
A paint manufacturer discovers that the mean volume of paint in a gallon-sized pail is 1.1 gallons with a standard deviation of 0.1 gallons. The paint volumes are approximately bell-shaped. Estimate
The percent of pails with volumes between 1.00 gallon and 1.20 gallons.
A) almost all (greater than 95%)
B) 68%
C) 32%
D) 95%
The percent of pails with volumes between 1.00 gallon and 1.20 gallons.
A) almost all (greater than 95%)
B) 68%
C) 32%
D) 95%
Unlock Deck
Unlock for access to all 76 flashcards in this deck.
Unlock Deck
k this deck
45
Approximate the population standard deviation given the following frequency distribution.
A) 23.6
B) 556.1
C) 545.6
D) 23.4
A) 23.6
B) 556.1
C) 545.6
D) 23.4
Unlock Deck
Unlock for access to all 76 flashcards in this deck.
Unlock Deck
k this deck
46
A population has a mean and standard deviation What number has a z-score of -0.1?
A) 15.6
B) -1.2
C) -18.4
D) -1.4
and standard deviation What number has a z-score of -0.1?A) 15.6
B) -1.2
C) -18.4
D) -1.4
Unlock Deck
Unlock for access to all 76 flashcards in this deck.
Unlock Deck
k this deck
47
For the data set below, find the third quartile.
A) 66
B) 52.5
C) 60
D) 75
A) 66
B) 52.5
C) 60
D) 75
Unlock Deck
Unlock for access to all 76 flashcards in this deck.
Unlock Deck
k this deck
48
Approximate the sample standard deviation given the following frequency distribution.
A) 798.2
B) 28.3
C) 28.5
D) 811.9
A) 798.2
B) 28.3
C) 28.5
D) 811.9
Unlock Deck
Unlock for access to all 76 flashcards in this deck.
Unlock Deck
k this deck
49
A consumer advocacy group tested the "on-air" lifetimes of a random sample of 152 cell phone batteries. The mean lifetime was 2.9 hours with a standard deviation of 0.4 hours. The lifetimes are
Approximately bell-shaped. Estimate the number of batteries with lifetimes between 2.5 hours and
3)3 hours.
A) 103
B) 144
C) almost all (greater than 144)
D) 49
Approximately bell-shaped. Estimate the number of batteries with lifetimes between 2.5 hours and
3)3 hours.
A) 103
B) 144
C) almost all (greater than 144)
D) 49
Unlock Deck
Unlock for access to all 76 flashcards in this deck.
Unlock Deck
k this deck
50
The following population parameters were obtained from a graphing calculator. Assuming the population is bell-shaped, approximately what percentage of the population values are between 51 and 91?
A) 95%
B) almost all (greater than 95%)
C) 5%
D) 68%
Assuming the population is bell-shaped, approximately what percentage of the population values are between 51 and 91?A) 95%
B) almost all (greater than 95%)
C) 5%
D) 68%
Unlock Deck
Unlock for access to all 76 flashcards in this deck.
Unlock Deck
k this deck
51
The completion times for a certain marathon race was 2.4 hours with a standard deviation of 0.5 hours. What can you determine about these data by using Chebyshev's Inequality with K = 2?
A) At least 75% of the completion times are between 1.4 hours and 3.4 hours.
B) No more than 75% of the completion times are between 1.4 hours and 3.4 hours.
C) At most 88.9% of the completion times are between 1.4 hours and 3.4 hours.
D) At least 88.9% of the completion times are between 1.4 hours and 3.4 hours.
Unlock Deck
Unlock for access to all 76 flashcards in this deck.
Unlock Deck
k this deck
52
A data set has a mean of 50 and a standard deviation of 10. Which of the following might possibly be true?
A) More than 90% of the data values are between 20 and 80.
B) No more than 50% of the data values are between 30 and 70.
C) No less than 30% of the data values are less than 30 or greater than 70.
D) At least 15% of the data values are less than 20 or greater than 80.
A) More than 90% of the data values are between 20 and 80.
B) No more than 50% of the data values are between 30 and 70.
C) No less than 30% of the data values are less than 30 or greater than 70.
D) At least 15% of the data values are less than 20 or greater than 80.
Unlock Deck
Unlock for access to all 76 flashcards in this deck.
Unlock Deck
k this deck
53
Following are the closing prices (in dollars) of a certain stock for the past 20 trading days. Find the population standard deviation for the closing prices.
A) $9.44
B) $138.76
C) $9.68
D) $33.69
Find the population standard deviation for the closing prices.A) $9.44
B) $138.76
C) $9.68
D) $33.69
Unlock Deck
Unlock for access to all 76 flashcards in this deck.
Unlock Deck
k this deck
54
The following table presents the heights (in inches) of a sample of college basketball players. Considering the data to be a population, approximate the standard deviation of the heights.
A) 78
B) 4
C) 19.9
D) 4.5
Considering the data to be a population, approximate the standard deviation of the heights.A) 78
B) 4
C) 19.9
D) 4.5
Unlock Deck
Unlock for access to all 76 flashcards in this deck.
Unlock Deck
k this deck
55
Approximate the population variance given the following frequency distribution.
A) 20.3
B) 413.3
C) 419.9
D) 20.5
A) 20.3
B) 413.3
C) 419.9
D) 20.5
Unlock Deck
Unlock for access to all 76 flashcards in this deck.
Unlock Deck
k this deck
56
The following population parameters were obtained from a graphing calculator. Assuming the population is bell-shaped, between what two values will approximately 95% of the population be?
A) 43 to 69
B) 56 to 95
C) 30 to 82
D) 17 to 95
Assuming the population is bell-shaped, between what two values will approximately 95% of the population be?A) 43 to 69
B) 56 to 95
C) 30 to 82
D) 17 to 95
Unlock Deck
Unlock for access to all 76 flashcards in this deck.
Unlock Deck
k this deck
57
The following table presents the heights (in inches) of a sample of college basketball players. Considering the data to be a population, approximate the variance of the heights.
A) 5.4
B) 5.6
C) 29.2
D) 31.6
Considering the data to be a population, approximate the variance of the heights.A) 5.4
B) 5.6
C) 29.2
D) 31.6
Unlock Deck
Unlock for access to all 76 flashcards in this deck.
Unlock Deck
k this deck
58
Following are heights, in inches, for a sample of college basketball players. Find the sample standard deviation for the heights of the basketball players.
A) 6.6
B) 78.3
C) 6.4
D) 18
Find the sample standard deviation for the heights of the basketball players.A) 6.6
B) 78.3
C) 6.4
D) 18
Unlock Deck
Unlock for access to all 76 flashcards in this deck.
Unlock Deck
k this deck
59
A data set has a mean of 157 and a standard deviation of 20. Compute the coefficient of variation.
A) 7.69
B) 0.13
C) 2.55
D) 20.00
A) 7.69
B) 0.13
C) 2.55
D) 20.00
Unlock Deck
Unlock for access to all 76 flashcards in this deck.
Unlock Deck
k this deck
60
For the data set below, find the first quartile.
A) 60
B) 76
C) 48.5
D) 65
A) 60
B) 76
C) 48.5
D) 65
Unlock Deck
Unlock for access to all 76 flashcards in this deck.
Unlock Deck
k this deck
61
For the data set below, find the upper outlier boundary.
A) 232.5
B) 247.5
C) 131.5
D) 253
A) 232.5
B) 247.5
C) 131.5
D) 253
Unlock Deck
Unlock for access to all 76 flashcards in this deck.
Unlock Deck
k this deck
62
A soft-drink bottling company fills and ships soda in plastic bottles with a target volume of 354 milliliters. The filling machinery does not deliver a perfectly consistent volume of liquid to each
Bottle, and the three quartiles for the fill volume are A fill volume of 345 mL is considered low. Would a fill volume of 345 mL be considered an outlier?
A) No
B) Yes
Bottle, and the three quartiles for the fill volume are
A fill volume of 345 mL is considered low. Would a fill volume of 345 mL be considered an outlier?A) No
B) Yes
Unlock Deck
Unlock for access to all 76 flashcards in this deck.
Unlock Deck
k this deck
63
The mean systolic blood pressure for a sample of 500 individuals is 110 with a standard deviation of 16. A patient's systolic blood pressure is measured at 84. What is the z-score for this measurement?
A) -26
B) 1.62
C) 26.00
D) -1.62
A) -26
B) 1.62
C) 26.00
D) -1.62
Unlock Deck
Unlock for access to all 76 flashcards in this deck.
Unlock Deck
k this deck
64
Gina and Stewart are surf-fishing on the Atlantic coast, where both bluefish and pompano are common catches. The mean length of a bluefish is 285 millimeters with a standard deviation of
54 mm. For pompano, the mean is 128 mm with a standard deviation of 24 mm.
Stewart caught a bluefish that was 313 mm long. What was the z-score for this length?
A) 313
B) 0.52
C) 7.71
D) 5.8
54 mm. For pompano, the mean is 128 mm with a standard deviation of 24 mm.
Stewart caught a bluefish that was 313 mm long. What was the z-score for this length?
A) 313
B) 0.52
C) 7.71
D) 5.8
Unlock Deck
Unlock for access to all 76 flashcards in this deck.
Unlock Deck
k this deck
65
Construct a boxplot for the data set below.
A)
B)
C)
D)
A)
B)
C)
D)
Unlock Deck
Unlock for access to all 76 flashcards in this deck.
Unlock Deck
k this deck
66
For the data set below, find the IQR.
A) 18
B) 83
C) 21
D) 25
A) 18
B) 83
C) 21
D) 25
Unlock Deck
Unlock for access to all 76 flashcards in this deck.
Unlock Deck
k this deck
67
For the data set below, find the outlier(s).
A) 202
B) 252
C) 202 and 210
D) None are outliers.
A) 202
B) 252
C) 202 and 210
D) None are outliers.
Unlock Deck
Unlock for access to all 76 flashcards in this deck.
Unlock Deck
k this deck
68
For the data set below, find the upper outlier boundary.
A) 45
B) 176
C) 195
D) 243.5
A) 45
B) 176
C) 195
D) 243.5
Unlock Deck
Unlock for access to all 76 flashcards in this deck.
Unlock Deck
k this deck
69
For the data set below, list the outliers, if any.
A) 83
B) 82 and 83
C) 11, 82, and 83
D) There are no outliers.
A) 83
B) 82 and 83
C) 11, 82, and 83
D) There are no outliers.
Unlock Deck
Unlock for access to all 76 flashcards in this deck.
Unlock Deck
k this deck
70
The mean salary of professional baseball players is $2.58 million with a standard deviation of 0.33. A new player is hired with a salary of $2.76 million. What is the z-score of this salary?
A) 8.36
B) 16.18
C) -16.18
D) 0.55
A) 8.36
B) 16.18
C) -16.18
D) 0.55
Unlock Deck
Unlock for access to all 76 flashcards in this deck.
Unlock Deck
k this deck
71
For the data set below, find the third quartile.
A) 183.5
B) 201
C) 194
D) 177
A) 183.5
B) 201
C) 194
D) 177
Unlock Deck
Unlock for access to all 76 flashcards in this deck.
Unlock Deck
k this deck
72
For the data set below, find the 37th percentile.
A) 36
B) 46
C) 48.5
D) 37
A) 36
B) 46
C) 48.5
D) 37
Unlock Deck
Unlock for access to all 76 flashcards in this deck.
Unlock Deck
k this deck
73
For the data set below, find the first quartile.
A) 186.5
B) 204
C) 179
D) 195
A) 186.5
B) 204
C) 179
D) 195
Unlock Deck
Unlock for access to all 76 flashcards in this deck.
Unlock Deck
k this deck
74
For the data set below, find the outlier(s).
A) 189
B) 141 and 150
C) 141 and 189
D) None are outliers.
A) 189
B) 141 and 150
C) 141 and 189
D) None are outliers.
Unlock Deck
Unlock for access to all 76 flashcards in this deck.
Unlock Deck
k this deck
75
A soft-drink bottling company fills and ships soda in plastic bottles with a target volume of 354 milliliters. The filling machinery does not deliver a perfectly consistent volume of liquid to each
Bottle, and the three quartiles for the fill volume are Find the IQR.
A) 13.5
B) 10.8
C) 3
D) 9
Bottle, and the three quartiles for the fill volume are
Find the IQR.A) 13.5
B) 10.8
C) 3
D) 9
Unlock Deck
Unlock for access to all 76 flashcards in this deck.
Unlock Deck
k this deck
76
Construct a boxplot for the data set below.
A)
B)
C)
D)
A)
B)
C)
D)
Unlock Deck
Unlock for access to all 76 flashcards in this deck.
Unlock Deck
k this deck
Unlock Deck
Unlock for access to all 76 flashcards in this deck.


