Deck 14: Analysis of Variance
Full screen (f)
Question
 How many degrees of freedom are there for SSE.
A) 3
B) 18
C) 2
D) 19
Question
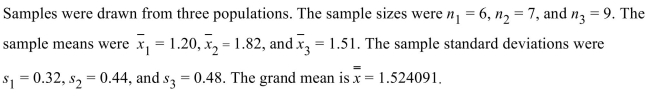
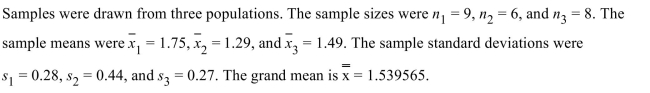
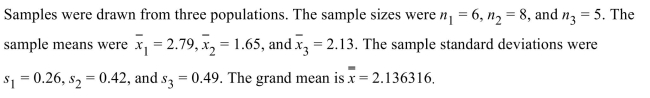
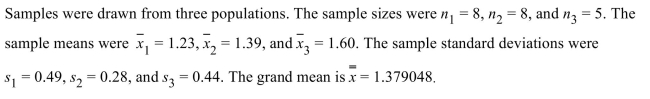
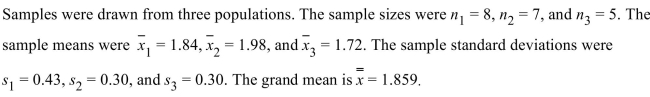
Samples were drawn from three populations. The sample sizes were n1=8, n2=8, and n3=7 . The sample means were  , and
, and  =2.57 . The sample standard deviations were s1=0.27, s2=0.45, and s3=0.25 . The grand mean is
  =2.055217.
i). Compute the sums of squares SSTr and SSE.
ii). How many degrees of freedom are there for SSTr and SSE?
iii). Compute the sums of squares MSTr and MSE.
iv). Compute the value of the test statistic F.
v). Can you conclude that two or more of the population means are different? Use the level of
significance.
, and =2.57 . The sample standard deviations were s1=0.27, s2=0.45, and s3=0.25 . The grand mean is =2.055217.i). Compute the sums of squares SSTr and SSE.
ii). How many degrees of freedom are there for SSTr and SSE?
iii). Compute the sums of squares MSTr and MSE.
iv). Compute the value of the test statistic F.
v). Can you conclude that two or more of the population means are different? Use the
level ofsignificance.
Question
In a one-way ANOVA, the following data were collected:  How many samples are there?
A) 17
B) 5
C) 4
D) 22
How many samples are there?A) 17
B) 5
C) 4
D) 22
Question
 Compute the sum of squares SSTr.
A) 2.6317
B) 0.2604
C) 0.1302
D) 0.8905
Question
 Compute the mean squares MSE.
A) 1.5610
B) 2.3847
C) 0.1325
D) 0.7805
Question
The following table shows the weekly total sales (in dollars) at a small roadside vegetable stand for the months June through September. 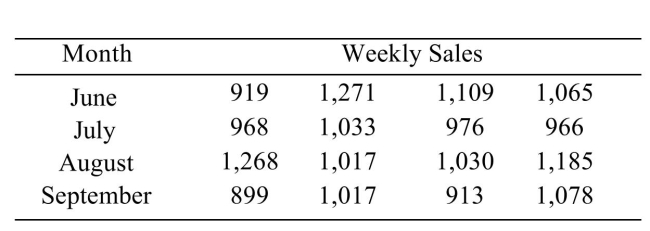 Can you conclude that the weekly sales varies with the month? Use the
  level of significance.
A) No
B) Yes
Can you conclude that the weekly sales varies with the month? Use the level of significance.A) No
B) Yes
Question
 Compute the sum of squares SSE.
A) 0.7919
B) 0.3959
C) 3.7611
D) 2.1055
Question
Question
One of the factors that determines the degree of risk a pesticide poses to human health is the rate at
which it is absorbed into the skin after contact. An important question is whether the amount in the
skin continues to increase with the length of the contact, or whether it increases for only a short time
before leveling off. To investigate this, measured amounts of a certain pesticide were applied to 20
samples of rat skin. Four skins were analyzed at each of the time intervals 1, 2, 4, 10, and 24 hours. The
amounts of the chemical (in micrograms) that were in the skin are given in the following table: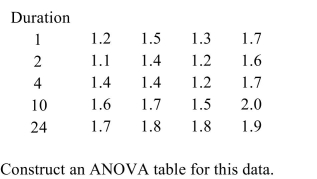
Question
 How many degrees of freedom are there for SSTr.
A) 2
B) 3
C) 24
D) 23
Question
 Can you conclude that two or more of the population means are different? Use the α = 0.05 level of significance.
A) No
B) Yes
Question
Question
The following table shows the weekly total sales (in dollars) at a small roadside vegetable stand for
the months June through September.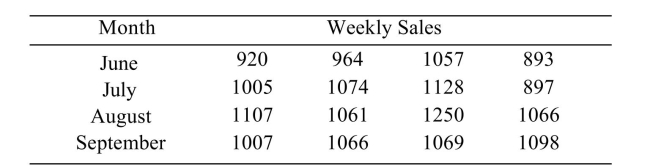 i). Construct an ANOVA table.
ii). Can you conclude that the weekly sales varies with the month? Use the level of significance.
the months June through September.
i). Construct an ANOVA table.ii). Can you conclude that the weekly sales varies with the month? Use the
level of significance. Question
 Compute the mean squares MSTr.
A) 3.0039
B) 1.2667
C) 0.2114
D) 0.4228
Question
The following table shows the weekly total sales (in dollars) at a small roadside vegetable stand for the months June through September. 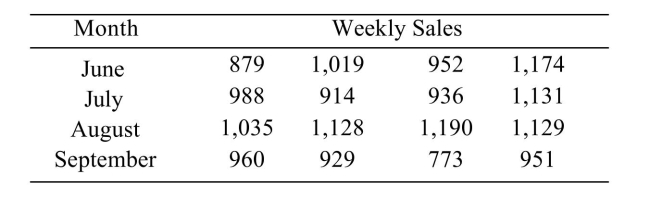 Perform a Tukey-Kramer test to determine which pairs of means, if any, differ. Use the
  level of Significance.
A)
B)
C)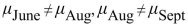
D) There is not enough evidence to conclude that any of the means differ.
Perform a Tukey-Kramer test to determine which pairs of means, if any, differ. Use the level of Significance. A)
B)
C)
D) There is not enough evidence to conclude that any of the means differ.
Question
Question
Question
Question
 Compute the value of the test statistic F.
A) 0.782
B) 2.194
C) 0.101
D) 0.202
Question
Question
Artificial hip joints consist of a ball and socket. As the joint wears, the ball (head) becomes rough. Investigators performed wear tests on metal artificial; hip joints. Joints with several different Diameters were tested. The following table presents measurements of head roughness (in Nanometers).  Perform the Tukey-Kramer test to determine which pairs of means, if any, differ. Use the
  level of Significance.
A) There is not enough evidence to conclude that any of the means differ.
B)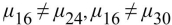
C)
D)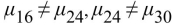
Perform the Tukey-Kramer test to determine which pairs of means, if any, differ. Use the level of Significance. A) There is not enough evidence to conclude that any of the means differ.
B)
C)
D)
Question
An experiment is conducted to study the effects of curing times and curing temperatures on the bonding strength of an epoxy adhesive. In the experiment, two steel rods are adhered together End-to-end, and the bonding strength is defined as the force, in pounds, required to pull the bond Apart. For each combination of curing time and curing temperature, three tests are performed. The Results of the experiment are shown below. 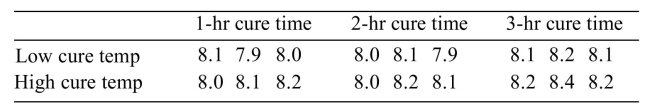 Can the main effect of curing temperature (low or high) on bonding strength be interpreted? If so, interpret the Main effect using the
  level of significance.
A) Yes. Do not reject H0.
B) Yes. Reject H0.
C) No.
Can the main effect of curing temperature (low or high) on bonding strength be interpreted? If so, interpret the Main effect using the level of significance. A) Yes. Do not reject H0.
B) Yes. Reject H0.
C) No.
Question
In a water-bottling facility, several machines fill plastic bottles with 16 ounces of drinking water. The following TI-84 Plus display presents the results of a one-way ANOVA to determine whether
The mean fill volumes differ among the filling machines.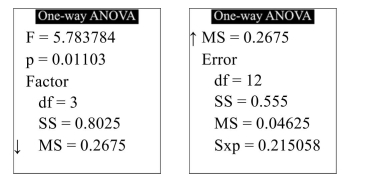 What is the value of SSE?
A) 0.04625
B) 0.8025
C) 0.555
D) 0.2675
The mean fill volumes differ among the filling machines.
What is the value of SSE?A) 0.04625
B) 0.8025
C) 0.555
D) 0.2675
Question
In a water-bottling facility, several machines fill plastic bottles with 16 ounces of drinking water. The following TI-84 Plus display presents the results of a one-way ANOVA to determine whether
The mean fill volumes differ among the filling machines. What is the value of the test statistic?
A) 0.4925
B) 6.459016
C) 0.025417
D) 0.007519
The mean fill volumes differ among the filling machines.
What is the value of the test statistic?A) 0.4925
B) 6.459016
C) 0.025417
D) 0.007519
Question
Interpret the interaction plot by explaining whether there appear to be large interactions between factors. 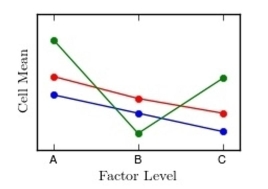
A) Interactions are not large
B) Interactions are large
A) Interactions are not large
B) Interactions are large
Question
An experiment is conducted to study the effects of curing times and curing temperatures on the bonding strength of an epoxy adhesive. In the experiment, two steel rods are adhered together
End-to-end, and the bonding strength is defined as the force, in pounds, required to pull the bond
Apart. For each combination of curing time and curing temperature, three tests are performed. The
Results of the experiment are shown below.
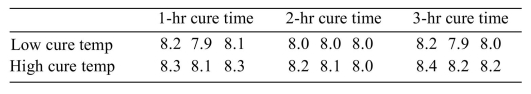
Can the main effect of curing time on bonding strength be interpreted? If so, interpret the main effect. using the level of significance.
A) Yes. Reject H0
B) Yes. Do not reject H0.
C) No.
End-to-end, and the bonding strength is defined as the force, in pounds, required to pull the bond
Apart. For each combination of curing time and curing temperature, three tests are performed. The
Results of the experiment are shown below.
Can the main effect of curing time on bonding strength be interpreted? If so, interpret the main effect. using the
level of significance.A) Yes. Reject H0
B) Yes. Do not reject H0.
C) No.
Question
Artificial hip joints consist of a ball and socket. As the joint wears, the ball (head) becomes rough. Investigators performed wear tests on metal artificial; hip joints. Joints with several different
Diameters were tested. The following table presents measurements of head roughness (in
Nanometers).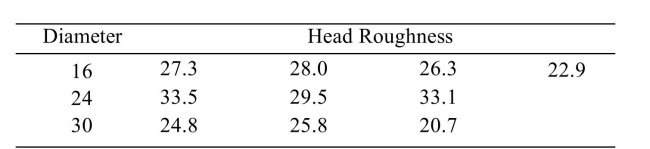 Can you conclude that the mean roughness varies with diameter? Use the
  level of significance.
A) Yes
B) No
Diameters were tested. The following table presents measurements of head roughness (in
Nanometers).
Can you conclude that the mean roughness varies with diameter? Use the level of significance.A) Yes
B) No
Question
In a water-bottling facility, several machines fill plastic bottles with 16 ounces of drinking water. The following TI-84 Plus display presents the results of a one-way ANOVA to determine whether
The mean fill volumes differ among the filling machines. What is the value of SSTr?
A) 0.049792
B) 0.5975
C) 0.152292
D) 0.456875
The mean fill volumes differ among the filling machines.
What is the value of SSTr?A) 0.049792
B) 0.5975
C) 0.152292
D) 0.456875
Question
Interpret the interaction plot by explaining whether there appear to be large interactions between factors. 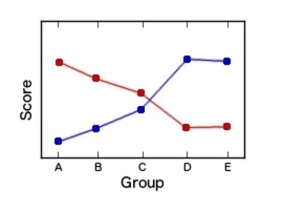
A) Interactions are not large
B) Interactions are large
A) Interactions are not large
B) Interactions are large
Question
In a water-bottling facility, several machines fill plastic bottles with 16 ounces of drinking water. The following TI-84 Plus display presents the results of a one-way ANOVA to determine whether
The mean fill volumes differ among the filling machines.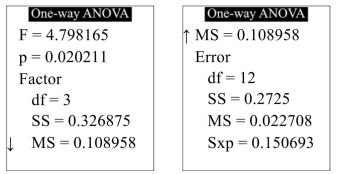 What is the P-value?
A) 0.326875
B) 0.022708
C) 4.798165
D) 0.020211
The mean fill volumes differ among the filling machines.
What is the P-value?A) 0.326875
B) 0.022708
C) 4.798165
D) 0.020211
Question
An experiment is conducted to study the effects of curing times and curing temperatures on the bonding strength of an epoxy adhesive. In the experiment, two steel rods are adhered together
End-to-end, and the bonding strength is defined as the force, in pounds, required to pull the bond
Apart. For each combination of curing time and curing temperature, three tests are performed. The
Results of the experiment are shown below. Can you reject the hypothesis of no interactions?
A) No
B) Yes
End-to-end, and the bonding strength is defined as the force, in pounds, required to pull the bond
Apart. For each combination of curing time and curing temperature, three tests are performed. The
Results of the experiment are shown below.
Can you reject the hypothesis of no interactions?A) No
B) Yes
Question
Artificial hip joints consist of a ball and socket. As the joint wears, the ball (head) becomes rough.
Investigators performed wear tests on metal, artificial hip joints. Joints with several different diameters were
tested. The following table presents measurements of head roughness (in nanometers).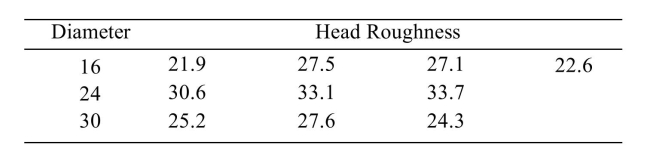 i). Construct an ANOVA table.
ii). Can you conclude that the mean roughness varies with diameter? Use the level of significance.
Investigators performed wear tests on metal, artificial hip joints. Joints with several different diameters were
tested. The following table presents measurements of head roughness (in nanometers).
i). Construct an ANOVA table.ii). Can you conclude that the mean roughness varies with diameter? Use the
level of significance. Question
In a water-bottling facility, several machines fill plastic bottles with 16 ounces of drinking water. The following TI-84 Plus display presents the results of a one-way ANOVA to determine whether
The mean fill volumes differ among the filling machines.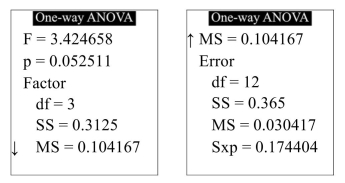 What is the value of MSE?
A) 0.3125
B) 0.365
C) 0.030417
D) 0.104167
The mean fill volumes differ among the filling machines.
What is the value of MSE?A) 0.3125
B) 0.365
C) 0.030417
D) 0.104167
Question
In a water-bottling facility, several machines fill plastic bottles with 16 ounces of drinking water. The following TI-84 Plus display presents the results of a one-way ANOVA to determine whether
The mean fill volumes differ among the filling machines.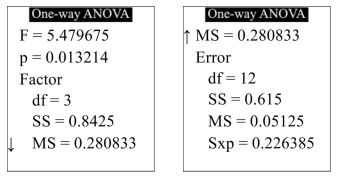 Can you conclude that the mean fill volume differs among the filling machines? Use the
  level of
Significance.
A) No
B) Yes
The mean fill volumes differ among the filling machines.
Can you conclude that the mean fill volume differs among the filling machines? Use the level ofSignificance.
A) No
B) Yes
Question
One of the factors that determines the degree of risk a pesticide poses to human health is the rate at which it is absorbed into the skin after contact. An important question is whether the amount in the Skin continues to increase with the length of the contact, or whether it increases for only a short time Before leveling off. To investigate this, measured amounts of a certain pesticide were applied to 20 Samples of rat skin. Four skins were analyzed at each of the time intervals 1, 2, 4, 10, and 24 hours. The Amounts of the chemical (in micrograms) that were in the skin are given in the following table: 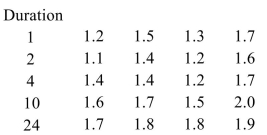 Perform the Tukey-Kramer test to determine which pairs of means, if any, differ. Use the
  level of Significance.
A)
B) There is not enough evidence to conclude that any of the means differ.
C)
D)
Perform the Tukey-Kramer test to determine which pairs of means, if any, differ. Use the level of Significance. A)
B) There is not enough evidence to conclude that any of the means differ.
C)
D)
Question
An experiment is conducted to study the effects of curing times and curing temperatures on the
bonding strength of an epoxy adhesive. In the experiment, two steel rods are adhered together
end-to-end, and the bonding strength is defined as the force, in pounds, required to pull the bond
apart. For each combination of curing time and curing temperature, three tests are performed. The
results of the experiment are shown below.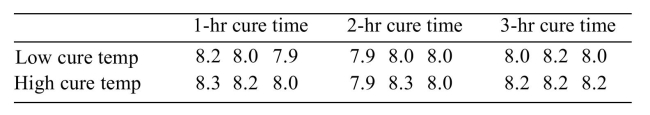 i). Can you reject the hypothesis of no interactions?
ii). Can the main effect of curing temperature (low or high) on bonding strength be interpreted? If so, interpret
the main effect using the α = 0.05 level of significance.
iii). Can the main effect of curing time on bonding strength be interpreted? If so, interpret the main effect using
the level of significance.
bonding strength of an epoxy adhesive. In the experiment, two steel rods are adhered together
end-to-end, and the bonding strength is defined as the force, in pounds, required to pull the bond
apart. For each combination of curing time and curing temperature, three tests are performed. The
results of the experiment are shown below.
i). Can you reject the hypothesis of no interactions?ii). Can the main effect of curing temperature (low or high) on bonding strength be interpreted? If so, interpret
the main effect using the α = 0.05 level of significance.
iii). Can the main effect of curing time on bonding strength be interpreted? If so, interpret the main effect using
the
level of significance. Question
In a water-bottling facility, several machines fill plastic bottles with 16 ounces of drinking water. The following TI-84 Plus display presents the results of a one-way ANOVA to determine whether
The mean fill volumes differ among the filling machines.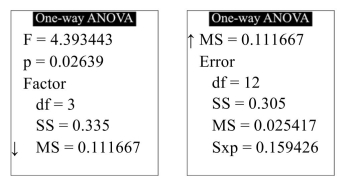 What is the value of MSTr?
A) 0.111667
B) 0.305
C) 0.025417
D) 0.335
The mean fill volumes differ among the filling machines.
What is the value of MSTr?A) 0.111667
B) 0.305
C) 0.025417
D) 0.335
Question
In a water-bottling facility, several machines fill plastic bottles with 16 ounces of drinking water.
The following TI-84 Plus display presents the results of a one-way ANOVA to determine whether
the mean fill volumes differ among the filling machines.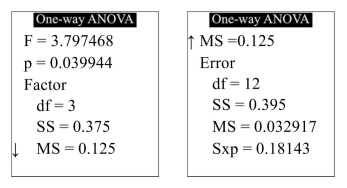 i). State the null hypothesis.
ii). How many filling machines were involved in the study?
iii). Assume the design was balanced. How many water bottles were measured for each filling machine?
iv). What are the values of SSTr, SSE, MSTr, and MSE?
v). What is the value of the test statistic?
vi). What is the P-value?
vii). Can you conclude that the mean fill volume differs among the filling machines? Use the level
level
of significance.
The following TI-84 Plus display presents the results of a one-way ANOVA to determine whether
the mean fill volumes differ among the filling machines.
i). State the null hypothesis.ii). How many filling machines were involved in the study?
iii). Assume the design was balanced. How many water bottles were measured for each filling machine?
iv). What are the values of SSTr, SSE, MSTr, and MSE?
v). What is the value of the test statistic?
vi). What is the P-value?
vii). Can you conclude that the mean fill volume differs among the filling machines? Use the
levelof significance.
Question
One of the factors that determines the degree of risk a pesticide poses to human health is the rate at which it is absorbed into the skin after contact. An important question is whether the amount in the
Skin continues to increase with the length of the contact, or whether it increases for only a short time
Before leveling off. To investigate this, measured amounts of a certain pesticide were applied to 20
Samples of rat skin. Four skins were analyzed at each of the time intervals 1, 2, 4, 10, and 24 hours. The
Amounts of the chemical (in micrograms) that were in the skin are given in the following table: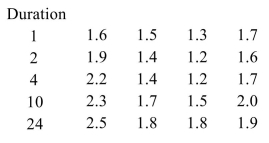 Can you conclude the amount in the skin varies with time? Use the
  level of significance.
A) No
B) Yes
Skin continues to increase with the length of the contact, or whether it increases for only a short time
Before leveling off. To investigate this, measured amounts of a certain pesticide were applied to 20
Samples of rat skin. Four skins were analyzed at each of the time intervals 1, 2, 4, 10, and 24 hours. The
Amounts of the chemical (in micrograms) that were in the skin are given in the following table:
Can you conclude the amount in the skin varies with time? Use the level of significance.A) No
B) Yes
Question
Interpret the interaction plot by explaining whether there appear to be large interactions between factors. 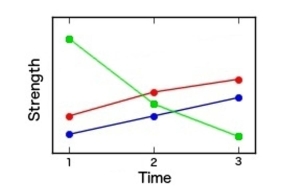
A) Interactions are large
B) Interactions are not large
A) Interactions are large
B) Interactions are not large
Question
An agricultural scientist performs a 2-way ANOVA to determine the effects of three different soil mixtures on the sprouting time (in days) of three varieties of hybrid cucumber seeds. The following
MINITAB output presents the results.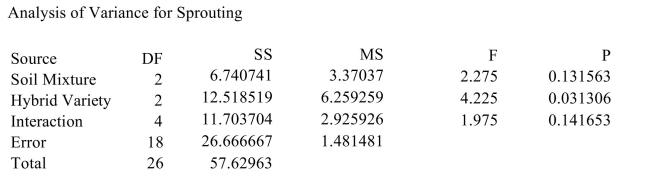 Can the mean effect of the soil mixture be interpreted? If so, interpret the main effect. Use the
  level Of significance.
A) Yes. Do not reject H0.
B) Yes. Reject H0.
C) No.
MINITAB output presents the results.
Can the mean effect of the soil mixture be interpreted? If so, interpret the main effect. Use the level Of significance. A) Yes. Do not reject H0.
B) Yes. Reject H0.
C) No.
Question
The following table presents measurements of the tensile strength (in kilopascals) of asphalt-rubber
concrete beams for three levels of binder content and three levels of rubber content.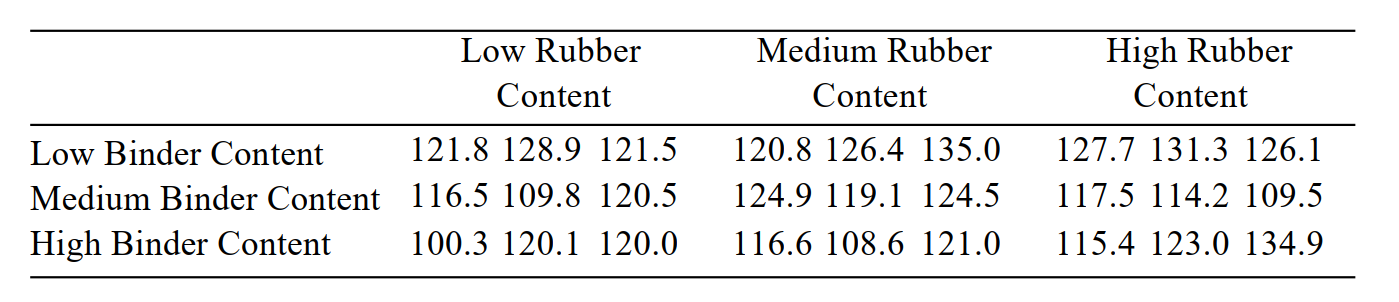
i). Can you reject the hypothesis of no interactions?
ii). Can the mean effect of the binder content be interpreted? If so, interpret the main effect. Use the level of significance.
iii). Can the mean effect of the rubber content be interpreted? If so, interpret the main effect. Use the level of significance.
concrete beams for three levels of binder content and three levels of rubber content.
i). Can you reject the hypothesis of no interactions?
ii). Can the mean effect of the binder content be interpreted? If so, interpret the main effect. Use the
level of significance.iii). Can the mean effect of the rubber content be interpreted? If so, interpret the main effect. Use the level of significance.
Question
The following table presents measurements of the tensile strength (in kilopascals) of asphalt-rubber concrete beams for three levels of binder content and three levels of rubber content. 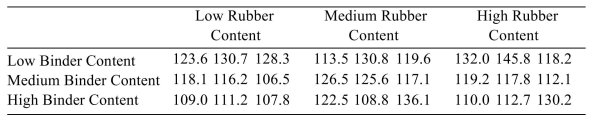
Can the mean effect of the rubber content be interpreted? If so, interpret the main effect. Use the a= level of significance.
A) Yes. Reject H0
B) No.
C) Yes. Do not reject H0
Can the mean effect of the rubber content be interpreted? If so, interpret the main effect. Use the a= level of significance.
A) Yes. Reject H0
B) No.
C) Yes. Do not reject H0
Question
An agricultural scientist performs a 2-way ANOVA to determine the effects of three different soil
mixtures on the sprouting time (in days) of three varieties of hybrid cucumber seeds. The following
MINITAB output presents the results.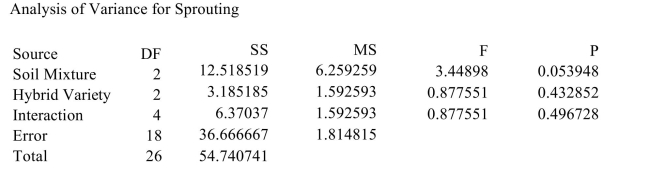 i). Can you reject the hypothesis of no interactions?
ii). Can the mean effect of the soil mixture be interpreted? If so, interpret the main effect. Use the α = 0.01
level of significance.
iii). Can the mean effect of the hybrid variety be interpreted? If so, interpret the main effect. Use the α = 0.01
level of significance.
mixtures on the sprouting time (in days) of three varieties of hybrid cucumber seeds. The following
MINITAB output presents the results.
i). Can you reject the hypothesis of no interactions?ii). Can the mean effect of the soil mixture be interpreted? If so, interpret the main effect. Use the α = 0.01
level of significance.
iii). Can the mean effect of the hybrid variety be interpreted? If so, interpret the main effect. Use the α = 0.01
level of significance.
Question
The following table presents measurements of the tensile strength (in kilopascals) of asphalt-rubber concrete beams for three levels of binder content and three levels of rubber content.  Can you reject the hypothesis of no interactions?
A) Yes
B) No
Can you reject the hypothesis of no interactions?A) Yes
B) No
Question
An agricultural scientist performs a 2-way ANOVA to determine the effects of three different soil mixtures on the sprouting time (in days) of three varieties of hybrid cucumber seeds. The following
MINITAB output presents the results. Can you reject the hypothesis of no interactions?
A) No
B) Yes
MINITAB output presents the results.
Can you reject the hypothesis of no interactions?A) No
B) Yes
Question
The following table presents measurements of the tensile strength (in kilopascals) of asphalt-rubber concrete beams for three levels of binder content and three levels of rubber content. 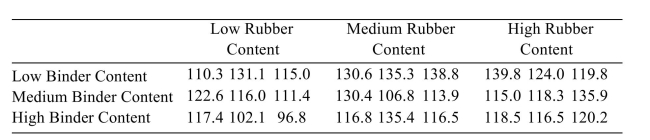 Can the mean effect of the binder content be interpreted? If so, interpret the main effect. Use the
  = 0.01 Level of significance.
A) No.
B) Yes. Reject. H0
C) Yes. Do not reject H0
Can the mean effect of the binder content be interpreted? If so, interpret the main effect. Use the = 0.01 Level of significance. A) No.
B) Yes. Reject. H0
C) Yes. Do not reject H0
Question
An agricultural scientist performs a 2-way ANOVA to determine the effects of three different soil mixtures on the sprouting time (in days) of three varieties of hybrid cucumber seeds. The following
MINITAB output presents the results.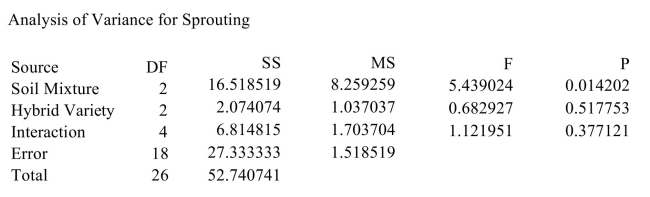 Can the mean effect of the hybrid variety be interpreted? If so, interpret the main effect. Use the α = 0.05 Level of significance.
A) Yes. Do not reject H0.
B) Yes. Reject H0.
C) No.
MINITAB output presents the results.
Can the mean effect of the hybrid variety be interpreted? If so, interpret the main effect. Use the α = 0.05 Level of significance. A) Yes. Do not reject H0.
B) Yes. Reject H0.
C) No.

Unlock Deck
Sign up to unlock the cards in this deck!
Unlock Deck
Unlock Deck
1/48
Play
Full screen (f)
Deck 14: Analysis of Variance
1
How many degrees of freedom are there for SSE.A) 3
B) 18
C) 2
D) 19
19
2
Samples were drawn from three populations. The sample sizes were n1=8, n2=8, and n3=7 . The sample means were , and =2.57 . The sample standard deviations were s1=0.27, s2=0.45, and s3=0.25 . The grand mean is =2.055217.
i). Compute the sums of squares SSTr and SSE.
ii). How many degrees of freedom are there for SSTr and SSE?
iii). Compute the sums of squares MSTr and MSE.
iv). Compute the value of the test statistic F.
v). Can you conclude that two or more of the population means are different? Use the level of
significance.
, and =2.57 . The sample standard deviations were s1=0.27, s2=0.45, and s3=0.25 . The grand mean is =2.055217.i). Compute the sums of squares SSTr and SSE.
ii). How many degrees of freedom are there for SSTr and SSE?
iii). Compute the sums of squares MSTr and MSE.
iv). Compute the value of the test statistic F.
v). Can you conclude that two or more of the population means are different? Use the
level ofsignificance.
i). SSTr = 2.8970; SSE = 2.3028
ii). degrees of freedom for SSTr = 2; degrees of freedom for SSE = 20
iii). MSTr = 1.4485; MSE = 0.1151
iv). 12.580
v). Yes
ii). degrees of freedom for SSTr = 2; degrees of freedom for SSE = 20
iii). MSTr = 1.4485; MSE = 0.1151
iv). 12.580
v). Yes
3
In a one-way ANOVA, the following data were collected: How many samples are there?
A) 17
B) 5
C) 4
D) 22
How many samples are there?A) 17
B) 5
C) 4
D) 22
5
4
Compute the sum of squares SSTr.A) 2.6317
B) 0.2604
C) 0.1302
D) 0.8905
Unlock Deck
Unlock for access to all 48 flashcards in this deck.
Unlock Deck
k this deck
5
Compute the mean squares MSE.A) 1.5610
B) 2.3847
C) 0.1325
D) 0.7805
Unlock Deck
Unlock for access to all 48 flashcards in this deck.
Unlock Deck
k this deck
6
The following table shows the weekly total sales (in dollars) at a small roadside vegetable stand for the months June through September. Can you conclude that the weekly sales varies with the month? Use the level of significance.
A) No
B) Yes
Can you conclude that the weekly sales varies with the month? Use the level of significance.A) No
B) Yes
Unlock Deck
Unlock for access to all 48 flashcards in this deck.
Unlock Deck
k this deck
7
Compute the sum of squares SSE.A) 0.7919
B) 0.3959
C) 3.7611
D) 2.1055
Unlock Deck
Unlock for access to all 48 flashcards in this deck.
Unlock Deck
k this deck
8
In a one-way ANOVA, the following data were collected: SSTr = 0.42, SSE = 2.15, N = 30, I = 4.
i). How many samples are there?
ii). How many degrees of freedom are there for SSTr and SSE?
iii). Compute the mean squares MSTr and MSE.
iv). Compute the value of the test statistic F.
i). How many samples are there?
ii). How many degrees of freedom are there for SSTr and SSE?
iii). Compute the mean squares MSTr and MSE.
iv). Compute the value of the test statistic F.
Unlock Deck
Unlock for access to all 48 flashcards in this deck.
Unlock Deck
k this deck
9
One of the factors that determines the degree of risk a pesticide poses to human health is the rate at
which it is absorbed into the skin after contact. An important question is whether the amount in the
skin continues to increase with the length of the contact, or whether it increases for only a short time
before leveling off. To investigate this, measured amounts of a certain pesticide were applied to 20
samples of rat skin. Four skins were analyzed at each of the time intervals 1, 2, 4, 10, and 24 hours. The
amounts of the chemical (in micrograms) that were in the skin are given in the following table:
which it is absorbed into the skin after contact. An important question is whether the amount in the
skin continues to increase with the length of the contact, or whether it increases for only a short time
before leveling off. To investigate this, measured amounts of a certain pesticide were applied to 20
samples of rat skin. Four skins were analyzed at each of the time intervals 1, 2, 4, 10, and 24 hours. The
amounts of the chemical (in micrograms) that were in the skin are given in the following table:
Unlock Deck
Unlock for access to all 48 flashcards in this deck.
Unlock Deck
k this deck
10
How many degrees of freedom are there for SSTr.A) 2
B) 3
C) 24
D) 23
Unlock Deck
Unlock for access to all 48 flashcards in this deck.
Unlock Deck
k this deck
11
Can you conclude that two or more of the population means are different? Use the α = 0.05 level of significance.A) No
B) Yes
Unlock Deck
Unlock for access to all 48 flashcards in this deck.
Unlock Deck
k this deck
12
In a one-way ANOVA, the following data were collected: SSTr = 0.49, SSE = 2.2, N = 35, I = 4. Compute the mean squares MSE.
A) 0.0158
B) 0.0710
C) 0.1633
D) 2.3015
A) 0.0158
B) 0.0710
C) 0.1633
D) 2.3015
Unlock Deck
Unlock for access to all 48 flashcards in this deck.
Unlock Deck
k this deck
13
The following table shows the weekly total sales (in dollars) at a small roadside vegetable stand for
the months June through September. i). Construct an ANOVA table.
ii). Can you conclude that the weekly sales varies with the month? Use the level of significance.
the months June through September.
i). Construct an ANOVA table.ii). Can you conclude that the weekly sales varies with the month? Use the
level of significance. Unlock Deck
Unlock for access to all 48 flashcards in this deck.
Unlock Deck
k this deck
14
Compute the mean squares MSTr.A) 3.0039
B) 1.2667
C) 0.2114
D) 0.4228
Unlock Deck
Unlock for access to all 48 flashcards in this deck.
Unlock Deck
k this deck
15
The following table shows the weekly total sales (in dollars) at a small roadside vegetable stand for the months June through September. Perform a Tukey-Kramer test to determine which pairs of means, if any, differ. Use the level of Significance.
A)
B)
C)
D) There is not enough evidence to conclude that any of the means differ.
Perform a Tukey-Kramer test to determine which pairs of means, if any, differ. Use the level of Significance. A)
B)
C)
D) There is not enough evidence to conclude that any of the means differ.
Unlock Deck
Unlock for access to all 48 flashcards in this deck.
Unlock Deck
k this deck
16
In a one-way ANOVA, the following data were collected: SSTr = 0.3, SSE = 1.55, N = 35, I = 6. Compute the mean squares MSTr.
A) 0.0534
B) 0.0103
C) 1.1226
D) 0.0600
A) 0.0534
B) 0.0103
C) 1.1226
D) 0.0600
Unlock Deck
Unlock for access to all 48 flashcards in this deck.
Unlock Deck
k this deck
17
In a one-way ANOVA, the following data were collected: SSTr = 0.43, SSE = 1.87, N = 39, I = 5. How many degrees of freedom are there for SSTr?
A) 5
B) 39
C) 4
D) 34
A) 5
B) 39
C) 4
D) 34
Unlock Deck
Unlock for access to all 48 flashcards in this deck.
Unlock Deck
k this deck
18
In a one-way ANOVA, the following data were collected: SSTr = 0.37, SSE = 2.31, N = 30, I = 3. Compute the value of the test statistic F.
A) 0.1850
B) 0.0137
C) 2.1623
D) 0.0856
A) 0.1850
B) 0.0137
C) 2.1623
D) 0.0856
Unlock Deck
Unlock for access to all 48 flashcards in this deck.
Unlock Deck
k this deck
19
Compute the value of the test statistic F.A) 0.782
B) 2.194
C) 0.101
D) 0.202
Unlock Deck
Unlock for access to all 48 flashcards in this deck.
Unlock Deck
k this deck
20
In a one-way ANOVA, the following data were collected: SSTr = 0.43, SSE = 2.32, N = 33, I = 6. How many degrees of freedom are there for SSE?
A) 6
B) 27
C) 5
D) 33
A) 6
B) 27
C) 5
D) 33
Unlock Deck
Unlock for access to all 48 flashcards in this deck.
Unlock Deck
k this deck
21
Artificial hip joints consist of a ball and socket. As the joint wears, the ball (head) becomes rough. Investigators performed wear tests on metal artificial; hip joints. Joints with several different Diameters were tested. The following table presents measurements of head roughness (in Nanometers). Perform the Tukey-Kramer test to determine which pairs of means, if any, differ. Use the level of Significance.
A) There is not enough evidence to conclude that any of the means differ.
B)
C)
D)
Perform the Tukey-Kramer test to determine which pairs of means, if any, differ. Use the level of Significance. A) There is not enough evidence to conclude that any of the means differ.
B)
C)
D)
Unlock Deck
Unlock for access to all 48 flashcards in this deck.
Unlock Deck
k this deck
22
An experiment is conducted to study the effects of curing times and curing temperatures on the bonding strength of an epoxy adhesive. In the experiment, two steel rods are adhered together End-to-end, and the bonding strength is defined as the force, in pounds, required to pull the bond Apart. For each combination of curing time and curing temperature, three tests are performed. The Results of the experiment are shown below. Can the main effect of curing temperature (low or high) on bonding strength be interpreted? If so, interpret the Main effect using the level of significance.
A) Yes. Do not reject H0.
B) Yes. Reject H0.
C) No.
Can the main effect of curing temperature (low or high) on bonding strength be interpreted? If so, interpret the Main effect using the level of significance. A) Yes. Do not reject H0.
B) Yes. Reject H0.
C) No.
Unlock Deck
Unlock for access to all 48 flashcards in this deck.
Unlock Deck
k this deck
23
In a water-bottling facility, several machines fill plastic bottles with 16 ounces of drinking water. The following TI-84 Plus display presents the results of a one-way ANOVA to determine whether
The mean fill volumes differ among the filling machines. What is the value of SSE?
A) 0.04625
B) 0.8025
C) 0.555
D) 0.2675
The mean fill volumes differ among the filling machines.
What is the value of SSE?A) 0.04625
B) 0.8025
C) 0.555
D) 0.2675
Unlock Deck
Unlock for access to all 48 flashcards in this deck.
Unlock Deck
k this deck
24
In a water-bottling facility, several machines fill plastic bottles with 16 ounces of drinking water. The following TI-84 Plus display presents the results of a one-way ANOVA to determine whether
The mean fill volumes differ among the filling machines. What is the value of the test statistic?
A) 0.4925
B) 6.459016
C) 0.025417
D) 0.007519
The mean fill volumes differ among the filling machines.
What is the value of the test statistic?A) 0.4925
B) 6.459016
C) 0.025417
D) 0.007519
Unlock Deck
Unlock for access to all 48 flashcards in this deck.
Unlock Deck
k this deck
25
Interpret the interaction plot by explaining whether there appear to be large interactions between factors.
A) Interactions are not large
B) Interactions are large
A) Interactions are not large
B) Interactions are large
Unlock Deck
Unlock for access to all 48 flashcards in this deck.
Unlock Deck
k this deck
26
An experiment is conducted to study the effects of curing times and curing temperatures on the bonding strength of an epoxy adhesive. In the experiment, two steel rods are adhered together
End-to-end, and the bonding strength is defined as the force, in pounds, required to pull the bond
Apart. For each combination of curing time and curing temperature, three tests are performed. The
Results of the experiment are shown below.
Can the main effect of curing time on bonding strength be interpreted? If so, interpret the main effect. using the level of significance.
A) Yes. Reject H0
B) Yes. Do not reject H0.
C) No.
End-to-end, and the bonding strength is defined as the force, in pounds, required to pull the bond
Apart. For each combination of curing time and curing temperature, three tests are performed. The
Results of the experiment are shown below.
Can the main effect of curing time on bonding strength be interpreted? If so, interpret the main effect. using the
level of significance.A) Yes. Reject H0
B) Yes. Do not reject H0.
C) No.
Unlock Deck
Unlock for access to all 48 flashcards in this deck.
Unlock Deck
k this deck
27
Artificial hip joints consist of a ball and socket. As the joint wears, the ball (head) becomes rough. Investigators performed wear tests on metal artificial; hip joints. Joints with several different
Diameters were tested. The following table presents measurements of head roughness (in
Nanometers). Can you conclude that the mean roughness varies with diameter? Use the level of significance.
A) Yes
B) No
Diameters were tested. The following table presents measurements of head roughness (in
Nanometers).
Can you conclude that the mean roughness varies with diameter? Use the level of significance.A) Yes
B) No
Unlock Deck
Unlock for access to all 48 flashcards in this deck.
Unlock Deck
k this deck
28
In a water-bottling facility, several machines fill plastic bottles with 16 ounces of drinking water. The following TI-84 Plus display presents the results of a one-way ANOVA to determine whether
The mean fill volumes differ among the filling machines. What is the value of SSTr?
A) 0.049792
B) 0.5975
C) 0.152292
D) 0.456875
The mean fill volumes differ among the filling machines.
What is the value of SSTr?A) 0.049792
B) 0.5975
C) 0.152292
D) 0.456875
Unlock Deck
Unlock for access to all 48 flashcards in this deck.
Unlock Deck
k this deck
29
Interpret the interaction plot by explaining whether there appear to be large interactions between factors.
A) Interactions are not large
B) Interactions are large
A) Interactions are not large
B) Interactions are large
Unlock Deck
Unlock for access to all 48 flashcards in this deck.
Unlock Deck
k this deck
30
In a water-bottling facility, several machines fill plastic bottles with 16 ounces of drinking water. The following TI-84 Plus display presents the results of a one-way ANOVA to determine whether
The mean fill volumes differ among the filling machines. What is the P-value?
A) 0.326875
B) 0.022708
C) 4.798165
D) 0.020211
The mean fill volumes differ among the filling machines.
What is the P-value?A) 0.326875
B) 0.022708
C) 4.798165
D) 0.020211
Unlock Deck
Unlock for access to all 48 flashcards in this deck.
Unlock Deck
k this deck
31
An experiment is conducted to study the effects of curing times and curing temperatures on the bonding strength of an epoxy adhesive. In the experiment, two steel rods are adhered together
End-to-end, and the bonding strength is defined as the force, in pounds, required to pull the bond
Apart. For each combination of curing time and curing temperature, three tests are performed. The
Results of the experiment are shown below. Can you reject the hypothesis of no interactions?
A) No
B) Yes
End-to-end, and the bonding strength is defined as the force, in pounds, required to pull the bond
Apart. For each combination of curing time and curing temperature, three tests are performed. The
Results of the experiment are shown below.
Can you reject the hypothesis of no interactions?A) No
B) Yes
Unlock Deck
Unlock for access to all 48 flashcards in this deck.
Unlock Deck
k this deck
32
Artificial hip joints consist of a ball and socket. As the joint wears, the ball (head) becomes rough.
Investigators performed wear tests on metal, artificial hip joints. Joints with several different diameters were
tested. The following table presents measurements of head roughness (in nanometers). i). Construct an ANOVA table.
ii). Can you conclude that the mean roughness varies with diameter? Use the level of significance.
Investigators performed wear tests on metal, artificial hip joints. Joints with several different diameters were
tested. The following table presents measurements of head roughness (in nanometers).
i). Construct an ANOVA table.ii). Can you conclude that the mean roughness varies with diameter? Use the
level of significance. Unlock Deck
Unlock for access to all 48 flashcards in this deck.
Unlock Deck
k this deck
33
In a water-bottling facility, several machines fill plastic bottles with 16 ounces of drinking water. The following TI-84 Plus display presents the results of a one-way ANOVA to determine whether
The mean fill volumes differ among the filling machines. What is the value of MSE?
A) 0.3125
B) 0.365
C) 0.030417
D) 0.104167
The mean fill volumes differ among the filling machines.
What is the value of MSE?A) 0.3125
B) 0.365
C) 0.030417
D) 0.104167
Unlock Deck
Unlock for access to all 48 flashcards in this deck.
Unlock Deck
k this deck
34
In a water-bottling facility, several machines fill plastic bottles with 16 ounces of drinking water. The following TI-84 Plus display presents the results of a one-way ANOVA to determine whether
The mean fill volumes differ among the filling machines. Can you conclude that the mean fill volume differs among the filling machines? Use the level of
Significance.
A) No
B) Yes
The mean fill volumes differ among the filling machines.
Can you conclude that the mean fill volume differs among the filling machines? Use the level ofSignificance.
A) No
B) Yes
Unlock Deck
Unlock for access to all 48 flashcards in this deck.
Unlock Deck
k this deck
35
One of the factors that determines the degree of risk a pesticide poses to human health is the rate at which it is absorbed into the skin after contact. An important question is whether the amount in the Skin continues to increase with the length of the contact, or whether it increases for only a short time Before leveling off. To investigate this, measured amounts of a certain pesticide were applied to 20 Samples of rat skin. Four skins were analyzed at each of the time intervals 1, 2, 4, 10, and 24 hours. The Amounts of the chemical (in micrograms) that were in the skin are given in the following table: Perform the Tukey-Kramer test to determine which pairs of means, if any, differ. Use the level of Significance.
A)
B) There is not enough evidence to conclude that any of the means differ.
C)
D)
Perform the Tukey-Kramer test to determine which pairs of means, if any, differ. Use the level of Significance. A)
B) There is not enough evidence to conclude that any of the means differ.
C)
D)
Unlock Deck
Unlock for access to all 48 flashcards in this deck.
Unlock Deck
k this deck
36
An experiment is conducted to study the effects of curing times and curing temperatures on the
bonding strength of an epoxy adhesive. In the experiment, two steel rods are adhered together
end-to-end, and the bonding strength is defined as the force, in pounds, required to pull the bond
apart. For each combination of curing time and curing temperature, three tests are performed. The
results of the experiment are shown below. i). Can you reject the hypothesis of no interactions?
ii). Can the main effect of curing temperature (low or high) on bonding strength be interpreted? If so, interpret
the main effect using the α = 0.05 level of significance.
iii). Can the main effect of curing time on bonding strength be interpreted? If so, interpret the main effect using
the level of significance.
bonding strength of an epoxy adhesive. In the experiment, two steel rods are adhered together
end-to-end, and the bonding strength is defined as the force, in pounds, required to pull the bond
apart. For each combination of curing time and curing temperature, three tests are performed. The
results of the experiment are shown below.
i). Can you reject the hypothesis of no interactions?ii). Can the main effect of curing temperature (low or high) on bonding strength be interpreted? If so, interpret
the main effect using the α = 0.05 level of significance.
iii). Can the main effect of curing time on bonding strength be interpreted? If so, interpret the main effect using
the
level of significance. Unlock Deck
Unlock for access to all 48 flashcards in this deck.
Unlock Deck
k this deck
37
In a water-bottling facility, several machines fill plastic bottles with 16 ounces of drinking water. The following TI-84 Plus display presents the results of a one-way ANOVA to determine whether
The mean fill volumes differ among the filling machines. What is the value of MSTr?
A) 0.111667
B) 0.305
C) 0.025417
D) 0.335
The mean fill volumes differ among the filling machines.
What is the value of MSTr?A) 0.111667
B) 0.305
C) 0.025417
D) 0.335
Unlock Deck
Unlock for access to all 48 flashcards in this deck.
Unlock Deck
k this deck
38
In a water-bottling facility, several machines fill plastic bottles with 16 ounces of drinking water.
The following TI-84 Plus display presents the results of a one-way ANOVA to determine whether
the mean fill volumes differ among the filling machines. i). State the null hypothesis.
ii). How many filling machines were involved in the study?
iii). Assume the design was balanced. How many water bottles were measured for each filling machine?
iv). What are the values of SSTr, SSE, MSTr, and MSE?
v). What is the value of the test statistic?
vi). What is the P-value?
vii). Can you conclude that the mean fill volume differs among the filling machines? Use the level
of significance.
The following TI-84 Plus display presents the results of a one-way ANOVA to determine whether
the mean fill volumes differ among the filling machines.
i). State the null hypothesis.ii). How many filling machines were involved in the study?
iii). Assume the design was balanced. How many water bottles were measured for each filling machine?
iv). What are the values of SSTr, SSE, MSTr, and MSE?
v). What is the value of the test statistic?
vi). What is the P-value?
vii). Can you conclude that the mean fill volume differs among the filling machines? Use the
levelof significance.
Unlock Deck
Unlock for access to all 48 flashcards in this deck.
Unlock Deck
k this deck
39
One of the factors that determines the degree of risk a pesticide poses to human health is the rate at which it is absorbed into the skin after contact. An important question is whether the amount in the
Skin continues to increase with the length of the contact, or whether it increases for only a short time
Before leveling off. To investigate this, measured amounts of a certain pesticide were applied to 20
Samples of rat skin. Four skins were analyzed at each of the time intervals 1, 2, 4, 10, and 24 hours. The
Amounts of the chemical (in micrograms) that were in the skin are given in the following table: Can you conclude the amount in the skin varies with time? Use the level of significance.
A) No
B) Yes
Skin continues to increase with the length of the contact, or whether it increases for only a short time
Before leveling off. To investigate this, measured amounts of a certain pesticide were applied to 20
Samples of rat skin. Four skins were analyzed at each of the time intervals 1, 2, 4, 10, and 24 hours. The
Amounts of the chemical (in micrograms) that were in the skin are given in the following table:
Can you conclude the amount in the skin varies with time? Use the level of significance.A) No
B) Yes
Unlock Deck
Unlock for access to all 48 flashcards in this deck.
Unlock Deck
k this deck
40
Interpret the interaction plot by explaining whether there appear to be large interactions between factors.
A) Interactions are large
B) Interactions are not large
A) Interactions are large
B) Interactions are not large
Unlock Deck
Unlock for access to all 48 flashcards in this deck.
Unlock Deck
k this deck
41
An agricultural scientist performs a 2-way ANOVA to determine the effects of three different soil mixtures on the sprouting time (in days) of three varieties of hybrid cucumber seeds. The following
MINITAB output presents the results. Can the mean effect of the soil mixture be interpreted? If so, interpret the main effect. Use the level Of significance.
A) Yes. Do not reject H0.
B) Yes. Reject H0.
C) No.
MINITAB output presents the results.
Can the mean effect of the soil mixture be interpreted? If so, interpret the main effect. Use the level Of significance. A) Yes. Do not reject H0.
B) Yes. Reject H0.
C) No.
Unlock Deck
Unlock for access to all 48 flashcards in this deck.
Unlock Deck
k this deck
42
The following table presents measurements of the tensile strength (in kilopascals) of asphalt-rubber
concrete beams for three levels of binder content and three levels of rubber content.
i). Can you reject the hypothesis of no interactions?
ii). Can the mean effect of the binder content be interpreted? If so, interpret the main effect. Use the level of significance.
iii). Can the mean effect of the rubber content be interpreted? If so, interpret the main effect. Use the level of significance.
concrete beams for three levels of binder content and three levels of rubber content.
i). Can you reject the hypothesis of no interactions?
ii). Can the mean effect of the binder content be interpreted? If so, interpret the main effect. Use the
level of significance.iii). Can the mean effect of the rubber content be interpreted? If so, interpret the main effect. Use the level of significance.
Unlock Deck
Unlock for access to all 48 flashcards in this deck.
Unlock Deck
k this deck
43
The following table presents measurements of the tensile strength (in kilopascals) of asphalt-rubber concrete beams for three levels of binder content and three levels of rubber content.
Can the mean effect of the rubber content be interpreted? If so, interpret the main effect. Use the a= level of significance.
A) Yes. Reject H0
B) No.
C) Yes. Do not reject H0
Can the mean effect of the rubber content be interpreted? If so, interpret the main effect. Use the a= level of significance.
A) Yes. Reject H0
B) No.
C) Yes. Do not reject H0
Unlock Deck
Unlock for access to all 48 flashcards in this deck.
Unlock Deck
k this deck
44
An agricultural scientist performs a 2-way ANOVA to determine the effects of three different soil
mixtures on the sprouting time (in days) of three varieties of hybrid cucumber seeds. The following
MINITAB output presents the results. i). Can you reject the hypothesis of no interactions?
ii). Can the mean effect of the soil mixture be interpreted? If so, interpret the main effect. Use the α = 0.01
level of significance.
iii). Can the mean effect of the hybrid variety be interpreted? If so, interpret the main effect. Use the α = 0.01
level of significance.
mixtures on the sprouting time (in days) of three varieties of hybrid cucumber seeds. The following
MINITAB output presents the results.
i). Can you reject the hypothesis of no interactions?ii). Can the mean effect of the soil mixture be interpreted? If so, interpret the main effect. Use the α = 0.01
level of significance.
iii). Can the mean effect of the hybrid variety be interpreted? If so, interpret the main effect. Use the α = 0.01
level of significance.
Unlock Deck
Unlock for access to all 48 flashcards in this deck.
Unlock Deck
k this deck
45
The following table presents measurements of the tensile strength (in kilopascals) of asphalt-rubber concrete beams for three levels of binder content and three levels of rubber content. Can you reject the hypothesis of no interactions?
A) Yes
B) No
Can you reject the hypothesis of no interactions?A) Yes
B) No
Unlock Deck
Unlock for access to all 48 flashcards in this deck.
Unlock Deck
k this deck
46
An agricultural scientist performs a 2-way ANOVA to determine the effects of three different soil mixtures on the sprouting time (in days) of three varieties of hybrid cucumber seeds. The following
MINITAB output presents the results. Can you reject the hypothesis of no interactions?
A) No
B) Yes
MINITAB output presents the results.
Can you reject the hypothesis of no interactions?A) No
B) Yes
Unlock Deck
Unlock for access to all 48 flashcards in this deck.
Unlock Deck
k this deck
47
The following table presents measurements of the tensile strength (in kilopascals) of asphalt-rubber concrete beams for three levels of binder content and three levels of rubber content. Can the mean effect of the binder content be interpreted? If so, interpret the main effect. Use the = 0.01 Level of significance.
A) No.
B) Yes. Reject. H0
C) Yes. Do not reject H0
Can the mean effect of the binder content be interpreted? If so, interpret the main effect. Use the = 0.01 Level of significance. A) No.
B) Yes. Reject. H0
C) Yes. Do not reject H0
Unlock Deck
Unlock for access to all 48 flashcards in this deck.
Unlock Deck
k this deck
48
An agricultural scientist performs a 2-way ANOVA to determine the effects of three different soil mixtures on the sprouting time (in days) of three varieties of hybrid cucumber seeds. The following
MINITAB output presents the results. Can the mean effect of the hybrid variety be interpreted? If so, interpret the main effect. Use the α = 0.05 Level of significance.
A) Yes. Do not reject H0.
B) Yes. Reject H0.
C) No.
MINITAB output presents the results.
Can the mean effect of the hybrid variety be interpreted? If so, interpret the main effect. Use the α = 0.05 Level of significance. A) Yes. Do not reject H0.
B) Yes. Reject H0.
C) No.
Unlock Deck
Unlock for access to all 48 flashcards in this deck.
Unlock Deck
k this deck
Unlock Deck
Unlock for access to all 48 flashcards in this deck.


