Deck 2: Graphical Summaries of Data
Full screen (f)
Question
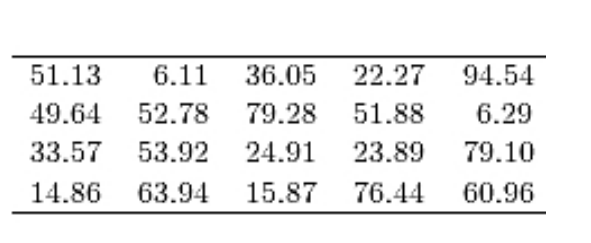
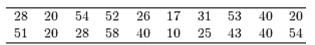
The following table presents the purchase totals (in dollars) of a random sample of gasoline purchases at a convenience store.
Construct a frequency distribution using a class width of 10, and using 0 as the lower class limit for the first
Class.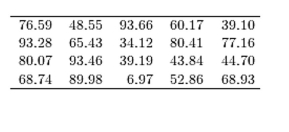
A)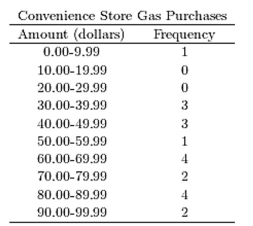
B)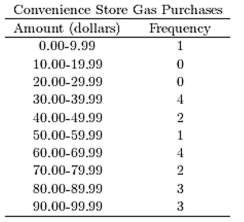
C)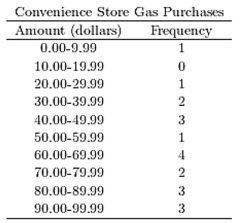
D)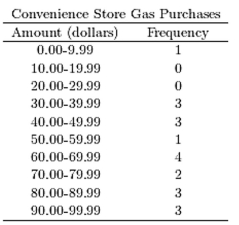
Construct a frequency distribution using a class width of 10, and using 0 as the lower class limit for the first
Class.
A)
B)
C)
D)
Question
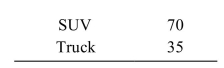
The following frequency distribution presents the weights in pounds (lb) of a sample of visitors to a health clinic. 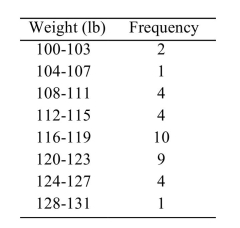 What is the class width?
A) 3
B) 5
C) 32
D) 4
What is the class width?A) 3
B) 5
C) 32
D) 4
Question
Classify the histogram as skewed to the left, skewed to the right, or approximately symmetric. 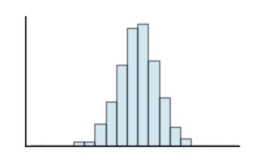
A) approximately symmetric
B) skewed to the left
C) skewed to the right
A) approximately symmetric
B) skewed to the left
C) skewed to the right
Question
The following table presents the purchase totals (in dollars) of a random sample of gasoline purchases at a convenience store.
Construct a frequency histogram using a class width of 10, and using 0 as the lower class limit for the first
Class.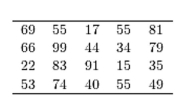
A)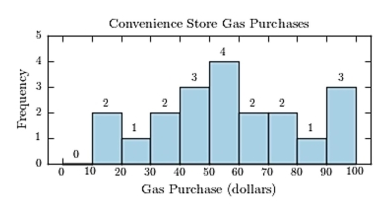
B)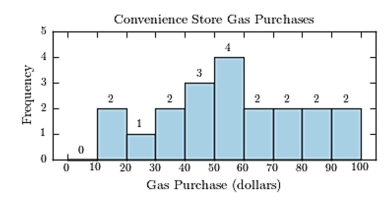
C)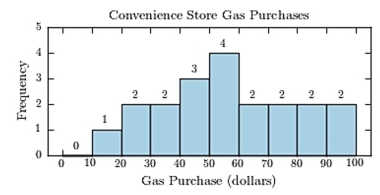
D)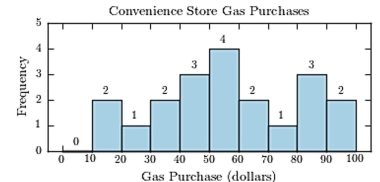
Construct a frequency histogram using a class width of 10, and using 0 as the lower class limit for the first
Class.
A)
B)
C)
D)
Question
The following frequency distribution presents the frequency of passenger vehicles that pass through a certain intersection from 8:00 AM to 9:00 AM on a particular day. 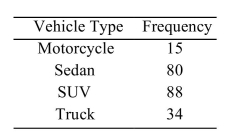 What is the relative frequency of the Motorcyle category?
A) 0.069
B) 15
C) 0.17
D) 15%
What is the relative frequency of the Motorcyle category?A) 0.069
B) 15
C) 0.17
D) 15%
Question
The following frequency distribution presents the frequency of passenger vehicles that pass through a certain intersection from 8:00 AM to 9:00 AM on a particular day. 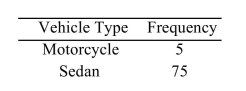
 Construct a frequency bar graph for the data.
A)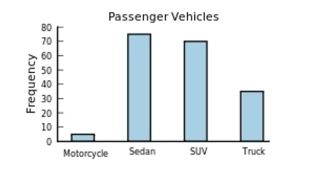
B)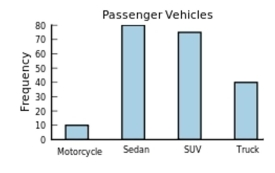
C)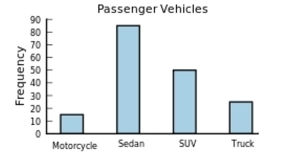
D)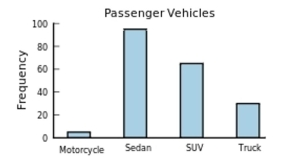
Construct a frequency bar graph for the data. A)
B)
C)
D)
Question
The following frequency distribution presents the weights in pounds (lb) of a sample of visitors to a health clinic. 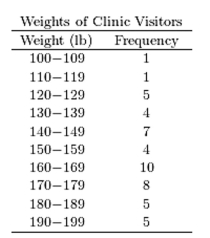 Construct a frequency histogram.
A)https://d2lvgg3v3hfg70.cloudfront.net/TB1209/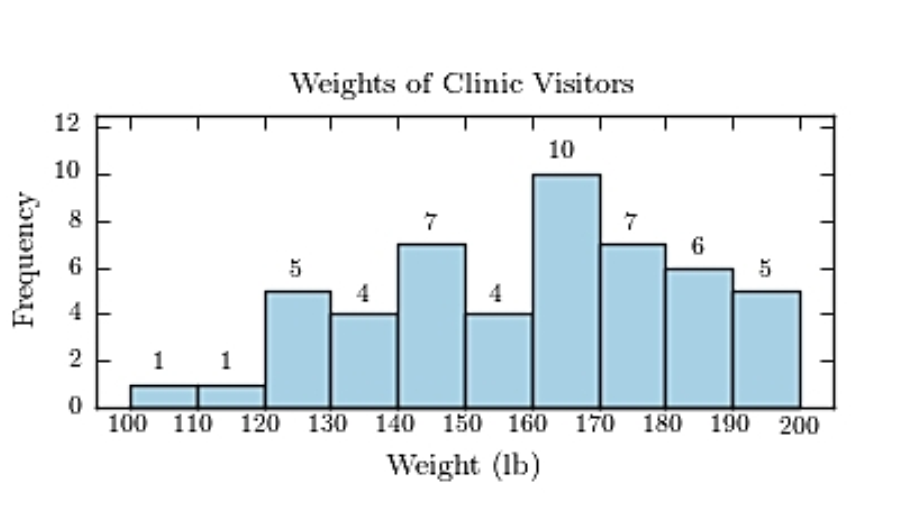 .
.
B)
C)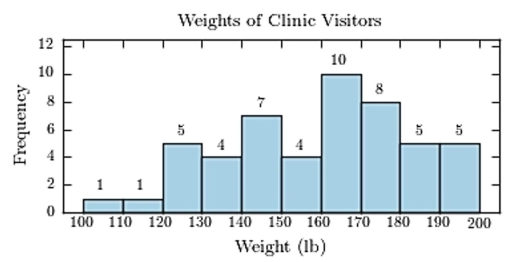
D)https://d2lvgg3v3hfg70.cloudfront.net/TB34225555/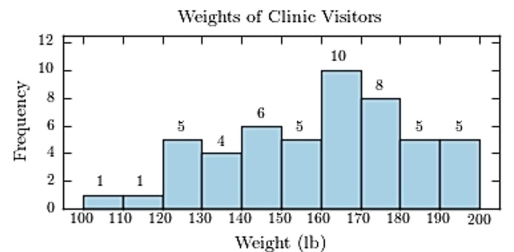 .
.
Construct a frequency histogram. A)https://d2lvgg3v3hfg70.cloudfront.net/TB1209/
.B)
C)
D)https://d2lvgg3v3hfg70.cloudfront.net/TB34225555/
. Question
One hundred students are shown an eight-digit number on a piece of cardboard for three seconds and are asked to then recite the number from memory. The process is repeated until the student accurately recites the
Entire number from memory. The following histogram presents the number of trials it took each student to
Memorize the number.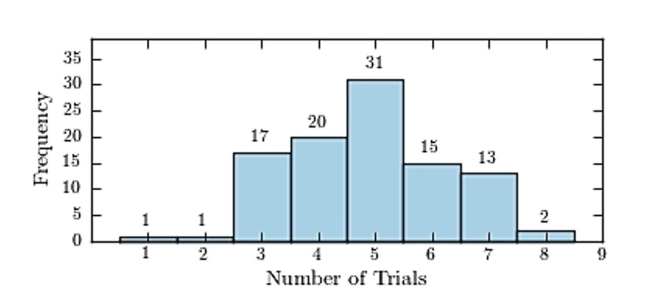 How many students memorized the number in three trials or less?
A) 19
B) 24
C) 81
D) 2
Entire number from memory. The following histogram presents the number of trials it took each student to
Memorize the number.
How many students memorized the number in three trials or less?A) 19
B) 24
C) 81
D) 2
Question
The following bar graph presents the average amount a certain family spent, in dollars, on various food categories in a recent year.
On which food category was the most money spent?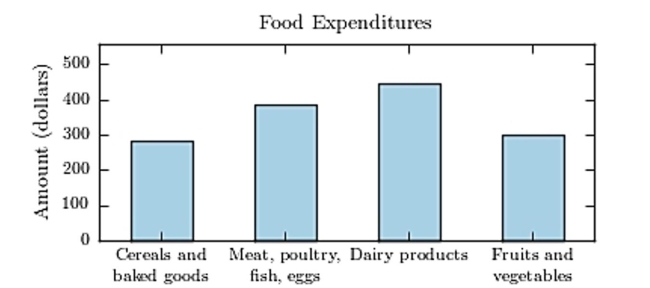
A) Meat poultry, fish, eggs
B) Fruits and vegetables
C) Dairy products
D) Cereals and baked goods
On which food category was the most money spent?
A) Meat poultry, fish, eggs
B) Fruits and vegetables
C) Dairy products
D) Cereals and baked goods
Question
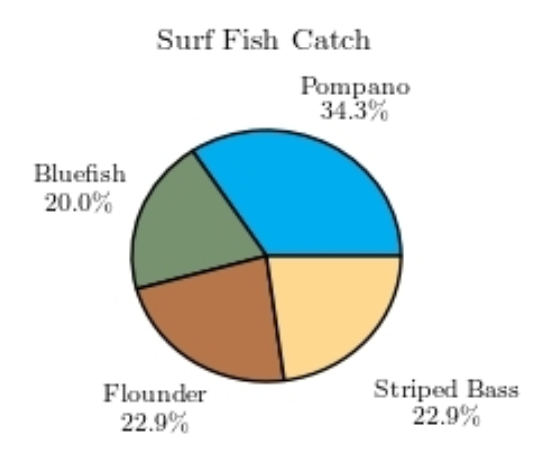
The following pie chart presents the percentages of fish caught in each of four ratings categories. Match this pie chart with its corresponding bar graph. 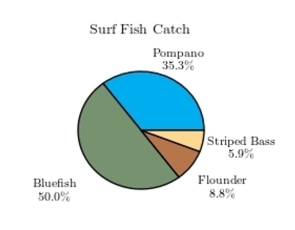
A)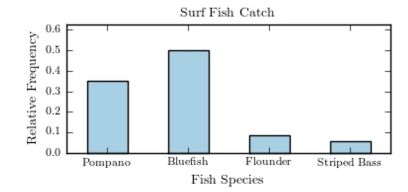
B)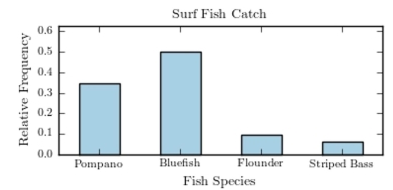
C)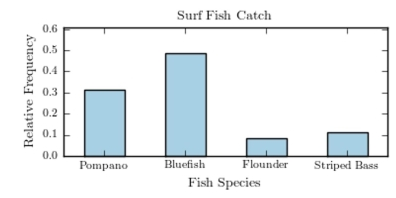
D)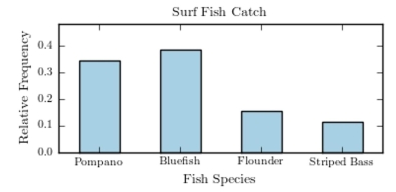
A)
B)
C)
D)
Question
The following table presents the purchase totals (in dollars) of a random sample of gasoline purchases at a convenience store.
Construct a relative frequency distribution using a class width of 10, and using 0 as the lower class limit for the
First class.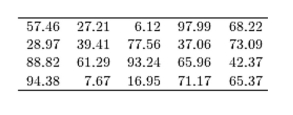
A)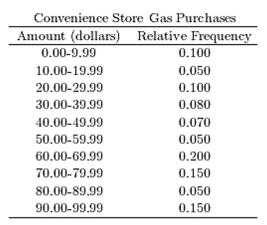
B)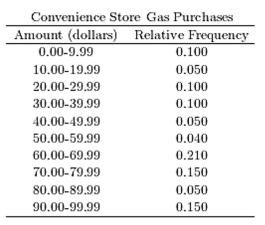
C)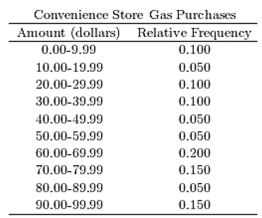
D)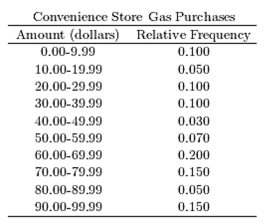
Construct a relative frequency distribution using a class width of 10, and using 0 as the lower class limit for the
First class.
A)
B)
C)
D)
Question
The following frequency distribution presents the frequency of passenger vehicles that pass through a certain intersection from 8:00 AM to 9:00 AM on a particular day. 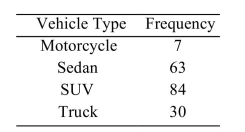 Construct a relative frequency distribution for the data.
A)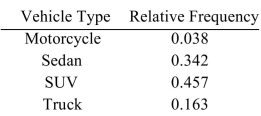
B)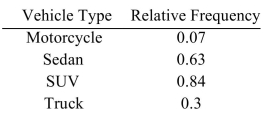
C)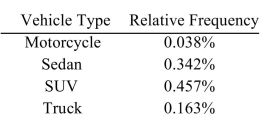
D)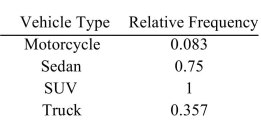
Construct a relative frequency distribution for the data. A)
B)
C)
D)
Question
The following frequency distribution presents the weights in pounds (lb) of a sample of visitors to a health clinic. 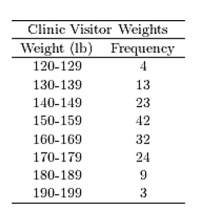 Construct a relative frequency histogram.
A)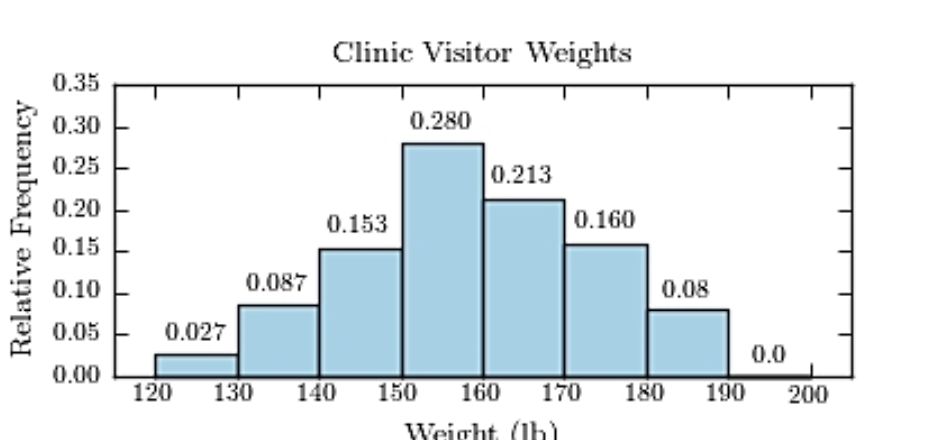
B)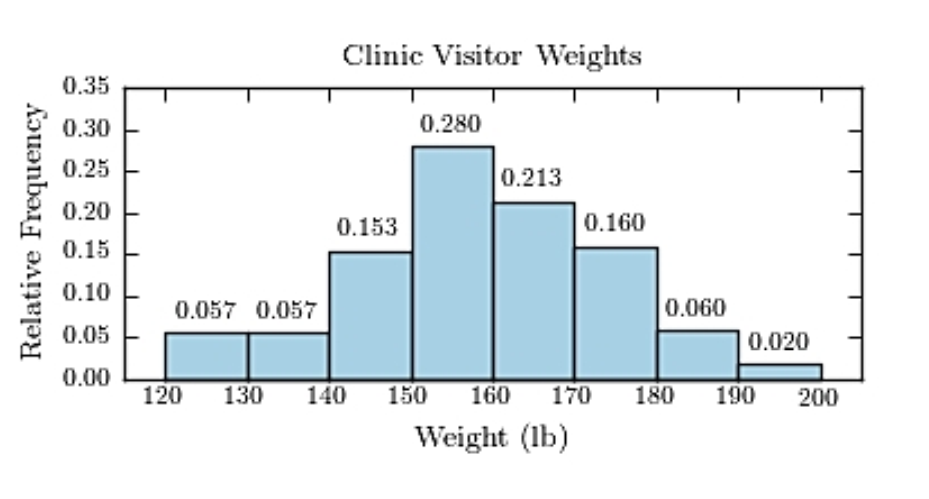
C)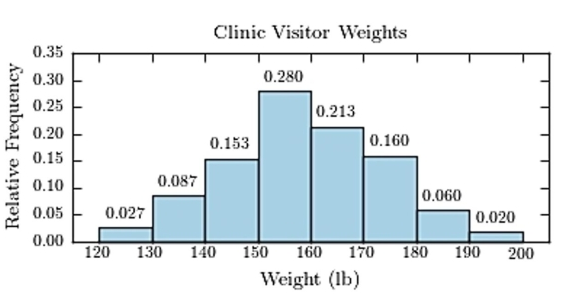
D)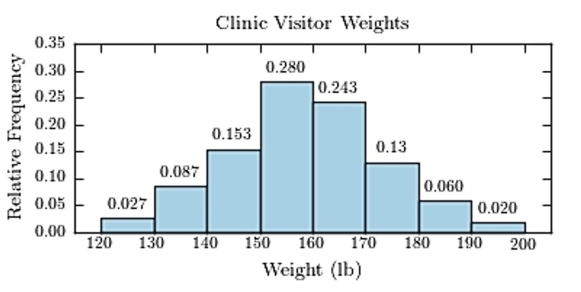
Construct a relative frequency histogram. A)
B)
C)
D)
Question
Classify the histogram as unimodal or bimodal. 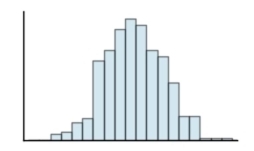
A) unimodal
B) bimodal
A) unimodal
B) bimodal
Question
The following pie chart presents the percentages of fish caught in each of four ratings categories. Match this pie chart with its corresponding Pareto chart.
A)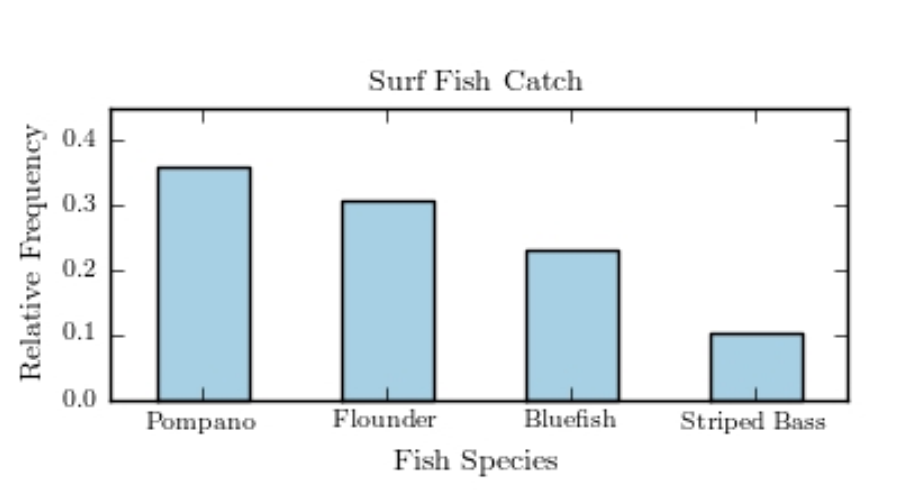
B)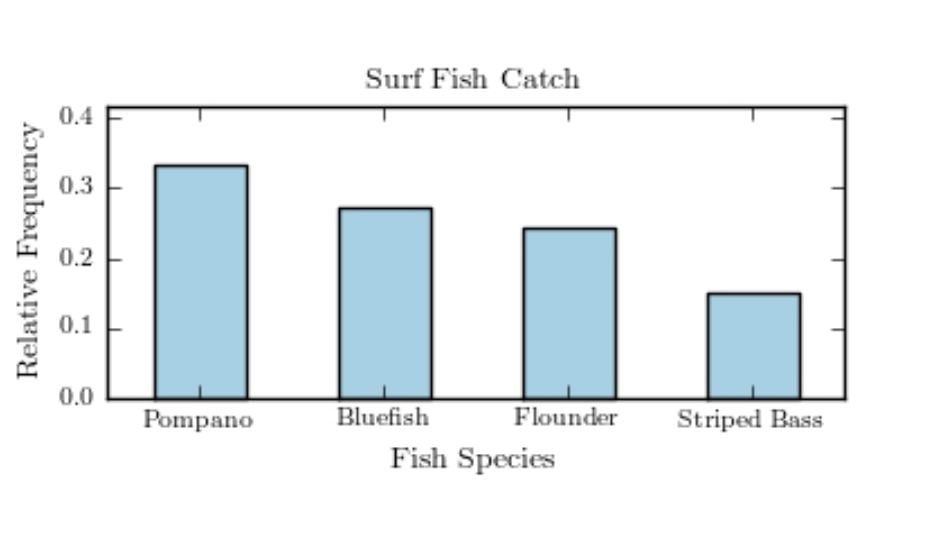
C)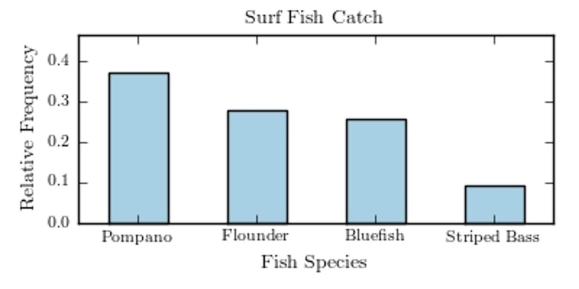
D)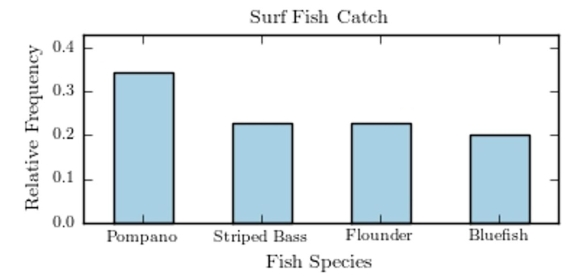
A)
B)
C)
D)
Question
The following frequency distribution presents the frequency of passenger vehicles that pass through a certain intersection from 8:00 AM to 9:00 AM on a particular day. 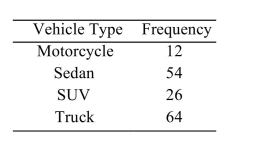 Construct a pie chart for the data.
A)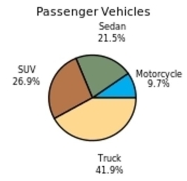
B)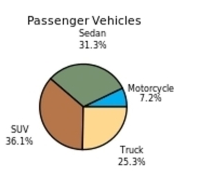
C)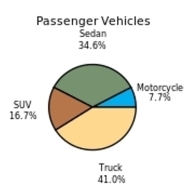
D)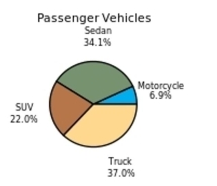
Construct a pie chart for the data. A)
B)
C)
D)
Question
The following frequency distribution presents the frequency of passenger vehicles that pass through a certain intersection from 8:00 AM to 9:00 AM on a particular day. 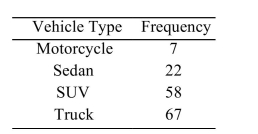 Construct a relative frequency Pareto chart for the data.
A)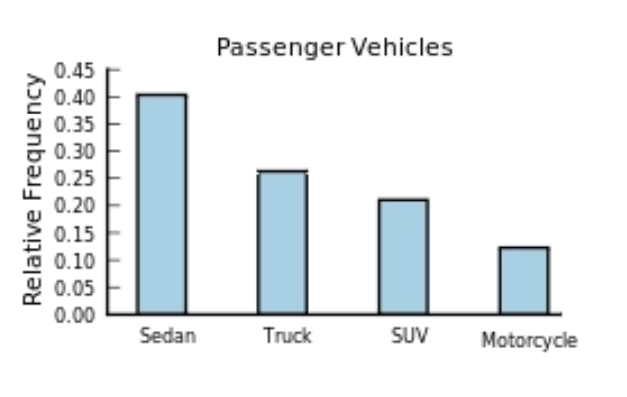
B)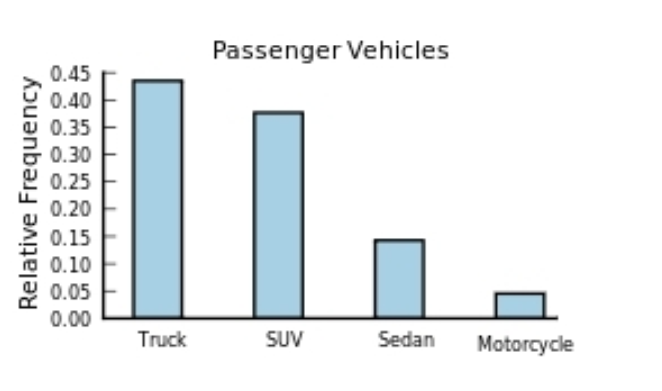
C)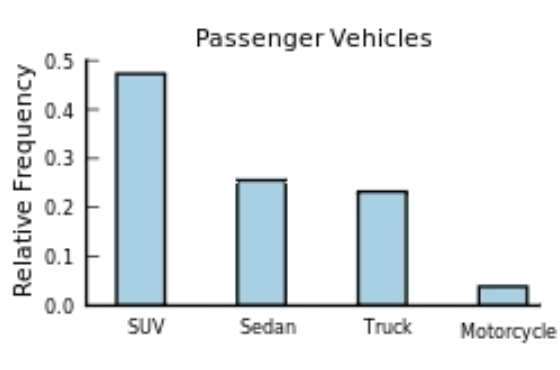
D)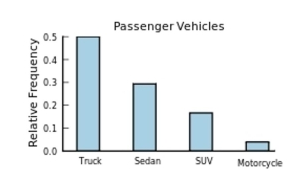
Construct a relative frequency Pareto chart for the data. A)
B)
C)
D)
Question
The following table presents the purchase totals (in dollars) of a random sample of gasoline purchases at a convenience store.
Construct a relative frequency histogram using a class width of 10, and using 0 as the lower class limit for the
First class.
A)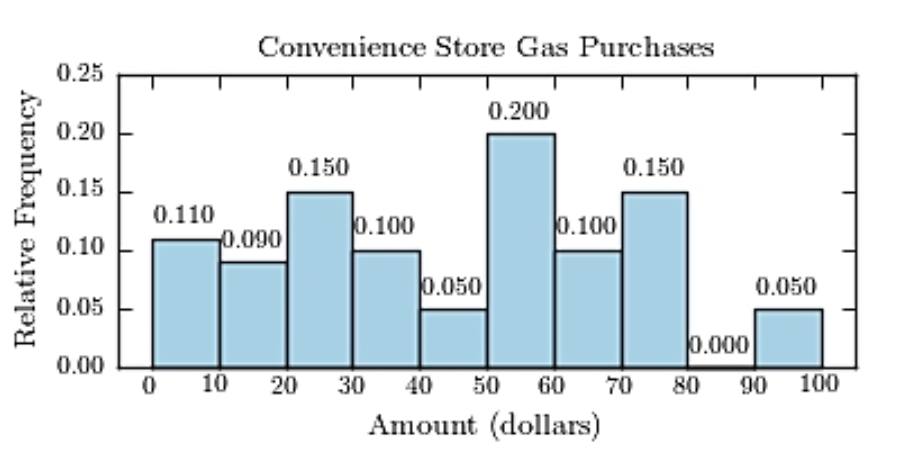
B)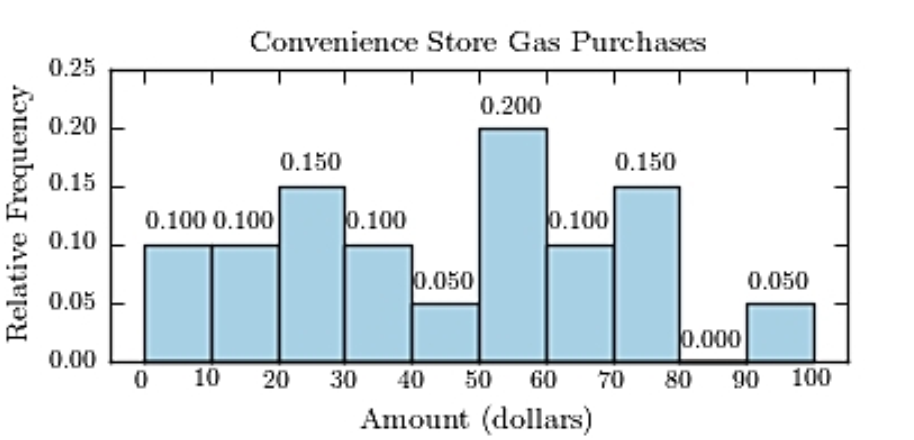
C)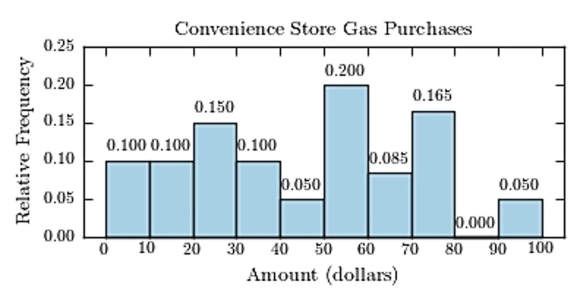
D)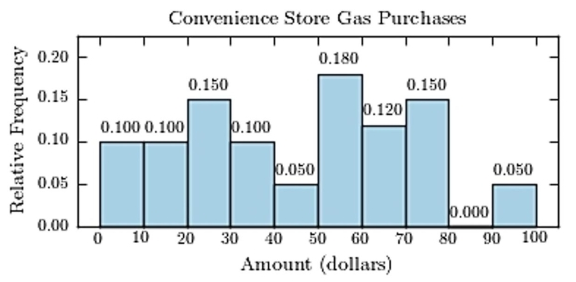
Construct a relative frequency histogram using a class width of 10, and using 0 as the lower class limit for the
First class.
A)
B)
C)
D)
Question
Thirty households were surveyed for the number of televisions in each home. Following are the results. 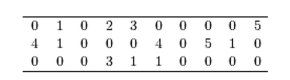 Construct a frequency histogram.
A)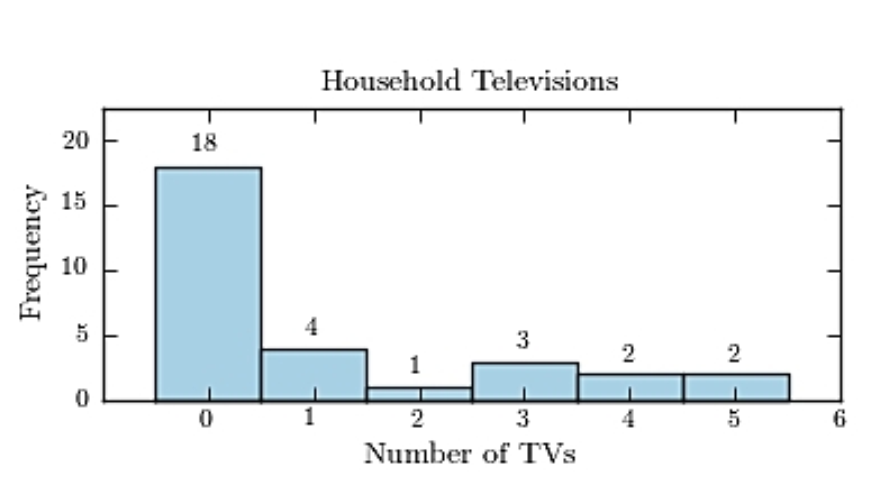
B)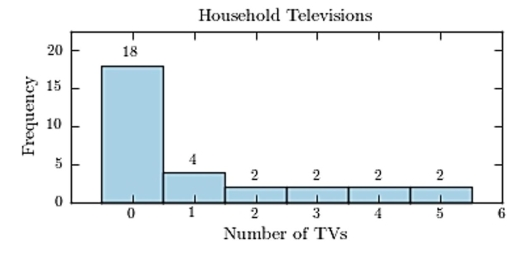
C)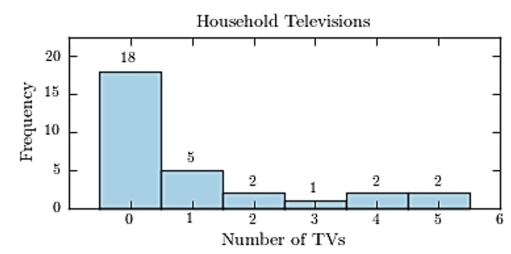
D)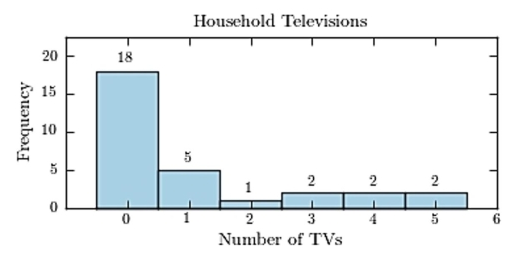
Construct a frequency histogram. A)
B)
C)
D)
Question
Following is a pie chart that presents the percentages spent by a certain household on its five largest annual expenditures. What percentage of the money spent was spent on food, housing, and utilities? 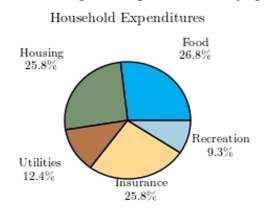
A) 52.6%
B) 65%
C) 61.9%
D) 50%
A) 52.6%
B) 65%
C) 61.9%
D) 50%
Question
The amounts 5 and 2 are compared. Which of the following graphical displays are the least misleading?
A)
B)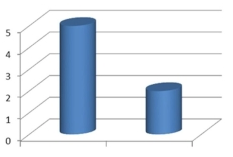
C)
D)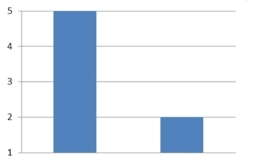
A)
B)
C)
D)
Question
A sample of 200 high school students were asked how many hours per week they spend watching television. The following frequency distribution presents the results. 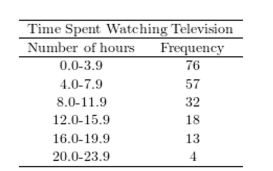 Construct a relative frequency ogive for the frequency distribution.
A)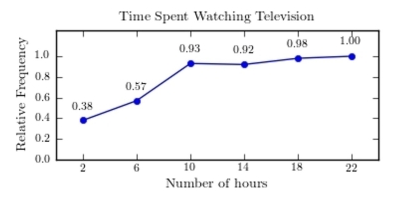
B)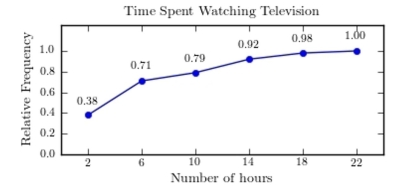
C)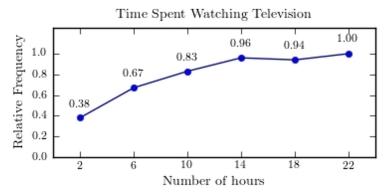
D)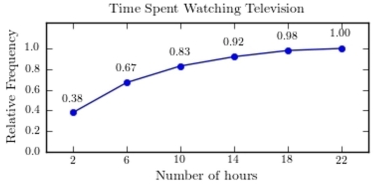
Construct a relative frequency ogive for the frequency distribution. A)
B)
C)
D)
Question
Following are the numbers of Dean's List students in a random sample of 20 university courses. Construct a dotplot for these data. 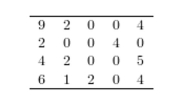
A)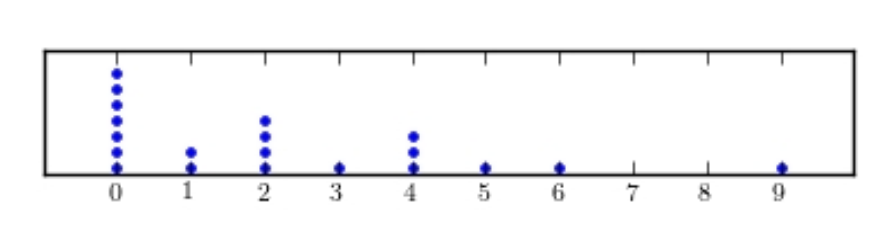
B)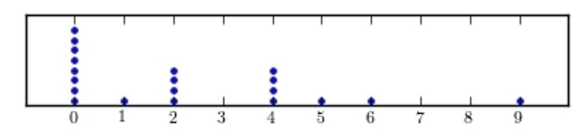
C)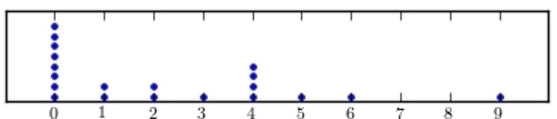
D)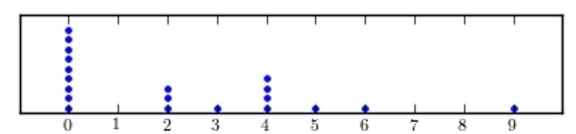
A)
B)
C)
D)
Question
Construct a stem-and-leaf plot for the following data, in which the leaf represents the tenths place. 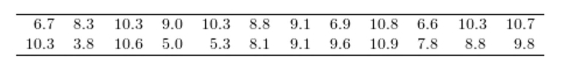
A)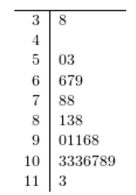
B)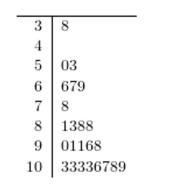
C)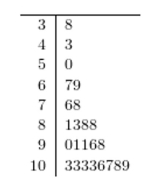
D)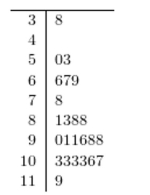
A)
B)
C)
D)
Question
Gravity on Mars: The gravity on Earth is around 2/3 's stronger than the gravity on Mars. Which of the following graphics compare the gravity differences more accurately, and why?
A)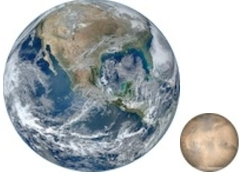
B)
A)
B)
Question
Thirty households were surveyed for the number of televisions in each home. Following are the results. 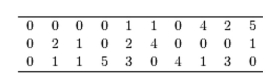 Construct a relative frequency histogram.
A)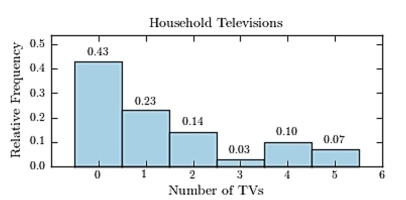
B)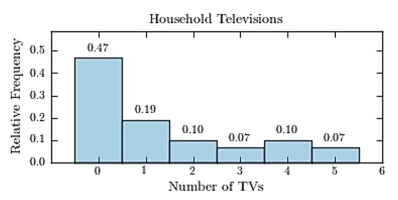
C)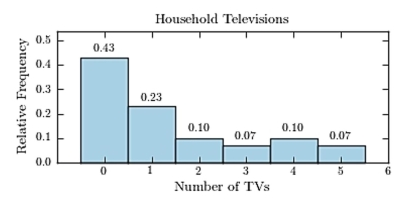
D)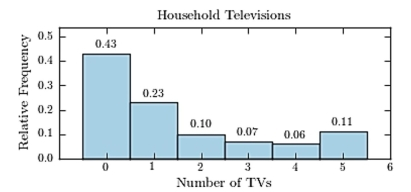
Construct a relative frequency histogram. A)
B)
C)
D)
Question
Construct a dotplot for the following data. 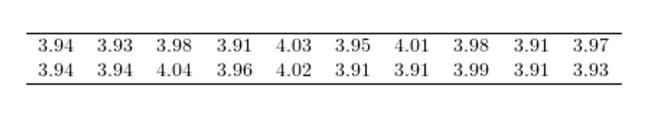
A)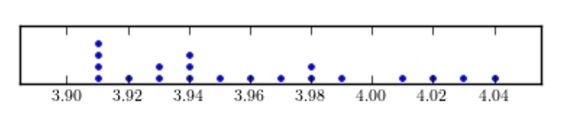
B)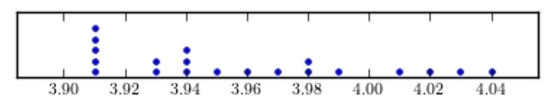
C)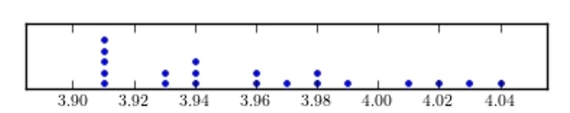
D)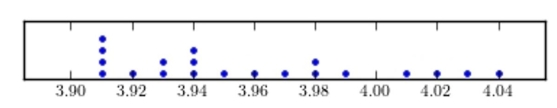
A)
B)
C)
D)
Question
A sample of 200 high school students were asked how many hours per week they spend watching television. The following frequency distribution presents the results. 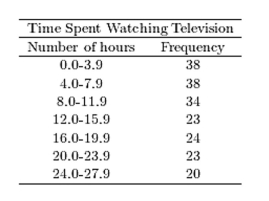 Construct a frequency ogive for the frequency distribution.
A)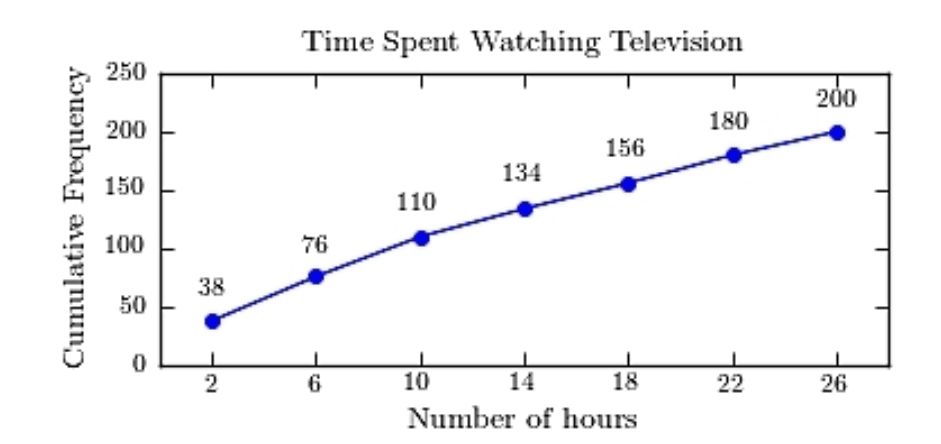
B)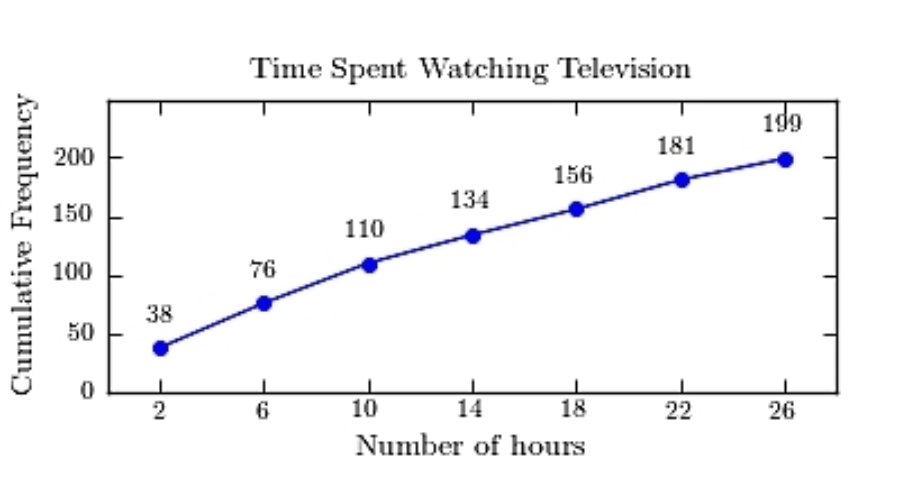
C)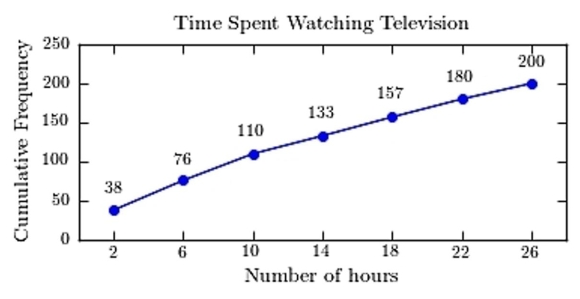
D)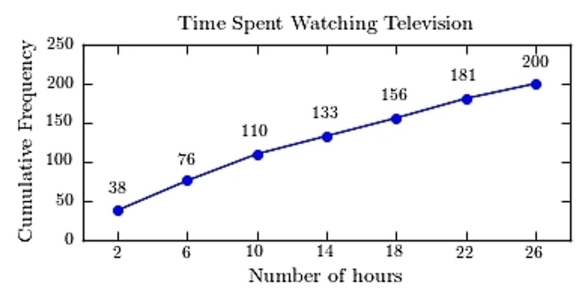
Construct a frequency ogive for the frequency distribution. A)
B)
C)
D)
Question
The following time-series plot presents the population growth (in percent) of a suburb of Atlanta, Georgia for each of the years 1990 through 2009. Estimate the rate of growth in 1,999. 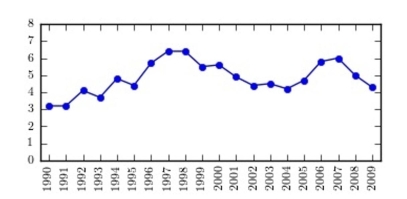
A) 4.9%
B) 4.6%
C) 5.5%
D) 5.2%
A) 4.9%
B) 4.6%
C) 5.5%
D) 5.2%
Question
Helium prices: The cost of grade A Helium gas in 2003 was around $60/Mcf. Five years later it reached around $115/Mcf. Which of the following graphs accurately represents the magnitude of the
Increase? Which one exaggerates it?
A)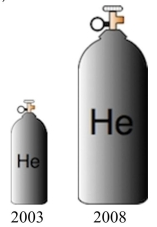
B)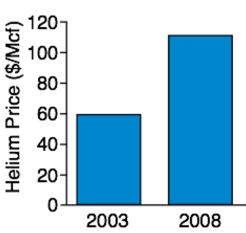
Increase? Which one exaggerates it?
A)
B)
Question
A sample of 200 high school students were asked how many hours per week they spend watching television. The following frequency distribution presents the results. 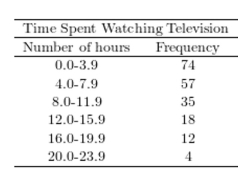 Construct a relative frequency polygon for the frequency distribution.
A)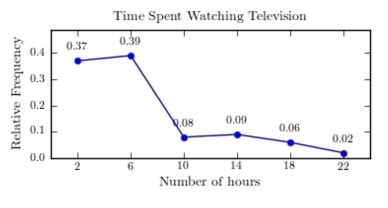
B)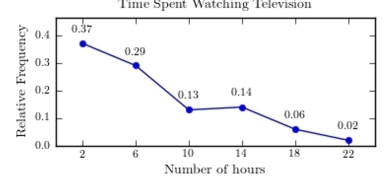
C)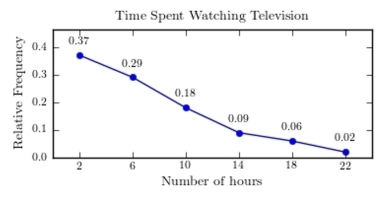
D)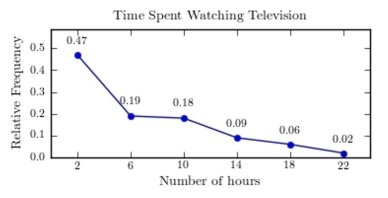
Construct a relative frequency polygon for the frequency distribution. A)
B)
C)
D)
Question
A sample of 200 high school students were asked how many hours per week they spend watching television. The following frequency distribution presents the results. 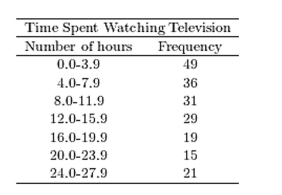 Construct a frequency polygon for the frequency distribution.
A)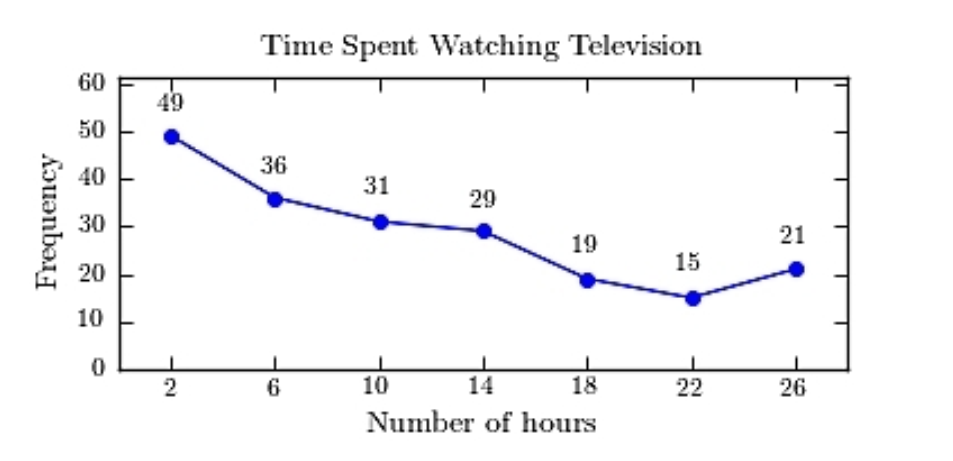
B)https://d2lvgg3v3hfg70.cloudfront.net/TB1209/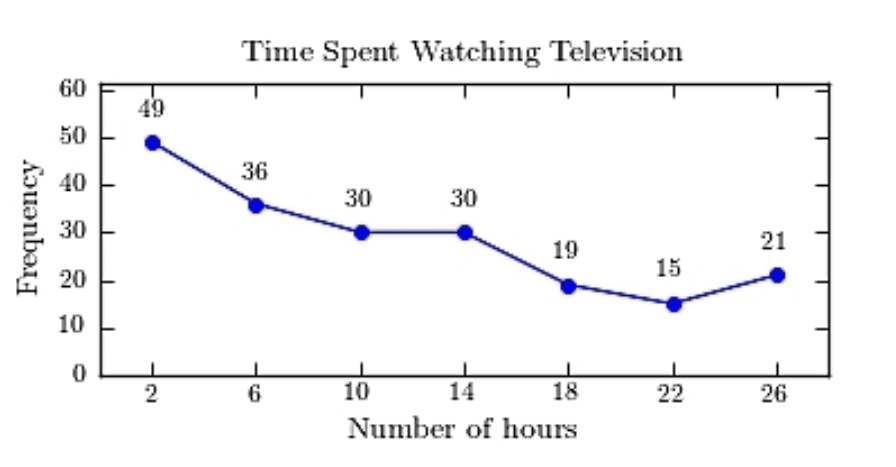 .
.
C)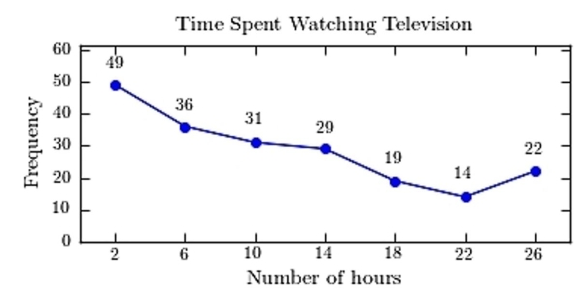
D)https://d2lvgg3v3hfg70.cloudfront.net/TB34225555/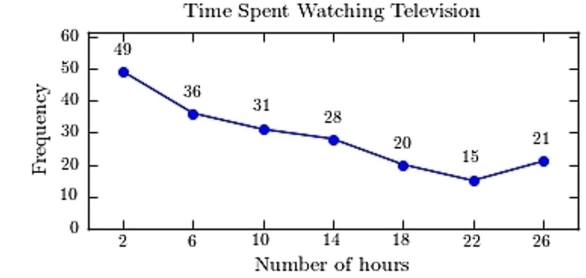 .
.
Construct a frequency polygon for the frequency distribution. A)
B)https://d2lvgg3v3hfg70.cloudfront.net/TB1209/
.C)
D)https://d2lvgg3v3hfg70.cloudfront.net/TB34225555/
. Question
Toy sales: The following graph presents the percent market share for the US Toy Retail Sales between brick and mortar toy sales and online sales for the years 2011-2015. Does the graph present an accurate picture of the differences in revenue from these two sources? Or is it misleading?
Explain.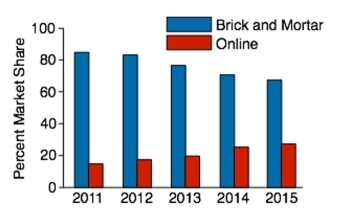
Explain.
Question
Chocolate or vanilla: The following bar graph shows the number of chocolate and vanilla ice cream cones sold during the annual county fair for the years 2013 - 2017. Does the graph present an accurate picture of the difference between chocolate and vanilla cones sold? Or is it misleading?
Explain.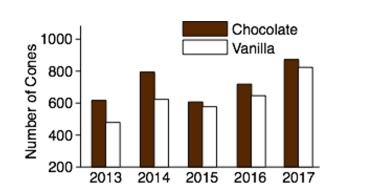
Explain.
Question
Construct a dotplot for the following data. 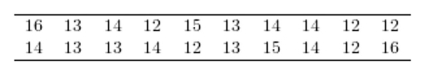
A)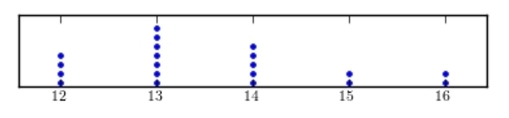
B)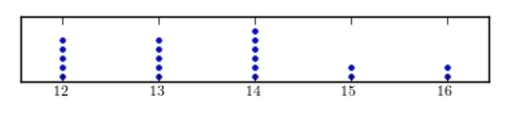
C)
D)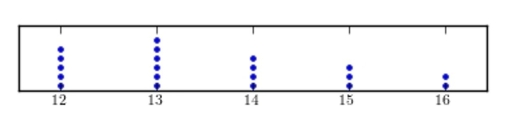
A)
B)
C)
D)
Question
The following table presents the rate of population growth of a suburb of Atlanta, Georgia for each of the years 1990 through 2009. Construct a time-series plot of the growth rate. 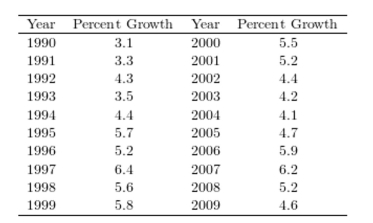
A)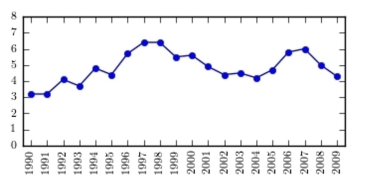
B)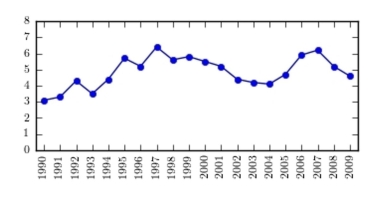
C)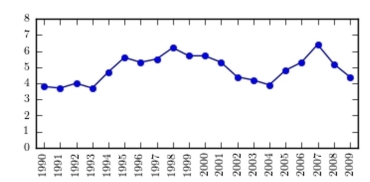
D)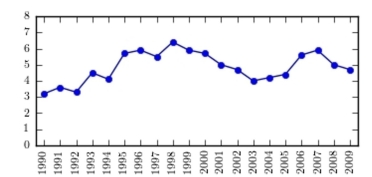
A)
B)
C)
D)
Question
The amounts 3 and 4 are compared. Which of the following graphical displays are the least misleading?
A)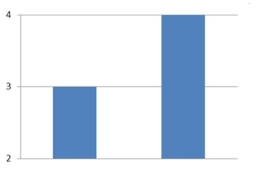
B)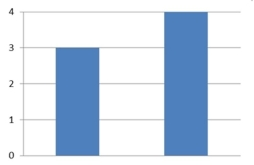
C)
D)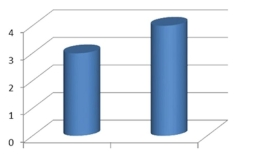
A)
B)
C)
D)
Question
The amounts 3 and 2 are compared. Which of the following graphical displays are the least misleading?
A)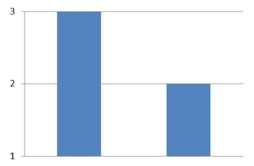
B)
C)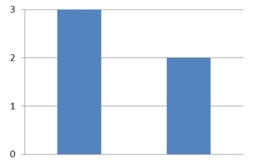
D)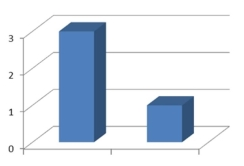
A)
B)
C)
D)
Question
Construct a stem-and-leaf plot for the following data.
A)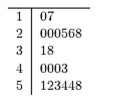
B)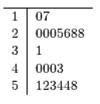
C)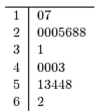
D)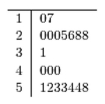
A)
B)
C)
D)
Question
The following time-series plot presents the population growth (in percent) of a suburb of Atlanta, Georgia for each of the years 1990 through 2009. Estimate the amount by which the rate of growth
Changed from 1,995 to 2,004.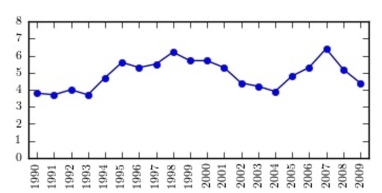
A) about -1.3 percentage points
B) about -2.9 percentage points
C) about -1.0 percentage points
D) about -1.9 percentage points
Changed from 1,995 to 2,004.
A) about -1.3 percentage points
B) about -2.9 percentage points
C) about -1.0 percentage points
D) about -1.9 percentage points

Unlock Deck
Sign up to unlock the cards in this deck!
Unlock Deck
Unlock Deck
1/40
Play
Full screen (f)
Deck 2: Graphical Summaries of Data
1
The following table presents the purchase totals (in dollars) of a random sample of gasoline purchases at a convenience store.
Construct a frequency distribution using a class width of 10, and using 0 as the lower class limit for the first
Class.
A)
B)
C)
D)
Construct a frequency distribution using a class width of 10, and using 0 as the lower class limit for the first
Class.
A)
B)
C)
D)
2
The following frequency distribution presents the weights in pounds (lb) of a sample of visitors to a health clinic. What is the class width?
A) 3
B) 5
C) 32
D) 4
What is the class width?A) 3
B) 5
C) 32
D) 4
4
3
Classify the histogram as skewed to the left, skewed to the right, or approximately symmetric.
A) approximately symmetric
B) skewed to the left
C) skewed to the right
A) approximately symmetric
B) skewed to the left
C) skewed to the right
approximately symmetric
4
The following table presents the purchase totals (in dollars) of a random sample of gasoline purchases at a convenience store.
Construct a frequency histogram using a class width of 10, and using 0 as the lower class limit for the first
Class.
A)
B)
C)
D)
Construct a frequency histogram using a class width of 10, and using 0 as the lower class limit for the first
Class.
A)
B)
C)
D)
Unlock Deck
Unlock for access to all 40 flashcards in this deck.
Unlock Deck
k this deck
5
The following frequency distribution presents the frequency of passenger vehicles that pass through a certain intersection from 8:00 AM to 9:00 AM on a particular day. What is the relative frequency of the Motorcyle category?
A) 0.069
B) 15
C) 0.17
D) 15%
What is the relative frequency of the Motorcyle category?A) 0.069
B) 15
C) 0.17
D) 15%
Unlock Deck
Unlock for access to all 40 flashcards in this deck.
Unlock Deck
k this deck
6
The following frequency distribution presents the frequency of passenger vehicles that pass through a certain intersection from 8:00 AM to 9:00 AM on a particular day. Construct a frequency bar graph for the data.
A)
B)
C)
D)
Construct a frequency bar graph for the data. A)
B)
C)
D)
Unlock Deck
Unlock for access to all 40 flashcards in this deck.
Unlock Deck
k this deck
7
The following frequency distribution presents the weights in pounds (lb) of a sample of visitors to a health clinic. Construct a frequency histogram.
A)https://d2lvgg3v3hfg70.cloudfront.net/TB1209/.
B)
C)
D)https://d2lvgg3v3hfg70.cloudfront.net/TB34225555/.
Construct a frequency histogram. A)https://d2lvgg3v3hfg70.cloudfront.net/TB1209/
.B)
C)
D)https://d2lvgg3v3hfg70.cloudfront.net/TB34225555/
. Unlock Deck
Unlock for access to all 40 flashcards in this deck.
Unlock Deck
k this deck
8
One hundred students are shown an eight-digit number on a piece of cardboard for three seconds and are asked to then recite the number from memory. The process is repeated until the student accurately recites the
Entire number from memory. The following histogram presents the number of trials it took each student to
Memorize the number. How many students memorized the number in three trials or less?
A) 19
B) 24
C) 81
D) 2
Entire number from memory. The following histogram presents the number of trials it took each student to
Memorize the number.
How many students memorized the number in three trials or less?A) 19
B) 24
C) 81
D) 2
Unlock Deck
Unlock for access to all 40 flashcards in this deck.
Unlock Deck
k this deck
9
The following bar graph presents the average amount a certain family spent, in dollars, on various food categories in a recent year.
On which food category was the most money spent?
A) Meat poultry, fish, eggs
B) Fruits and vegetables
C) Dairy products
D) Cereals and baked goods
On which food category was the most money spent?
A) Meat poultry, fish, eggs
B) Fruits and vegetables
C) Dairy products
D) Cereals and baked goods
Unlock Deck
Unlock for access to all 40 flashcards in this deck.
Unlock Deck
k this deck
10
The following pie chart presents the percentages of fish caught in each of four ratings categories. Match this pie chart with its corresponding bar graph.
A)
B)
C)
D)
A)
B)
C)
D)
Unlock Deck
Unlock for access to all 40 flashcards in this deck.
Unlock Deck
k this deck
11
The following table presents the purchase totals (in dollars) of a random sample of gasoline purchases at a convenience store.
Construct a relative frequency distribution using a class width of 10, and using 0 as the lower class limit for the
First class.
A)
B)
C)
D)
Construct a relative frequency distribution using a class width of 10, and using 0 as the lower class limit for the
First class.
A)
B)
C)
D)
Unlock Deck
Unlock for access to all 40 flashcards in this deck.
Unlock Deck
k this deck
12
The following frequency distribution presents the frequency of passenger vehicles that pass through a certain intersection from 8:00 AM to 9:00 AM on a particular day. Construct a relative frequency distribution for the data.
A)
B)
C)
D)
Construct a relative frequency distribution for the data. A)
B)
C)
D)
Unlock Deck
Unlock for access to all 40 flashcards in this deck.
Unlock Deck
k this deck
13
The following frequency distribution presents the weights in pounds (lb) of a sample of visitors to a health clinic. Construct a relative frequency histogram.
A)
B)
C)
D)
Construct a relative frequency histogram. A)
B)
C)
D)
Unlock Deck
Unlock for access to all 40 flashcards in this deck.
Unlock Deck
k this deck
14
Classify the histogram as unimodal or bimodal.
A) unimodal
B) bimodal
A) unimodal
B) bimodal
Unlock Deck
Unlock for access to all 40 flashcards in this deck.
Unlock Deck
k this deck
15
The following pie chart presents the percentages of fish caught in each of four ratings categories. Match this pie chart with its corresponding Pareto chart.
A)
B)
C)
D)
A)
B)
C)
D)
Unlock Deck
Unlock for access to all 40 flashcards in this deck.
Unlock Deck
k this deck
16
The following frequency distribution presents the frequency of passenger vehicles that pass through a certain intersection from 8:00 AM to 9:00 AM on a particular day. Construct a pie chart for the data.
A)
B)
C)
D)
Construct a pie chart for the data. A)
B)
C)
D)
Unlock Deck
Unlock for access to all 40 flashcards in this deck.
Unlock Deck
k this deck
17
The following frequency distribution presents the frequency of passenger vehicles that pass through a certain intersection from 8:00 AM to 9:00 AM on a particular day. Construct a relative frequency Pareto chart for the data.
A)
B)
C)
D)
Construct a relative frequency Pareto chart for the data. A)
B)
C)
D)
Unlock Deck
Unlock for access to all 40 flashcards in this deck.
Unlock Deck
k this deck
18
The following table presents the purchase totals (in dollars) of a random sample of gasoline purchases at a convenience store.
Construct a relative frequency histogram using a class width of 10, and using 0 as the lower class limit for the
First class.
A)
B)
C)
D)
Construct a relative frequency histogram using a class width of 10, and using 0 as the lower class limit for the
First class.
A)
B)
C)
D)
Unlock Deck
Unlock for access to all 40 flashcards in this deck.
Unlock Deck
k this deck
19
Thirty households were surveyed for the number of televisions in each home. Following are the results. Construct a frequency histogram.
A)
B)
C)
D)
Construct a frequency histogram. A)
B)
C)
D)
Unlock Deck
Unlock for access to all 40 flashcards in this deck.
Unlock Deck
k this deck
20
Following is a pie chart that presents the percentages spent by a certain household on its five largest annual expenditures. What percentage of the money spent was spent on food, housing, and utilities?
A) 52.6%
B) 65%
C) 61.9%
D) 50%
A) 52.6%
B) 65%
C) 61.9%
D) 50%
Unlock Deck
Unlock for access to all 40 flashcards in this deck.
Unlock Deck
k this deck
21
The amounts 5 and 2 are compared. Which of the following graphical displays are the least misleading?
A)
B)
C)
D)
A)
B)
C)
D)
Unlock Deck
Unlock for access to all 40 flashcards in this deck.
Unlock Deck
k this deck
22
A sample of 200 high school students were asked how many hours per week they spend watching television. The following frequency distribution presents the results. Construct a relative frequency ogive for the frequency distribution.
A)
B)
C)
D)
Construct a relative frequency ogive for the frequency distribution. A)
B)
C)
D)
Unlock Deck
Unlock for access to all 40 flashcards in this deck.
Unlock Deck
k this deck
23
Following are the numbers of Dean's List students in a random sample of 20 university courses. Construct a dotplot for these data.
A)
B)
C)
D)
A)
B)
C)
D)
Unlock Deck
Unlock for access to all 40 flashcards in this deck.
Unlock Deck
k this deck
24
Construct a stem-and-leaf plot for the following data, in which the leaf represents the tenths place.
A)
B)
C)
D)
A)
B)
C)
D)
Unlock Deck
Unlock for access to all 40 flashcards in this deck.
Unlock Deck
k this deck
25
Gravity on Mars: The gravity on Earth is around 2/3 's stronger than the gravity on Mars. Which of the following graphics compare the gravity differences more accurately, and why?
A)
B)
A)
B)
Unlock Deck
Unlock for access to all 40 flashcards in this deck.
Unlock Deck
k this deck
26
Thirty households were surveyed for the number of televisions in each home. Following are the results. Construct a relative frequency histogram.
A)
B)
C)
D)
Construct a relative frequency histogram. A)
B)
C)
D)
Unlock Deck
Unlock for access to all 40 flashcards in this deck.
Unlock Deck
k this deck
27
Construct a dotplot for the following data.
A)
B)
C)
D)
A)
B)
C)
D)
Unlock Deck
Unlock for access to all 40 flashcards in this deck.
Unlock Deck
k this deck
28
A sample of 200 high school students were asked how many hours per week they spend watching television. The following frequency distribution presents the results. Construct a frequency ogive for the frequency distribution.
A)
B)
C)
D)
Construct a frequency ogive for the frequency distribution. A)
B)
C)
D)
Unlock Deck
Unlock for access to all 40 flashcards in this deck.
Unlock Deck
k this deck
29
The following time-series plot presents the population growth (in percent) of a suburb of Atlanta, Georgia for each of the years 1990 through 2009. Estimate the rate of growth in 1,999.
A) 4.9%
B) 4.6%
C) 5.5%
D) 5.2%
A) 4.9%
B) 4.6%
C) 5.5%
D) 5.2%
Unlock Deck
Unlock for access to all 40 flashcards in this deck.
Unlock Deck
k this deck
30
Helium prices: The cost of grade A Helium gas in 2003 was around $60/Mcf. Five years later it reached around $115/Mcf. Which of the following graphs accurately represents the magnitude of the
Increase? Which one exaggerates it?
A)
B)
Increase? Which one exaggerates it?
A)
B)
Unlock Deck
Unlock for access to all 40 flashcards in this deck.
Unlock Deck
k this deck
31
A sample of 200 high school students were asked how many hours per week they spend watching television. The following frequency distribution presents the results. Construct a relative frequency polygon for the frequency distribution.
A)
B)
C)
D)
Construct a relative frequency polygon for the frequency distribution. A)
B)
C)
D)
Unlock Deck
Unlock for access to all 40 flashcards in this deck.
Unlock Deck
k this deck
32
A sample of 200 high school students were asked how many hours per week they spend watching television. The following frequency distribution presents the results. Construct a frequency polygon for the frequency distribution.
A)
B)https://d2lvgg3v3hfg70.cloudfront.net/TB1209/.
C)
D)https://d2lvgg3v3hfg70.cloudfront.net/TB34225555/.
Construct a frequency polygon for the frequency distribution. A)
B)https://d2lvgg3v3hfg70.cloudfront.net/TB1209/
.C)
D)https://d2lvgg3v3hfg70.cloudfront.net/TB34225555/
. Unlock Deck
Unlock for access to all 40 flashcards in this deck.
Unlock Deck
k this deck
33
Toy sales: The following graph presents the percent market share for the US Toy Retail Sales between brick and mortar toy sales and online sales for the years 2011-2015. Does the graph present an accurate picture of the differences in revenue from these two sources? Or is it misleading?
Explain.
Explain.
Unlock Deck
Unlock for access to all 40 flashcards in this deck.
Unlock Deck
k this deck
34
Chocolate or vanilla: The following bar graph shows the number of chocolate and vanilla ice cream cones sold during the annual county fair for the years 2013 - 2017. Does the graph present an accurate picture of the difference between chocolate and vanilla cones sold? Or is it misleading?
Explain.
Explain.
Unlock Deck
Unlock for access to all 40 flashcards in this deck.
Unlock Deck
k this deck
35
Construct a dotplot for the following data.
A)
B)
C)
D)
A)
B)
C)
D)
Unlock Deck
Unlock for access to all 40 flashcards in this deck.
Unlock Deck
k this deck
36
The following table presents the rate of population growth of a suburb of Atlanta, Georgia for each of the years 1990 through 2009. Construct a time-series plot of the growth rate.
A)
B)
C)
D)
A)
B)
C)
D)
Unlock Deck
Unlock for access to all 40 flashcards in this deck.
Unlock Deck
k this deck
37
The amounts 3 and 4 are compared. Which of the following graphical displays are the least misleading?
A)
B)
C)
D)
A)
B)
C)
D)
Unlock Deck
Unlock for access to all 40 flashcards in this deck.
Unlock Deck
k this deck
38
The amounts 3 and 2 are compared. Which of the following graphical displays are the least misleading?
A)
B)
C)
D)
A)
B)
C)
D)
Unlock Deck
Unlock for access to all 40 flashcards in this deck.
Unlock Deck
k this deck
39
Construct a stem-and-leaf plot for the following data.
A)
B)
C)
D)
A)
B)
C)
D)
Unlock Deck
Unlock for access to all 40 flashcards in this deck.
Unlock Deck
k this deck
40
The following time-series plot presents the population growth (in percent) of a suburb of Atlanta, Georgia for each of the years 1990 through 2009. Estimate the amount by which the rate of growth
Changed from 1,995 to 2,004.
A) about -1.3 percentage points
B) about -2.9 percentage points
C) about -1.0 percentage points
D) about -1.9 percentage points
Changed from 1,995 to 2,004.
A) about -1.3 percentage points
B) about -2.9 percentage points
C) about -1.0 percentage points
D) about -1.9 percentage points
Unlock Deck
Unlock for access to all 40 flashcards in this deck.
Unlock Deck
k this deck
Unlock Deck
Unlock for access to all 40 flashcards in this deck.


