Deck 15: Nonparametric Statistics
Full screen (f)
Question
Find the critical value at the  = 0.05 level for the following sample, for testing
  versus
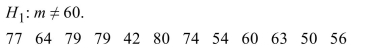
A) 3
B) 1
C) 2
D) 4
= 0.05 level for the following sample, for testing versus A) 3
B) 1
C) 2
D) 4
Question
Fill in the blank with the appropriate word or phrase. The null hypothesis for the rank-sum test is that the two population  are equal.
A) modes
B) rank-sums
C) medians
D) means
are equal.A) modes
B) rank-sums
C) medians
D) means
Question
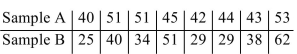
The following data was collected as part of a study examining whether there is a difference between the number of hours men and women watch television. The values represent the number of hours a Subject watched television on a designated Tuesday night. Lower values rank ahead of higher ones. 
a) Calculate the P-value.
b) Can you conclude that the median times watching television are different? Use the level Of significance.
A)
a) 0.1251
b) Yes, you can not conclude that the median times are different.
B)
a) 0.1251.
b) No, you can not conclude that the median times are different.
C)
a) 0.2502.
b) No, you can not conclude that the median times are different.
D)
a) 0.2502
b) Yes, you can not conclude that the median times are different.
a) Calculate the P-value.
b) Can you conclude that the median times watching television are different? Use the
level Of significance. A)
a) 0.1251
b) Yes, you can not conclude that the median times are different.
B)
a) 0.1251.
b) No, you can not conclude that the median times are different.
C)
a) 0.2502.
b) No, you can not conclude that the median times are different.
D)
a) 0.2502
b) Yes, you can not conclude that the median times are different.
Question
The owners of a coffee stand hypothesize that the median number of sales during the hour from
10:00 AM to 11:00 AM is 25. They tabulated the following random sample of the number of sales
during the time period. Use the
  level of significance and provide the following to provide the following information:
a. State appropriate null and alternate hypotheses.
b. Compute the test statistic.
c. Find the critical value.
d. State a conclusion.
10:00 AM to 11:00 AM is 25. They tabulated the following random sample of the number of sales
during the time period.
Use the level of significance and provide the following to provide the following information:a. State appropriate null and alternate hypotheses.
b. Compute the test statistic.
c. Find the critical value.
d. State a conclusion.
Question
A sample of 10 students took a class online and 12 students took an equivalent class in a traditional
classroom. Both classes were given the same final exam three weeks after the end of the courses.
The scores were as follows.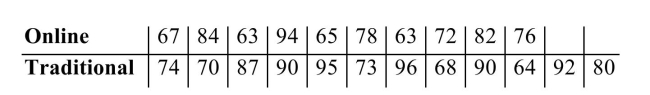 Can you conclude that the median score for the online class is less than for the traditional class? Use the α =
0.05 level of significance.
a) State the null and alternate hypotheses.
b) Compute the value of the test statistic.
c) Compute the P-value.
d) State a conclusion
classroom. Both classes were given the same final exam three weeks after the end of the courses.
The scores were as follows.
Can you conclude that the median score for the online class is less than for the traditional class? Use the α =0.05 level of significance.
a) State the null and alternate hypotheses.
b) Compute the value of the test statistic.
c) Compute the P-value.
d) State a conclusion
Question
The sign test is performed to test 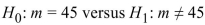 45. There are 13 positive signs and 5 negative signs. What is the value of the test statistic?
A) 13
B) 8
C) 5
D) -8
45. There are 13 positive signs and 5 negative signs. What is the value of the test statistic?A) 13
B) 8
C) 5
D) -8
Question
Given n1=19, n2=30, S=401, and H1: m1  m2 , find the P-value.
A) 0.0643
B) 0.9357
C) 0.1286
D) 0.0322
m2 , find the P-value.A) 0.0643
B) 0.9357
C) 0.1286
D) 0.0322
Question
Heights, in feet, of a sample of 24 mature oak trees in a forest were measured. The results were as
follows.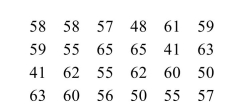 Can you conclude that the median height of oak trees in this forest is greater than 55 feet? Use the α = 0.05
level of significance.
a. State appropriate null and alternate hypotheses.
b. Compute the test statistic.
c. Find the critical value.
d. State a conclusion.
follows.
Can you conclude that the median height of oak trees in this forest is greater than 55 feet? Use the α = 0.05level of significance.
a. State appropriate null and alternate hypotheses.
b. Compute the test statistic.
c. Find the critical value.
d. State a conclusion.
Question
Question
Fill in the blank with the appropriate word or phrase.
When performing the Rank-sum test we reject the null hypothesis when ? .
A) the P-value
B) the test statistic
C) the test statistic
D) the P-value >
When performing the Rank-sum test we reject the null hypothesis when ? .
A) the P-value
B) the test statistic
C) the test statistic
D) the P-value >
Question
The following data was collected as part of a study examining whether there is a difference between the number of hours men and women watch television. The values represent the number of hours a
Subject watched television on a designated Tuesday night. In the process of computing the test
Value the data from both samples should be combined, arranged in order, and ranked according to
Each group. Calculate the sum of the ranks for both groups. Lower values rank ahead of higher
Ones.
A) The sum of the ranks for the men is 170, and the sum of the ranks for the woman is 130.
B) The sum of the ranks for the men is 137.5, and the sum of the ranks for the woman is 162.5.
C) The sum of the ranks for the men is 162.5, and the sum of the ranks for the woman is 137.5.
D) The sum of the ranks for the men is 130, and the sum of the ranks for the woman is 170.
Question
Monthly rents were recorded for a sample of 36 apartments in a certain city. The results were as follows. 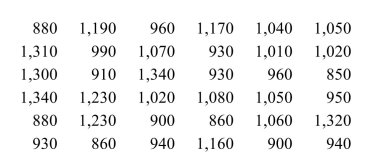 Can you conclude that the median rent is less than $1,100 per month? Use the
  level of
significance.
a. State appropriate null and alternate hypotheses.
b. Compute the test statistic.
c. Find the critical value.
d. State a conclusion.
Can you conclude that the median rent is less than $1,100 per month? Use the level ofsignificance.
a. State appropriate null and alternate hypotheses.
b. Compute the test statistic.
c. Find the critical value.
d. State a conclusion.
Question
Given n1=20, n2=26, S=516, and H1: m1>m2
compute
A) 21.85
B) 1.77
C) 1.02
D) 0.59
compute
A) 21.85
B) 1.77
C) 1.02
D) 0.59
Question
Find the critical value at the  = 0.05 level for the following sample, for testing H0:m=55 versus H1:m>55.
40 70 63 55 44 69 67 54 55 70 66 53 67 64
A)4
B)2
C)1
D)3
= 0.05 level for the following sample, for testing H0:m=55 versus H1:m>55.40 70 63 55 44 69 67 54 55 70 66 53 67 64
A)4
B)2
C)1
D)3
Question
Given 
compute
A) 287
B) -0.11
C) 35.27
D) 316
compute
A) 287
B) -0.11
C) 35.27
D) 316
Question
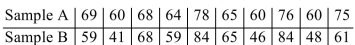
The length of time that customers spent eating dinner was compared with and without music playing. The times, in minutes, were as follows. 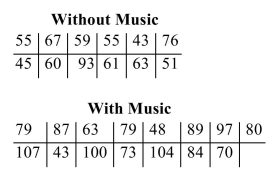
a) Compute the P-value.
b) Can you conclude that the median times eating dinner differ with and without music? Use the =0.01 level of significance.
A)
a) 0.0086.
b) Yes, you can conclude that the median times are different.
B)
a) 0.0086
b) No, you cannot conclude that the median times are different.
C)
a) 0.0124.
b) Yes, you can conclude that the median times are different.
D)
a) 0.0124
b) Yes, you can conclude that the median times are different.
a) Compute the P-value.
b) Can you conclude that the median times eating dinner differ with and without music? Use the
=0.01 level of significance. A)
a) 0.0086.
b) Yes, you can conclude that the median times are different.
B)
a) 0.0086
b) No, you cannot conclude that the median times are different.
C)
a) 0.0124.
b) Yes, you can conclude that the median times are different.
D)
a) 0.0124
b) Yes, you can conclude that the median times are different.
Question
A wild life biologist believes that the median length of the fish in a lake is 36 cm. A random sample of 14 fish yields the following lengths:  Test the biologist's hypothesis at
A) Reject the claim because the test value 4 is more than the critical value 3.
B) Reject the claim because the test value 4 is more than the critical value 2.
C) Do not reject the claim because the test value 3 is equal to the critical value 3.
D) Do not reject the claim because the test value 3 is more than the critical value 2.
Test the biologist's hypothesis at A) Reject the claim because the test value 4 is more than the critical value 3.
B) Reject the claim because the test value 4 is more than the critical value 2.
C) Do not reject the claim because the test value 3 is equal to the critical value 3.
D) Do not reject the claim because the test value 3 is more than the critical value 2.
Question
The sign test is performed to test 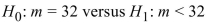 < 32. There are 14 positive signs and 19 negative signs in a test involving 33 samples. What is the value of the test statistic?
A) -0.87
B) 0.87
C) 1.04
D) -0.70
< 32. There are 14 positive signs and 19 negative signs in a test involving 33 samples. What is the value of the test statistic?A) -0.87
B) 0.87
C) 1.04
D) -0.70
Question
Given 
compute
A) 43.16
B) 414
C) 56
D) -0.37
compute
A) 43.16
B) 414
C) 56
D) -0.37
Question
The sign test is performed to test  00 versus
  0. There are 13 plus signs, 24
minus signs, and 2 zeros.
a. What is the test statistic?
b. Is H0 rejected at the =0.05 level?
c. Is H0 rejected at the =0.01 level?
00 versus 0. There are 13 plus signs, 24minus signs, and 2 zeros.
a. What is the test statistic?
b. Is H0 rejected at the
=0.05 level?c. Is H0 rejected at the
=0.01 level? Question
A consumer advice web site tested a fuel additive. The distance that 12 cars could travel on five gallons of gasoline was recorded without and then with the additive. The results were as follows. 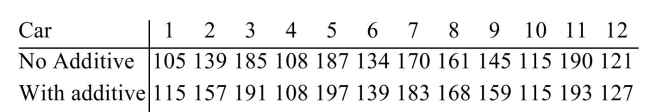 a) Compute the test statistic
b) Can you conclude that the median distance traveled with the additive difference from the median
Distance traveled with the additive? Use the α = 0.05 level of significance.
A) a) S=9
b) We can conclude that the median distances are different.
B) a) S=12
b) We cannot conclude that the median distances are different.
C) a) S=12
b) We can conclude that the median distances are different.
D) a) S=9
b) We cannot conclude that the median distances are different.
a) Compute the test statisticb) Can you conclude that the median distance traveled with the additive difference from the median
Distance traveled with the additive? Use the α = 0.05 level of significance.
A) a) S=9
b) We can conclude that the median distances are different.
B) a) S=12
b) We cannot conclude that the median distances are different.
C) a) S=12
b) We can conclude that the median distances are different.
D) a) S=9
b) We cannot conclude that the median distances are different.
Question
If the test value for a signed-rank test is 18, the sample size is 13, and the test is to be carried out at the  level of significance, should the null hypothesis be rejected? Use the table of critical
Values for the signed-rank test below.
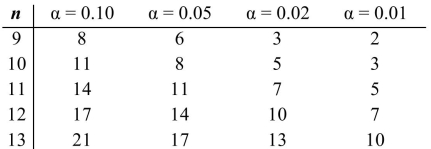
A) Reject H0 because the test value 18 is less than the critical value 20 .
B) Do not reject H0 because the test value 18 is less than the critical value 20 .
C) Reject H0 because the test value 18 is greater than the critical value 17 .
D) Do not reject H0 because the test value 18 is greater than the critical value 17 .
level of significance, should the null hypothesis be rejected? Use the table of criticalValues for the signed-rank test below.
A) Reject H0 because the test value 18 is less than the critical value 20 .
B) Do not reject H0 because the test value 18 is less than the critical value 20 .
C) Reject H0 because the test value 18 is greater than the critical value 17 .
D) Do not reject H0 because the test value 18 is greater than the critical value 17 .
Question
For the following data, compute the test statistic and the critical value, and determine whether to reject  at the
  level.
A) S=5, Critical value is 6, Reject H0
B) S=5, Critical value is 6, Do not reject H0
C) S=6, Critical value is 4, Reject H0
D) S=6, Critical value is 4, Do not reject H0
at the level.A) S=5, Critical value is 6, Reject H0
B) S=5, Critical value is 6, Do not reject H0
C) S=6, Critical value is 4, Reject H0
D) S=6, Critical value is 4, Do not reject H0
Question
For the following data, compute the test statistic and the critical value, and determine whether to reject  at the
  level.
A) S=4, Critical value is 4, Do not reject H0
B) S=5, Critical value is 8, Do not reject H0
C) S=5, Critical value is 8, Reject H0
D) S=4, Critical value is 4 , Reject H0
at the level.A) S=4, Critical value is 4, Do not reject H0
B) S=5, Critical value is 8, Do not reject H0
C) S=5, Critical value is 8, Reject H0
D) S=4, Critical value is 4 , Reject H0
Question
Ten subjects were weighed before and after a new diet. The results were as follows. 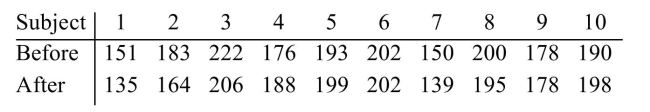 a) Compute the test statistic b) Can you conclude that the median weight differs before and after the diet? Use the α = 0.05 level Of significance.
A) a) S=11
b)We cannot conclude that the weights before and after the diet are different.
B) a) S=11
b) We can conclude that the weights before and after the diet are different.
C) a) S=10
b) We cannot conclude that the weights before and after the diet are different.
D) a) S=10
b) We can conclude that the weights before and after the diet are different.
a) Compute the test statistic b) Can you conclude that the median weight differs before and after the diet? Use the α = 0.05 level Of significance. A) a) S=11
b)We cannot conclude that the weights before and after the diet are different.
B) a) S=11
b) We can conclude that the weights before and after the diet are different.
C) a) S=10
b) We cannot conclude that the weights before and after the diet are different.
D) a) S=10
b) We can conclude that the weights before and after the diet are different.
Question
A sample of eight people attended a two day course that prepares students for college admission testing. The students were given a pretest before the course and a posttest after the course. The results were as follows.
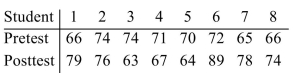
a) Compute the test statistic
b) Can you conclude that the median scores differ between the pretest and posttest? Use the α = 0.10
Level of significance.
A) a) S=10
b) We cannot conclude that the median of the pretests and posttests are different.
B) a) S=10
b) We can conclude that the median of the pretests and posttests are different.
C) a) S=9
b) We cannot conclude that the median of the pretests and posttests are different.
D) a) S=9
b) We can conclude that the median of the pretests and posttests are different.
Question
Six second-graders tried tossing a ball into a basket ten times each. Their teacher then suggested a different way of tossing the ball, and the six students tried again. The number of successful tosses,
Before and after the teacher's suggestion, are shown below.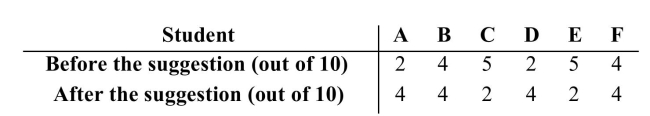 Compute S, the test statistic for a signed-rank test.
A) S = 2
B) S = 6
C) S = 7
D) S = 3
Before and after the teacher's suggestion, are shown below.
Compute S, the test statistic for a signed-rank test.A) S = 2
B) S = 6
C) S = 7
D) S = 3

Unlock Deck
Sign up to unlock the cards in this deck!
Unlock Deck
Unlock Deck
1/27
Play
Full screen (f)
Deck 15: Nonparametric Statistics
1
Find the critical value at the = 0.05 level for the following sample, for testing versus
A) 3
B) 1
C) 2
D) 4
= 0.05 level for the following sample, for testing versus A) 3
B) 1
C) 2
D) 4
1
2
Fill in the blank with the appropriate word or phrase. The null hypothesis for the rank-sum test is that the two population are equal.
A) modes
B) rank-sums
C) medians
D) means
are equal.A) modes
B) rank-sums
C) medians
D) means
medians
3
The following data was collected as part of a study examining whether there is a difference between the number of hours men and women watch television. The values represent the number of hours a Subject watched television on a designated Tuesday night. Lower values rank ahead of higher ones.
a) Calculate the P-value.
b) Can you conclude that the median times watching television are different? Use the level Of significance.
A)
a) 0.1251
b) Yes, you can not conclude that the median times are different.
B)
a) 0.1251.
b) No, you can not conclude that the median times are different.
C)
a) 0.2502.
b) No, you can not conclude that the median times are different.
D)
a) 0.2502
b) Yes, you can not conclude that the median times are different.
a) Calculate the P-value.
b) Can you conclude that the median times watching television are different? Use the
level Of significance. A)
a) 0.1251
b) Yes, you can not conclude that the median times are different.
B)
a) 0.1251.
b) No, you can not conclude that the median times are different.
C)
a) 0.2502.
b) No, you can not conclude that the median times are different.
D)
a) 0.2502
b) Yes, you can not conclude that the median times are different.
a) 0.2502.
b) No, you can not conclude that the median times are different.
b) No, you can not conclude that the median times are different.
4
The owners of a coffee stand hypothesize that the median number of sales during the hour from
10:00 AM to 11:00 AM is 25. They tabulated the following random sample of the number of sales
during the time period. Use the level of significance and provide the following to provide the following information:
a. State appropriate null and alternate hypotheses.
b. Compute the test statistic.
c. Find the critical value.
d. State a conclusion.
10:00 AM to 11:00 AM is 25. They tabulated the following random sample of the number of sales
during the time period.
Use the level of significance and provide the following to provide the following information:a. State appropriate null and alternate hypotheses.
b. Compute the test statistic.
c. Find the critical value.
d. State a conclusion.
Unlock Deck
Unlock for access to all 27 flashcards in this deck.
Unlock Deck
k this deck
5
A sample of 10 students took a class online and 12 students took an equivalent class in a traditional
classroom. Both classes were given the same final exam three weeks after the end of the courses.
The scores were as follows. Can you conclude that the median score for the online class is less than for the traditional class? Use the α =
0.05 level of significance.
a) State the null and alternate hypotheses.
b) Compute the value of the test statistic.
c) Compute the P-value.
d) State a conclusion
classroom. Both classes were given the same final exam three weeks after the end of the courses.
The scores were as follows.
Can you conclude that the median score for the online class is less than for the traditional class? Use the α =0.05 level of significance.
a) State the null and alternate hypotheses.
b) Compute the value of the test statistic.
c) Compute the P-value.
d) State a conclusion
Unlock Deck
Unlock for access to all 27 flashcards in this deck.
Unlock Deck
k this deck
6
The sign test is performed to test 45. There are 13 positive signs and 5 negative signs. What is the value of the test statistic?
A) 13
B) 8
C) 5
D) -8
45. There are 13 positive signs and 5 negative signs. What is the value of the test statistic?A) 13
B) 8
C) 5
D) -8
Unlock Deck
Unlock for access to all 27 flashcards in this deck.
Unlock Deck
k this deck
7
Given n1=19, n2=30, S=401, and H1: m1 m2 , find the P-value.
A) 0.0643
B) 0.9357
C) 0.1286
D) 0.0322
m2 , find the P-value.A) 0.0643
B) 0.9357
C) 0.1286
D) 0.0322
Unlock Deck
Unlock for access to all 27 flashcards in this deck.
Unlock Deck
k this deck
8
Heights, in feet, of a sample of 24 mature oak trees in a forest were measured. The results were as
follows. Can you conclude that the median height of oak trees in this forest is greater than 55 feet? Use the α = 0.05
level of significance.
a. State appropriate null and alternate hypotheses.
b. Compute the test statistic.
c. Find the critical value.
d. State a conclusion.
follows.
Can you conclude that the median height of oak trees in this forest is greater than 55 feet? Use the α = 0.05level of significance.
a. State appropriate null and alternate hypotheses.
b. Compute the test statistic.
c. Find the critical value.
d. State a conclusion.
Unlock Deck
Unlock for access to all 27 flashcards in this deck.
Unlock Deck
k this deck
9
Given n1=16, n2=21, S=249, and H1: m12 , find the P-value.
A) 0.0455
B) 0.0910
C) 0.0228
D) 0.9545
A) 0.0455
B) 0.0910
C) 0.0228
D) 0.9545
Unlock Deck
Unlock for access to all 27 flashcards in this deck.
Unlock Deck
k this deck
10
Fill in the blank with the appropriate word or phrase.
When performing the Rank-sum test we reject the null hypothesis when ? .
A) the P-value
B) the test statistic
C) the test statistic
D) the P-value >
When performing the Rank-sum test we reject the null hypothesis when ? .
A) the P-value
B) the test statistic
C) the test statistic
D) the P-value >
Unlock Deck
Unlock for access to all 27 flashcards in this deck.
Unlock Deck
k this deck
11
The following data was collected as part of a study examining whether there is a difference between the number of hours men and women watch television. The values represent the number of hours a
Subject watched television on a designated Tuesday night. In the process of computing the test
Value the data from both samples should be combined, arranged in order, and ranked according to
Each group. Calculate the sum of the ranks for both groups. Lower values rank ahead of higher
Ones.
A) The sum of the ranks for the men is 170, and the sum of the ranks for the woman is 130.
B) The sum of the ranks for the men is 137.5, and the sum of the ranks for the woman is 162.5.
C) The sum of the ranks for the men is 162.5, and the sum of the ranks for the woman is 137.5.
D) The sum of the ranks for the men is 130, and the sum of the ranks for the woman is 170.
Subject watched television on a designated Tuesday night. In the process of computing the test
Value the data from both samples should be combined, arranged in order, and ranked according to
Each group. Calculate the sum of the ranks for both groups. Lower values rank ahead of higher
Ones.
A) The sum of the ranks for the men is 170, and the sum of the ranks for the woman is 130.
B) The sum of the ranks for the men is 137.5, and the sum of the ranks for the woman is 162.5.
C) The sum of the ranks for the men is 162.5, and the sum of the ranks for the woman is 137.5.
D) The sum of the ranks for the men is 130, and the sum of the ranks for the woman is 170.
Unlock Deck
Unlock for access to all 27 flashcards in this deck.
Unlock Deck
k this deck
12
Monthly rents were recorded for a sample of 36 apartments in a certain city. The results were as follows. Can you conclude that the median rent is less than $1,100 per month? Use the level of
significance.
a. State appropriate null and alternate hypotheses.
b. Compute the test statistic.
c. Find the critical value.
d. State a conclusion.
Can you conclude that the median rent is less than $1,100 per month? Use the level ofsignificance.
a. State appropriate null and alternate hypotheses.
b. Compute the test statistic.
c. Find the critical value.
d. State a conclusion.
Unlock Deck
Unlock for access to all 27 flashcards in this deck.
Unlock Deck
k this deck
13
Given n1=20, n2=26, S=516, and H1: m1>m2
compute
A) 21.85
B) 1.77
C) 1.02
D) 0.59
compute
A) 21.85
B) 1.77
C) 1.02
D) 0.59
Unlock Deck
Unlock for access to all 27 flashcards in this deck.
Unlock Deck
k this deck
14
Find the critical value at the = 0.05 level for the following sample, for testing H0:m=55 versus H1:m>55.
40 70 63 55 44 69 67 54 55 70 66 53 67 64
A)4
B)2
C)1
D)3
= 0.05 level for the following sample, for testing H0:m=55 versus H1:m>55.40 70 63 55 44 69 67 54 55 70 66 53 67 64
A)4
B)2
C)1
D)3
Unlock Deck
Unlock for access to all 27 flashcards in this deck.
Unlock Deck
k this deck
15
Given
compute
A) 287
B) -0.11
C) 35.27
D) 316
compute
A) 287
B) -0.11
C) 35.27
D) 316
Unlock Deck
Unlock for access to all 27 flashcards in this deck.
Unlock Deck
k this deck
16
The length of time that customers spent eating dinner was compared with and without music playing. The times, in minutes, were as follows.
a) Compute the P-value.
b) Can you conclude that the median times eating dinner differ with and without music? Use the =0.01 level of significance.
A)
a) 0.0086.
b) Yes, you can conclude that the median times are different.
B)
a) 0.0086
b) No, you cannot conclude that the median times are different.
C)
a) 0.0124.
b) Yes, you can conclude that the median times are different.
D)
a) 0.0124
b) Yes, you can conclude that the median times are different.
a) Compute the P-value.
b) Can you conclude that the median times eating dinner differ with and without music? Use the
=0.01 level of significance. A)
a) 0.0086.
b) Yes, you can conclude that the median times are different.
B)
a) 0.0086
b) No, you cannot conclude that the median times are different.
C)
a) 0.0124.
b) Yes, you can conclude that the median times are different.
D)
a) 0.0124
b) Yes, you can conclude that the median times are different.
Unlock Deck
Unlock for access to all 27 flashcards in this deck.
Unlock Deck
k this deck
17
A wild life biologist believes that the median length of the fish in a lake is 36 cm. A random sample of 14 fish yields the following lengths: Test the biologist's hypothesis at
A) Reject the claim because the test value 4 is more than the critical value 3.
B) Reject the claim because the test value 4 is more than the critical value 2.
C) Do not reject the claim because the test value 3 is equal to the critical value 3.
D) Do not reject the claim because the test value 3 is more than the critical value 2.
Test the biologist's hypothesis at A) Reject the claim because the test value 4 is more than the critical value 3.
B) Reject the claim because the test value 4 is more than the critical value 2.
C) Do not reject the claim because the test value 3 is equal to the critical value 3.
D) Do not reject the claim because the test value 3 is more than the critical value 2.
Unlock Deck
Unlock for access to all 27 flashcards in this deck.
Unlock Deck
k this deck
18
The sign test is performed to test < 32. There are 14 positive signs and 19 negative signs in a test involving 33 samples. What is the value of the test statistic?
A) -0.87
B) 0.87
C) 1.04
D) -0.70
< 32. There are 14 positive signs and 19 negative signs in a test involving 33 samples. What is the value of the test statistic?A) -0.87
B) 0.87
C) 1.04
D) -0.70
Unlock Deck
Unlock for access to all 27 flashcards in this deck.
Unlock Deck
k this deck
19
Given
compute
A) 43.16
B) 414
C) 56
D) -0.37
compute
A) 43.16
B) 414
C) 56
D) -0.37
Unlock Deck
Unlock for access to all 27 flashcards in this deck.
Unlock Deck
k this deck
20
The sign test is performed to test 00 versus 0. There are 13 plus signs, 24
minus signs, and 2 zeros.
a. What is the test statistic?
b. Is H0 rejected at the=0.05 level?
c. Is H0 rejected at the=0.01 level?
00 versus 0. There are 13 plus signs, 24minus signs, and 2 zeros.
a. What is the test statistic?
b. Is H0 rejected at the
=0.05 level?c. Is H0 rejected at the
=0.01 level? Unlock Deck
Unlock for access to all 27 flashcards in this deck.
Unlock Deck
k this deck
21
A consumer advice web site tested a fuel additive. The distance that 12 cars could travel on five gallons of gasoline was recorded without and then with the additive. The results were as follows. a) Compute the test statistic
b) Can you conclude that the median distance traveled with the additive difference from the median
Distance traveled with the additive? Use the α = 0.05 level of significance.
A) a) S=9
b) We can conclude that the median distances are different.
B) a) S=12
b) We cannot conclude that the median distances are different.
C) a) S=12
b) We can conclude that the median distances are different.
D) a) S=9
b) We cannot conclude that the median distances are different.
a) Compute the test statisticb) Can you conclude that the median distance traveled with the additive difference from the median
Distance traveled with the additive? Use the α = 0.05 level of significance.
A) a) S=9
b) We can conclude that the median distances are different.
B) a) S=12
b) We cannot conclude that the median distances are different.
C) a) S=12
b) We can conclude that the median distances are different.
D) a) S=9
b) We cannot conclude that the median distances are different.
Unlock Deck
Unlock for access to all 27 flashcards in this deck.
Unlock Deck
k this deck
22
If the test value for a signed-rank test is 18, the sample size is 13, and the test is to be carried out at the level of significance, should the null hypothesis be rejected? Use the table of critical
Values for the signed-rank test below.
A) Reject H0 because the test value 18 is less than the critical value 20 .
B) Do not reject H0 because the test value 18 is less than the critical value 20 .
C) Reject H0 because the test value 18 is greater than the critical value 17 .
D) Do not reject H0 because the test value 18 is greater than the critical value 17 .
level of significance, should the null hypothesis be rejected? Use the table of criticalValues for the signed-rank test below.
A) Reject H0 because the test value 18 is less than the critical value 20 .
B) Do not reject H0 because the test value 18 is less than the critical value 20 .
C) Reject H0 because the test value 18 is greater than the critical value 17 .
D) Do not reject H0 because the test value 18 is greater than the critical value 17 .
Unlock Deck
Unlock for access to all 27 flashcards in this deck.
Unlock Deck
k this deck
23
For the following data, compute the test statistic and the critical value, and determine whether to reject at the level.
A) S=5, Critical value is 6, Reject H0
B) S=5, Critical value is 6, Do not reject H0
C) S=6, Critical value is 4, Reject H0
D) S=6, Critical value is 4, Do not reject H0
at the level.A) S=5, Critical value is 6, Reject H0
B) S=5, Critical value is 6, Do not reject H0
C) S=6, Critical value is 4, Reject H0
D) S=6, Critical value is 4, Do not reject H0
Unlock Deck
Unlock for access to all 27 flashcards in this deck.
Unlock Deck
k this deck
24
For the following data, compute the test statistic and the critical value, and determine whether to reject at the level.
A) S=4, Critical value is 4, Do not reject H0
B) S=5, Critical value is 8, Do not reject H0
C) S=5, Critical value is 8, Reject H0
D) S=4, Critical value is 4 , Reject H0
at the level.A) S=4, Critical value is 4, Do not reject H0
B) S=5, Critical value is 8, Do not reject H0
C) S=5, Critical value is 8, Reject H0
D) S=4, Critical value is 4 , Reject H0
Unlock Deck
Unlock for access to all 27 flashcards in this deck.
Unlock Deck
k this deck
25
Ten subjects were weighed before and after a new diet. The results were as follows. a) Compute the test statistic b) Can you conclude that the median weight differs before and after the diet? Use the α = 0.05 level Of significance.
A) a) S=11
b)We cannot conclude that the weights before and after the diet are different.
B) a) S=11
b) We can conclude that the weights before and after the diet are different.
C) a) S=10
b) We cannot conclude that the weights before and after the diet are different.
D) a) S=10
b) We can conclude that the weights before and after the diet are different.
a) Compute the test statistic b) Can you conclude that the median weight differs before and after the diet? Use the α = 0.05 level Of significance. A) a) S=11
b)We cannot conclude that the weights before and after the diet are different.
B) a) S=11
b) We can conclude that the weights before and after the diet are different.
C) a) S=10
b) We cannot conclude that the weights before and after the diet are different.
D) a) S=10
b) We can conclude that the weights before and after the diet are different.
Unlock Deck
Unlock for access to all 27 flashcards in this deck.
Unlock Deck
k this deck
26
A sample of eight people attended a two day course that prepares students for college admission testing. The students were given a pretest before the course and a posttest after the course. The results were as follows.
a) Compute the test statistic
b) Can you conclude that the median scores differ between the pretest and posttest? Use the α = 0.10
Level of significance.
A) a) S=10
b) We cannot conclude that the median of the pretests and posttests are different.
B) a) S=10
b) We can conclude that the median of the pretests and posttests are different.
C) a) S=9
b) We cannot conclude that the median of the pretests and posttests are different.
D) a) S=9
b) We can conclude that the median of the pretests and posttests are different.
Unlock Deck
Unlock for access to all 27 flashcards in this deck.
Unlock Deck
k this deck
27
Six second-graders tried tossing a ball into a basket ten times each. Their teacher then suggested a different way of tossing the ball, and the six students tried again. The number of successful tosses,
Before and after the teacher's suggestion, are shown below. Compute S, the test statistic for a signed-rank test.
A) S = 2
B) S = 6
C) S = 7
D) S = 3
Before and after the teacher's suggestion, are shown below.
Compute S, the test statistic for a signed-rank test.A) S = 2
B) S = 6
C) S = 7
D) S = 3
Unlock Deck
Unlock for access to all 27 flashcards in this deck.
Unlock Deck
k this deck
Unlock Deck
Unlock for access to all 27 flashcards in this deck.


