Deck 10: Two-Sample Confidence Intervals
Full screen (f)
Question
Question
Question
Question
Question
In an agricultural experiment, the effects of two fertilizers on the production of oranges were measured. Fourteen randomly selected plots of land were treated with fertilizer A, and 10 randomly
Selected plots were treated with fertilizer B. The number of pounds of harvested fruit was measured
From each plot. Following are the results.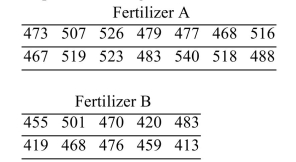 Assume that the populations are approximately normal. Construct a 95% confidence interval for the
Difference between the mean yields for the two types of fertilizer.
A) (20.3, 64.6)
B) (16.4, 68.6)
C) (14.0, 70.9)
D) (19.0, 65.9)
Selected plots were treated with fertilizer B. The number of pounds of harvested fruit was measured
From each plot. Following are the results.
Assume that the populations are approximately normal. Construct a 95% confidence interval for theDifference between the mean yields for the two types of fertilizer.
A) (20.3, 64.6)
B) (16.4, 68.6)
C) (14.0, 70.9)
D) (19.0, 65.9)
Question
The following MINITAB output display presents a 95% confidence interval for the difference between two means. 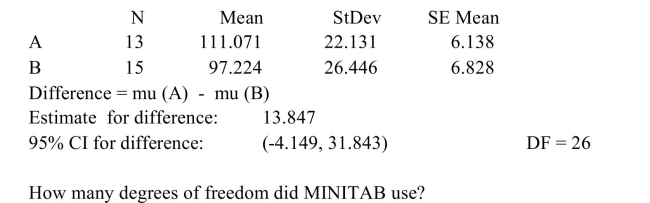
A) 26
B) 13.847
C) 28
D) 35.992
A) 26
B) 13.847
C) 28
D) 35.992
Question
Question
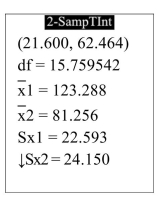
The following display from a TI-84 Plus calculator presents a 95% confidence interval for the difference between two means. The sample sizes are 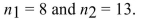

A) 123.288
B) 40.864
C) 42.032
D) -1.557
A) 123.288
B) 40.864
C) 42.032
D) -1.557
Question
Using technology, solve the following problem: An amateur golfer wishes to determine if there is a difference between the drive distances of her two favorite drivers. (A driver is a specialized club for
Driving the golf ball down range.) She hits fourteen balls with driver A and 10 balls with driver B. The drive
Distances (in yards) for the trials are show below.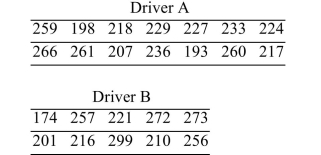 Assume that the populations are approximately normal. Construct a 95% confidence interval for the
Difference between the mean drive distances for the two drivers.
A) (-31.88, 17.22)
B) (-37.24, 22.58)
C) (1,016.33, 296.53)
D) (1,386.82, 509.86)
Driving the golf ball down range.) She hits fourteen balls with driver A and 10 balls with driver B. The drive
Distances (in yards) for the trials are show below.
Assume that the populations are approximately normal. Construct a 95% confidence interval for theDifference between the mean drive distances for the two drivers.
A) (-31.88, 17.22)
B) (-37.24, 22.58)
C) (1,016.33, 296.53)
D) (1,386.82, 509.86)
Question
An amateur golfer wishes to determine if there is a difference between the drive distances of her two favorite drivers. (A driver is a specialized club for driving the golf ball down range.) She hits fourteen balls
With driver A and 10 balls with driver B. The drive distances (in yards) for the trials are show below.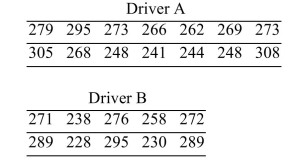 Assume that the populations are approximately normal. Construct a 90% confidence interval for the
Difference between the mean drive distances for the two drivers.
A) (-13.5, 24.1)
B) (-12.6, 23.2)
C) (-9.9, 20.5)
D) (-11.0, 21.6)
With driver A and 10 balls with driver B. The drive distances (in yards) for the trials are show below.
Assume that the populations are approximately normal. Construct a 90% confidence interval for theDifference between the mean drive distances for the two drivers.
A) (-13.5, 24.1)
B) (-12.6, 23.2)
C) (-9.9, 20.5)
D) (-11.0, 21.6)
Question
In an agricultural experiment, the effects of two fertilizers on the production of oranges were measured. Fourteen randomly selected plots of land were treated with fertilizer A, and 10 randomly
Selected plots were treated with fertilizer B. The number of pounds of harvested fruit was measured
From each plot. Following are the results.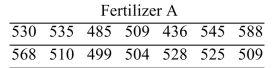
 Assume that the populations are approximately normal. Construct a 95% confidence interval for the
Difference between the mean yields for the two types of fertilizer. Based on your results, is it
Reasonable to conclude that the mean yields may be the same for fertilizers A and B?
A) Yes
B) No
Selected plots were treated with fertilizer B. The number of pounds of harvested fruit was measured
From each plot. Following are the results.
Assume that the populations are approximately normal. Construct a 95% confidence interval for theDifference between the mean yields for the two types of fertilizer. Based on your results, is it
Reasonable to conclude that the mean yields may be the same for fertilizers A and B?
A) Yes
B) No
Question
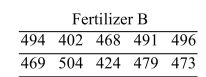
Using technology, solve the following problem: In an agricultural experiment, the effects of two fertilizers on the production of oranges were measured. Fourteen randomly selected plots of land
Were treated with fertilizer A, and 10 randomly selected plots were treated with fertilizer B. The
Number of pounds of harvested fruit was measured from each plot. Following are the results.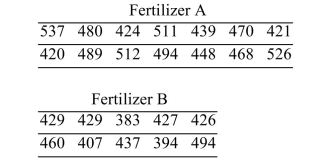 Assume that the populations are approximately normal. Construct a 98% confidence interval for the
Difference between the mean yields for the two types of fertilizer.
A) (80.766, 6,763.582)
B) (8.987, 82.241)
C) (19.740, 7,531.810)
D) (4.443, 86.786)
Were treated with fertilizer A, and 10 randomly selected plots were treated with fertilizer B. The
Number of pounds of harvested fruit was measured from each plot. Following are the results.
Assume that the populations are approximately normal. Construct a 98% confidence interval for theDifference between the mean yields for the two types of fertilizer.
A) (80.766, 6,763.582)
B) (8.987, 82.241)
C) (19.740, 7,531.810)
D) (4.443, 86.786)
Question
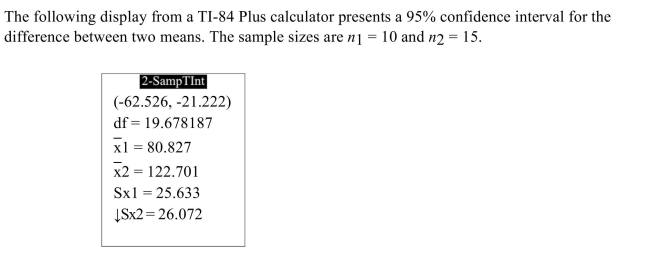 How many degrees of freedom did the calculator use?
A) -0.439
B) -41.874
C) 19.678187
D) 80.827
Question
An amateur golfer wishes to determine if there is a difference between the drive distances of her two favorite drivers. (A driver is a specialized club for driving the golf ball down range.) She hits fourteen balls
With driver A and 10 balls with driver B. The drive distances (in yards) for the trials are show below.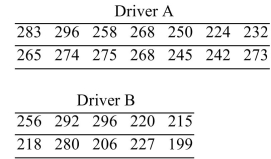 Assume that the populations are approximately normal. Construct a 98% confidence interval for the
Difference between the mean drive distances for the two drivers. Based on your results, is it
Reasonable to conclude that the mean drive distances may be the same for drivers A and B?
A) Yes
B) No
With driver A and 10 balls with driver B. The drive distances (in yards) for the trials are show below.
Assume that the populations are approximately normal. Construct a 98% confidence interval for theDifference between the mean drive distances for the two drivers. Based on your results, is it
Reasonable to conclude that the mean drive distances may be the same for drivers A and B?
A) Yes
B) No
Question
The following MINITAB output display presents a 95% confidence interval for the difference between two means. 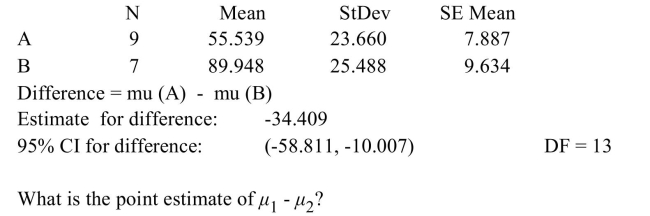
A) -34.409
B) 89.948
C) 13
D) -48.804
A) -34.409
B) 89.948
C) 13
D) -48.804
Question
Question
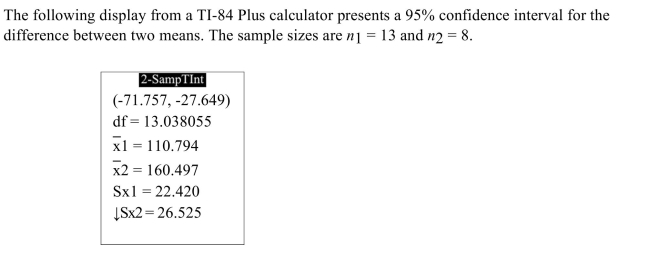 Fill in the blanks: We are 95% confident that the difference between the means is between _________ and _________.
A) 22.420, 26.525
B) 110.794, 160.497
C) 0, 13.038055
D) -71.757, -27.649
Question
Question
A) (2.869, 0.666)
B) (-0.444, 7.444)
C) (-1.271, 8.271)
D) (-1.232, 8.231)
Question
A) (9.0, 15.8)
B) (10.3, 14.5)
C) (7.2, 17.6)
D) (10.8, 14.0)
Question
Question
Question
The following display from a TI-84 Plus calculator presents a 95% confidence interval for the mean difference between matched pairs. 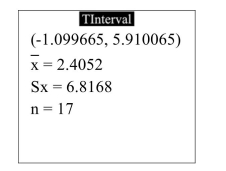 How many degrees of freedom are there?
A) 16
B) 6.8168
C) 17
D) 2.4052
How many degrees of freedom are there?A) 16
B) 6.8168
C) 17
D) 2.4052
Question
Question
Two microprocessors are compared on a sample of 6 benchmark codes to determine whether there is a difference in speed. The times (in seconds) used by each processor on each code are given below: 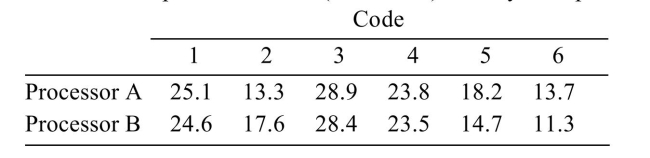 An electronics engineer claims that the mean speed is the same for both processors. Does
The 99% confidence interval contradict this claim? (Hint: First find the 99% confidence interval for
The difference between the mean speeds.)
A) No
B) Yes
An electronics engineer claims that the mean speed is the same for both processors. DoesThe 99% confidence interval contradict this claim? (Hint: First find the 99% confidence interval for
The difference between the mean speeds.)
A) No
B) Yes
Question
Two microprocessors are compared on a sample of 6 benchmark codes to determine whether there is a difference in speed. The times (in seconds) used by each processor on each code are given below: 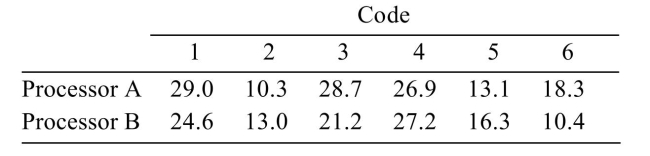 Find the 95% confidence interval for the difference between the mean speeds.
A) (-3.61, 8.14)
B) (-3.92, 8.45)
C) (-2.98, 7.51)
D) (-3.19, 7.72)
Find the 95% confidence interval for the difference between the mean speeds.A) (-3.61, 8.14)
B) (-3.92, 8.45)
C) (-2.98, 7.51)
D) (-3.19, 7.72)
Question
A group of six individuals with high cholesterol levels were given a new diet designed to lower cholesterol levels. Cholesterol levels, in milligrams per deciliter, were measured before and after the
Implementation of the diet for each individual, with the following results: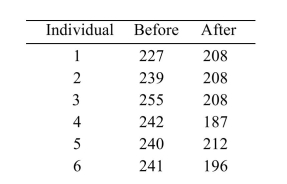 Find the 98% confidence interval for the mean reduction in cholesterol level.
A) (15.23, 59.77)
B) (17.85, 58.83)
C) (16.17, 15.23)
D) (18.79, 56.21)
Implementation of the diet for each individual, with the following results:
Find the 98% confidence interval for the mean reduction in cholesterol level.A) (15.23, 59.77)
B) (17.85, 58.83)
C) (16.17, 15.23)
D) (18.79, 56.21)
Question
A group of six individuals with high blood pressure volunteered to test whether petting cats for 10 minutes can alter systolic blood pressure levels. Systolic blood pressures (in millimeters of mercury,
Or mmHg) were measured for each subject before and after petting cats for 10 minutes, with the
Following results: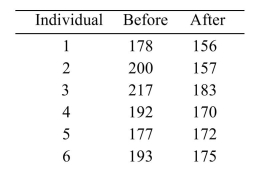 A researcher claims that the mean reduction in systolic blood pressure is 14 mmHg. Does the 98%
Confidence interval contradict this claim? (Hint: you need to find the 98% confidence interval for
The mean reduction in systolic blood pressure.)
A) No
B) Yes
Or mmHg) were measured for each subject before and after petting cats for 10 minutes, with the
Following results:
A researcher claims that the mean reduction in systolic blood pressure is 14 mmHg. Does the 98%Confidence interval contradict this claim? (Hint: you need to find the 98% confidence interval for
The mean reduction in systolic blood pressure.)
A) No
B) Yes
Question
Question
A) (-0.048, 0.310)
B) (-0.063, 0.325)
C) (-0.038, 0.300)
D) (-0.054, 0.316)
Question
The following display from a TI-84 Plus calculator presents a 95% confidence interval for the mean difference between matched pairs. 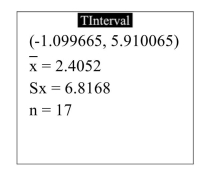 What is the point estimate of
  ?
?
A) 7.00973
B) 17
C) 2.4052
D) 6.8168
What is the point estimate of ?A) 7.00973
B) 17
C) 2.4052
D) 6.8168
Question
The following MINITAB output display presents a 95% confidence interval for the difference between two proportions. 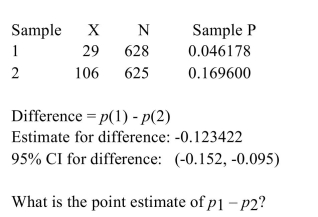
A) -0.123422
B) 0.215778
C) 0.108
D) 0.057
A) -0.123422
B) 0.215778
C) 0.108
D) 0.057
Question
The following MINITAB output display presents a 95% confidence interval for the difference between two means. 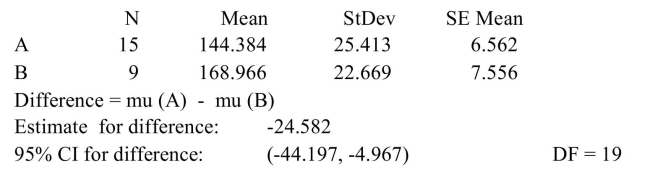 Fill in the blanks: We are 95% confident that the difference in the means is between ______
And ______.
A) 9, 15
B) 144.384, 168.966
C) 0, 19
D) -44.197, -4.967
Fill in the blanks: We are 95% confident that the difference in the means is between ______And ______.
A) 9, 15
B) 144.384, 168.966
C) 0, 19
D) -44.197, -4.967
Question
A group of six individuals with high blood pressure volunteered to test whether petting cats for 10 minutes can alter systolic blood pressure levels. Systolic blood pressures (in millimeters of mercury,
Or mmHg) were measured for each subject before and after petting cats for 10 minutes, with the
Following results: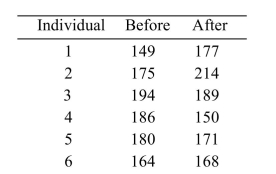 Find the 99% confidence interval for the mean reduction in systolic blood pressure.
A) (-47.97, 40.97)
B) (-56.42, 49.42)
C) (-49.31, 46.75)
D) (-53.75, -56.42)
Or mmHg) were measured for each subject before and after petting cats for 10 minutes, with the
Following results:
Find the 99% confidence interval for the mean reduction in systolic blood pressure.A) (-47.97, 40.97)
B) (-56.42, 49.42)
C) (-49.31, 46.75)
D) (-53.75, -56.42)
Question
Question
The following MINITAB output display presents a 95% confidence interval for the difference between two proportions. 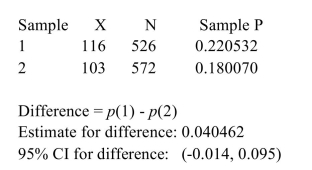 Fill in the blanks: We are 95% confident that the difference between the proportions is between ______ and
______.
A) 0, 0.040462
B) 0.18007, 0.220532
C) 526, 572
D) -0.014, 0.095
Fill in the blanks: We are 95% confident that the difference between the proportions is between ______ and______.
A) 0, 0.040462
B) 0.18007, 0.220532
C) 526, 572
D) -0.014, 0.095
Question
Question
The following display from a TI-84 Plus calculator presents a 95% confidence interval for the difference between two proportions. 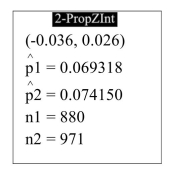 Compute the point estimate of
A) -0.004832
B) 0.062
C) 1,851
D) 91
Compute the point estimate of A) -0.004832
B) 0.062
C) 1,851
D) 91
Question
A group of six individuals with high cholesterol levels were given a new diet designed to lower cholesterol levels. Cholesterol levels, in milligrams per deciliter, were measured before and after the
Implementation of the diet for each individual, with the following results: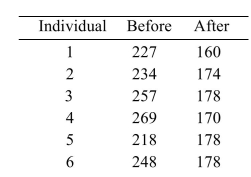 A dietician claims that the mean reduction in cholesterol level is 51 milligrams per deciliter. Does the
98% confidence interval contradict this claim? (Hint: you need to find the 98% confidence interval
For the mean reduction in cholesterol level.)
A) No
B) Yes
Implementation of the diet for each individual, with the following results:
A dietician claims that the mean reduction in cholesterol level is 51 milligrams per deciliter. Does the98% confidence interval contradict this claim? (Hint: you need to find the 98% confidence interval
For the mean reduction in cholesterol level.)
A) No
B) Yes
Question
The following display from a TI-84 Plus calculator presents a 95% confidence interval for the difference between two proportions. 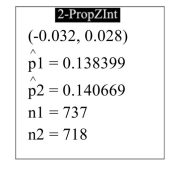 Fill in the blanks: We are 95% confident that the difference between two proportions is between _______ and
_______.
A) -0.032, 0.028
B) 0, 1,455
C) 0.138399, 0.140669
D) 718, 737
Fill in the blanks: We are 95% confident that the difference between two proportions is between _______ and_______.
A) -0.032, 0.028
B) 0, 1,455
C) 0.138399, 0.140669
D) 718, 737
Question
The following output from MINITAB presents a confidence interval for the mean difference between matched pairs. 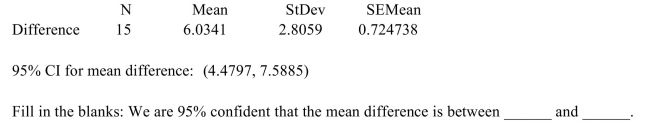
A) 3.2282, 8.84
B) 0.724738, 2.8059
C) 0, 6.0341
D) 4.4797, 7.5885
A) 3.2282, 8.84
B) 0.724738, 2.8059
C) 0, 6.0341
D) 4.4797, 7.5885
Question
The following output from MINITAB presents a confidence interval for the mean difference between matched pairs. 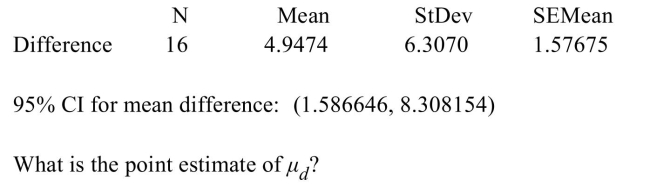
A) 1.57675
B) 15
C) 4.9474
D) 6.3070
A) 1.57675
B) 15
C) 4.9474
D) 6.3070
Question
The following output from MINITAB presents a confidence interval for the mean difference between matched pairs. 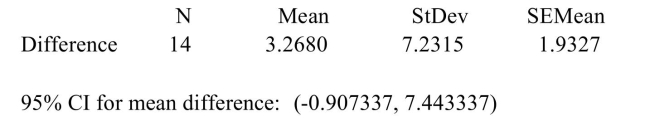 How many degrees of freedom are there?
A) 13
B) 14
C) 1.9327
D) 7.2315
How many degrees of freedom are there?A) 13
B) 14
C) 1.9327
D) 7.2315
Question
The following display from a TI-84 Plus calculator presents a 95% confidence interval for the mean difference between matched pairs. 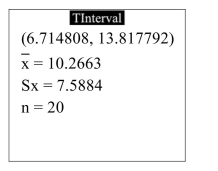 Fill in the blanks: We are 95% confident that the mean difference is between ______ and ______.
A) 0, 10.2663
B) 6.714808, 13.817792
C) 2.6779, 17.8547
D) 0, 20
Fill in the blanks: We are 95% confident that the mean difference is between ______ and ______.A) 0, 10.2663
B) 6.714808, 13.817792
C) 2.6779, 17.8547
D) 0, 20

Unlock Deck
Sign up to unlock the cards in this deck!
Unlock Deck
Unlock Deck
1/44
Play
Full screen (f)
Deck 10: Two-Sample Confidence Intervals
1
A sample of students is enrolled in an online statistics class, and another sample is enrolled in a traditional statistics class. At the end of the semester, the students are given a test. The scores from
Each sample are compared to determine which class was more effective. Are these samples
Independent or paired?
A) Independent
B) Paired
Each sample are compared to determine which class was more effective. Are these samples
Independent or paired?
A) Independent
B) Paired
Independent
2
A sample of students is enrolled in a speed-reading class. Each takes a reading test before and after the class. The two samples of scores are compared to determine how large an improvement in
Reading speed occurred. Are these samples independent or paired?
A) Independent
B) Paired
Reading speed occurred. Are these samples independent or paired?
A) Independent
B) Paired
Paired
3
A survey of college students reported that in a sample of 442 male students, the average number of energy drinks consumed per month was 1.82 with a standard deviation of 4.84, and in a sample of
80 female students, the average was 1.89 with a standard deviation of 3.26.
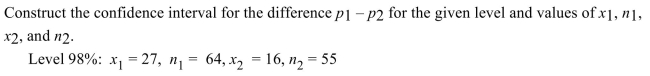
Construct a 98% confidence interval for the difference between men and women in the mean number
Of energy drinks consumed. Based on your results, is it reasonable to believe that the mean number
Of energy drinks consumed may be the same for both male and female students?
A) No
B) Yes
80 female students, the average was 1.89 with a standard deviation of 3.26.
Construct a 98% confidence interval for the difference between men and women in the mean number
Of energy drinks consumed. Based on your results, is it reasonable to believe that the mean number
Of energy drinks consumed may be the same for both male and female students?
A) No
B) Yes
Yes
4
A survey of college students reported that in a sample of 371 male students, the average number of energy drinks consumed per month was 2.47 with a standard deviation of 4.70, and in a sample of
282 female students, the average was 1.45 with a standard deviation of 3.12.
Construct a 98% confidence interval for the difference between men and women in the mean number
Of energy drinks consumed.
A) (-5.40, 7.44)
B) (0.21, 1.83)
C) (0.26, 1.78)
D) (0.31, 1.73)
282 female students, the average was 1.45 with a standard deviation of 3.12.
Construct a 98% confidence interval for the difference between men and women in the mean number
Of energy drinks consumed.
A) (-5.40, 7.44)
B) (0.21, 1.83)
C) (0.26, 1.78)
D) (0.31, 1.73)
Unlock Deck
Unlock for access to all 44 flashcards in this deck.
Unlock Deck
k this deck
5
In an agricultural experiment, the effects of two fertilizers on the production of oranges were measured. Fourteen randomly selected plots of land were treated with fertilizer A, and 10 randomly
Selected plots were treated with fertilizer B. The number of pounds of harvested fruit was measured
From each plot. Following are the results. Assume that the populations are approximately normal. Construct a 95% confidence interval for the
Difference between the mean yields for the two types of fertilizer.
A) (20.3, 64.6)
B) (16.4, 68.6)
C) (14.0, 70.9)
D) (19.0, 65.9)
Selected plots were treated with fertilizer B. The number of pounds of harvested fruit was measured
From each plot. Following are the results.
Assume that the populations are approximately normal. Construct a 95% confidence interval for theDifference between the mean yields for the two types of fertilizer.
A) (20.3, 64.6)
B) (16.4, 68.6)
C) (14.0, 70.9)
D) (19.0, 65.9)
Unlock Deck
Unlock for access to all 44 flashcards in this deck.
Unlock Deck
k this deck
6
The following MINITAB output display presents a 95% confidence interval for the difference between two means.
A) 26
B) 13.847
C) 28
D) 35.992
A) 26
B) 13.847
C) 28
D) 35.992
Unlock Deck
Unlock for access to all 44 flashcards in this deck.
Unlock Deck
k this deck
7
The concentration of hexane (a common solvent) was measured in units of micrograms per liter for a simple random sample of twelve specimens of untreated ground water taken near a municipal
Landfill. The sample mean was 720.2 with a sample standard deviation of 8.8. Eleven specimens of
Treated ground water had an average hexane concentration of 695.1 with a standard deviation of 9.1.
It is reasonable to assume that both samples come from populations that are approximately normal. Construct
A 90% confidence interval for the reduction of hexane concentration after treatment.
A) (23.6, 26.6)
B) (18.3, 31.9)
C) (21.8, 28.4)
D) (22.2, 28.0)
Unlock Deck
Unlock for access to all 44 flashcards in this deck.
Unlock Deck
k this deck
8
The following display from a TI-84 Plus calculator presents a 95% confidence interval for the difference between two means. The sample sizes are
A) 123.288
B) 40.864
C) 42.032
D) -1.557
A) 123.288
B) 40.864
C) 42.032
D) -1.557
Unlock Deck
Unlock for access to all 44 flashcards in this deck.
Unlock Deck
k this deck
9
Using technology, solve the following problem: An amateur golfer wishes to determine if there is a difference between the drive distances of her two favorite drivers. (A driver is a specialized club for
Driving the golf ball down range.) She hits fourteen balls with driver A and 10 balls with driver B. The drive
Distances (in yards) for the trials are show below. Assume that the populations are approximately normal. Construct a 95% confidence interval for the
Difference between the mean drive distances for the two drivers.
A) (-31.88, 17.22)
B) (-37.24, 22.58)
C) (1,016.33, 296.53)
D) (1,386.82, 509.86)
Driving the golf ball down range.) She hits fourteen balls with driver A and 10 balls with driver B. The drive
Distances (in yards) for the trials are show below.
Assume that the populations are approximately normal. Construct a 95% confidence interval for theDifference between the mean drive distances for the two drivers.
A) (-31.88, 17.22)
B) (-37.24, 22.58)
C) (1,016.33, 296.53)
D) (1,386.82, 509.86)
Unlock Deck
Unlock for access to all 44 flashcards in this deck.
Unlock Deck
k this deck
10
An amateur golfer wishes to determine if there is a difference between the drive distances of her two favorite drivers. (A driver is a specialized club for driving the golf ball down range.) She hits fourteen balls
With driver A and 10 balls with driver B. The drive distances (in yards) for the trials are show below. Assume that the populations are approximately normal. Construct a 90% confidence interval for the
Difference between the mean drive distances for the two drivers.
A) (-13.5, 24.1)
B) (-12.6, 23.2)
C) (-9.9, 20.5)
D) (-11.0, 21.6)
With driver A and 10 balls with driver B. The drive distances (in yards) for the trials are show below.
Assume that the populations are approximately normal. Construct a 90% confidence interval for theDifference between the mean drive distances for the two drivers.
A) (-13.5, 24.1)
B) (-12.6, 23.2)
C) (-9.9, 20.5)
D) (-11.0, 21.6)
Unlock Deck
Unlock for access to all 44 flashcards in this deck.
Unlock Deck
k this deck
11
In an agricultural experiment, the effects of two fertilizers on the production of oranges were measured. Fourteen randomly selected plots of land were treated with fertilizer A, and 10 randomly
Selected plots were treated with fertilizer B. The number of pounds of harvested fruit was measured
From each plot. Following are the results. Assume that the populations are approximately normal. Construct a 95% confidence interval for the
Difference between the mean yields for the two types of fertilizer. Based on your results, is it
Reasonable to conclude that the mean yields may be the same for fertilizers A and B?
A) Yes
B) No
Selected plots were treated with fertilizer B. The number of pounds of harvested fruit was measured
From each plot. Following are the results.
Assume that the populations are approximately normal. Construct a 95% confidence interval for theDifference between the mean yields for the two types of fertilizer. Based on your results, is it
Reasonable to conclude that the mean yields may be the same for fertilizers A and B?
A) Yes
B) No
Unlock Deck
Unlock for access to all 44 flashcards in this deck.
Unlock Deck
k this deck
12
Using technology, solve the following problem: In an agricultural experiment, the effects of two fertilizers on the production of oranges were measured. Fourteen randomly selected plots of land
Were treated with fertilizer A, and 10 randomly selected plots were treated with fertilizer B. The
Number of pounds of harvested fruit was measured from each plot. Following are the results. Assume that the populations are approximately normal. Construct a 98% confidence interval for the
Difference between the mean yields for the two types of fertilizer.
A) (80.766, 6,763.582)
B) (8.987, 82.241)
C) (19.740, 7,531.810)
D) (4.443, 86.786)
Were treated with fertilizer A, and 10 randomly selected plots were treated with fertilizer B. The
Number of pounds of harvested fruit was measured from each plot. Following are the results.
Assume that the populations are approximately normal. Construct a 98% confidence interval for theDifference between the mean yields for the two types of fertilizer.
A) (80.766, 6,763.582)
B) (8.987, 82.241)
C) (19.740, 7,531.810)
D) (4.443, 86.786)
Unlock Deck
Unlock for access to all 44 flashcards in this deck.
Unlock Deck
k this deck
13
How many degrees of freedom did the calculator use?A) -0.439
B) -41.874
C) 19.678187
D) 80.827
Unlock Deck
Unlock for access to all 44 flashcards in this deck.
Unlock Deck
k this deck
14
An amateur golfer wishes to determine if there is a difference between the drive distances of her two favorite drivers. (A driver is a specialized club for driving the golf ball down range.) She hits fourteen balls
With driver A and 10 balls with driver B. The drive distances (in yards) for the trials are show below. Assume that the populations are approximately normal. Construct a 98% confidence interval for the
Difference between the mean drive distances for the two drivers. Based on your results, is it
Reasonable to conclude that the mean drive distances may be the same for drivers A and B?
A) Yes
B) No
With driver A and 10 balls with driver B. The drive distances (in yards) for the trials are show below.
Assume that the populations are approximately normal. Construct a 98% confidence interval for theDifference between the mean drive distances for the two drivers. Based on your results, is it
Reasonable to conclude that the mean drive distances may be the same for drivers A and B?
A) Yes
B) No
Unlock Deck
Unlock for access to all 44 flashcards in this deck.
Unlock Deck
k this deck
15
The following MINITAB output display presents a 95% confidence interval for the difference between two means.
A) -34.409
B) 89.948
C) 13
D) -48.804
A) -34.409
B) 89.948
C) 13
D) -48.804
Unlock Deck
Unlock for access to all 44 flashcards in this deck.
Unlock Deck
k this deck
16
Using technology, solve the following problem: The concentration of hexane (a common solvent) was measured in units of micrograms per liter for a simple random sample of fourteen specimens of
Untreated ground water taken near a municipal landfill. The sample mean was 241.8 with a sample
Standard deviation of 8.8. Ten specimens of treated ground water had an average hexane
Concentration of 149.5 with a standard deviation of 7.4.
It is reasonable to assume that both samples come from populations that are approximately normal. Construct
A 95% confidence interval for the reduction of hexane concentration after treatment.
A) (9.242, 9.960)
B) (85.407, 99.193)
C) (86.595, 98.005)
D) (9.306, 9.900)
Unlock Deck
Unlock for access to all 44 flashcards in this deck.
Unlock Deck
k this deck
17
Fill in the blanks: We are 95% confident that the difference between the means is between _________ and _________.A) 22.420, 26.525
B) 110.794, 160.497
C) 0, 13.038055
D) -71.757, -27.649
Unlock Deck
Unlock for access to all 44 flashcards in this deck.
Unlock Deck
k this deck
18
Using technology, solve the following problem: A survey of college students reported that in a sample of 442 male students, the average number of energy drinks consumed per month was 2.39
With a standard deviation of 4.92, and in a sample of 77 female students, the average was 1.53 with
A standard deviation of 3.07.
Construct a 90% confidence interval for the difference between men and women in the mean number
Of energy drinks consumed.
A) (-5.5932, 7.3132)
B) (0.0707, 1.6493)
C) (0.1122, 1.6078)
D) (0.1676, 1.5524)
Unlock Deck
Unlock for access to all 44 flashcards in this deck.
Unlock Deck
k this deck
19
A) (2.869, 0.666)
B) (-0.444, 7.444)
C) (-1.271, 8.271)
D) (-1.232, 8.231)
Unlock Deck
Unlock for access to all 44 flashcards in this deck.
Unlock Deck
k this deck
20
A) (9.0, 15.8)
B) (10.3, 14.5)
C) (7.2, 17.6)
D) (10.8, 14.0)
Unlock Deck
Unlock for access to all 44 flashcards in this deck.
Unlock Deck
k this deck
21
Traffic engineers compared rates of traffic collisions at intersections with raised medians and rates at intersections with two-way left-turn lanes. They found that out of 4,653 collisions at intersections
With raised medians, 2,289 were rear-end collisions, and out of 4,606 collisions at two-way left-turn
Lanes, 2,027 were rear-end collisions.
Assuming these to be random samples of collisions from the two types of intersections, construct a 95%
Confidence interval for the difference between the proportions of collisions that are of the rear-end
Type at the two types of intersection.
A) (0.032, 0.072)
B) (0.042, 0.061)
C) (0.472, 0.512)
D) (0.492, 0.440)
Unlock Deck
Unlock for access to all 44 flashcards in this deck.
Unlock Deck
k this deck
22
Traffic engineers compared rates of traffic collisions at intersections with raised medians and rates at intersections with two-way left-turn lanes. They found that out of 4,512 collisions at intersections
With raised medians, 2,202 were rear-end collisions, and out of 4,277 collisions at two-way left-turn
Lanes, 1,903 were rear-end collisions.
Assuming these to be random samples of collisions from the two types of intersections, construct a 95%
Confidence interval for the difference between the proportions of collisions that are of the rear-end
Type at the two types of intersection. Does the confidence interval contradict the claim that the
Proportion of rear-end collisions is the same at both types of intersection?
A) No
B) Yes
Unlock Deck
Unlock for access to all 44 flashcards in this deck.
Unlock Deck
k this deck
23
The following display from a TI-84 Plus calculator presents a 95% confidence interval for the mean difference between matched pairs. How many degrees of freedom are there?
A) 16
B) 6.8168
C) 17
D) 2.4052
How many degrees of freedom are there?A) 16
B) 6.8168
C) 17
D) 2.4052
Unlock Deck
Unlock for access to all 44 flashcards in this deck.
Unlock Deck
k this deck
24
In a random sample of 70 patients undergoing a standard surgical procedure, 16 required medication for postoperative pain. In a random sample of 85 patients undergoing a new procedure, only 17
Required medication.
Construct a 98% confidence interval for the difference in the proportions of patients needing pain
Medication between the old and new procedures. A physician claims that the proportion of patients
Who need pain medication is the same for both procedures. Does the confidence interval contradict
The claim?
A) No
B) Yes
Unlock Deck
Unlock for access to all 44 flashcards in this deck.
Unlock Deck
k this deck
25
Two microprocessors are compared on a sample of 6 benchmark codes to determine whether there is a difference in speed. The times (in seconds) used by each processor on each code are given below: An electronics engineer claims that the mean speed is the same for both processors. Does
The 99% confidence interval contradict this claim? (Hint: First find the 99% confidence interval for
The difference between the mean speeds.)
A) No
B) Yes
An electronics engineer claims that the mean speed is the same for both processors. DoesThe 99% confidence interval contradict this claim? (Hint: First find the 99% confidence interval for
The difference between the mean speeds.)
A) No
B) Yes
Unlock Deck
Unlock for access to all 44 flashcards in this deck.
Unlock Deck
k this deck
26
Two microprocessors are compared on a sample of 6 benchmark codes to determine whether there is a difference in speed. The times (in seconds) used by each processor on each code are given below: Find the 95% confidence interval for the difference between the mean speeds.
A) (-3.61, 8.14)
B) (-3.92, 8.45)
C) (-2.98, 7.51)
D) (-3.19, 7.72)
Find the 95% confidence interval for the difference between the mean speeds.A) (-3.61, 8.14)
B) (-3.92, 8.45)
C) (-2.98, 7.51)
D) (-3.19, 7.72)
Unlock Deck
Unlock for access to all 44 flashcards in this deck.
Unlock Deck
k this deck
27
A group of six individuals with high cholesterol levels were given a new diet designed to lower cholesterol levels. Cholesterol levels, in milligrams per deciliter, were measured before and after the
Implementation of the diet for each individual, with the following results: Find the 98% confidence interval for the mean reduction in cholesterol level.
A) (15.23, 59.77)
B) (17.85, 58.83)
C) (16.17, 15.23)
D) (18.79, 56.21)
Implementation of the diet for each individual, with the following results:
Find the 98% confidence interval for the mean reduction in cholesterol level.A) (15.23, 59.77)
B) (17.85, 58.83)
C) (16.17, 15.23)
D) (18.79, 56.21)
Unlock Deck
Unlock for access to all 44 flashcards in this deck.
Unlock Deck
k this deck
28
A group of six individuals with high blood pressure volunteered to test whether petting cats for 10 minutes can alter systolic blood pressure levels. Systolic blood pressures (in millimeters of mercury,
Or mmHg) were measured for each subject before and after petting cats for 10 minutes, with the
Following results: A researcher claims that the mean reduction in systolic blood pressure is 14 mmHg. Does the 98%
Confidence interval contradict this claim? (Hint: you need to find the 98% confidence interval for
The mean reduction in systolic blood pressure.)
A) No
B) Yes
Or mmHg) were measured for each subject before and after petting cats for 10 minutes, with the
Following results:
A researcher claims that the mean reduction in systolic blood pressure is 14 mmHg. Does the 98%Confidence interval contradict this claim? (Hint: you need to find the 98% confidence interval for
The mean reduction in systolic blood pressure.)
A) No
B) Yes
Unlock Deck
Unlock for access to all 44 flashcards in this deck.
Unlock Deck
k this deck
29
A computer software magazine compares the rates of malware infection for computers protected by security software A with the rates of infection for computers protected by security software B.
They found that out of 787 computers with security software A, 72 became infected with some type of
Malware after 1000 hours of internet interaction. For security software B, 37 out of 834 computers
Became infected after 1000 hours of internet interaction.
Assuming these to be random samples of infection rates for the two security software packages, construct a
98% confidence interval for the difference between the proportions of infection for the two types of
Security software packages. Does the confidence interval contradict the claim that the proportion of
Infections is the same for the two types of security software?
A) Yes
B) No
Unlock Deck
Unlock for access to all 44 flashcards in this deck.
Unlock Deck
k this deck
30
A) (-0.048, 0.310)
B) (-0.063, 0.325)
C) (-0.038, 0.300)
D) (-0.054, 0.316)
Unlock Deck
Unlock for access to all 44 flashcards in this deck.
Unlock Deck
k this deck
31
The following display from a TI-84 Plus calculator presents a 95% confidence interval for the mean difference between matched pairs. What is the point estimate of ?
A) 7.00973
B) 17
C) 2.4052
D) 6.8168
What is the point estimate of ?A) 7.00973
B) 17
C) 2.4052
D) 6.8168
Unlock Deck
Unlock for access to all 44 flashcards in this deck.
Unlock Deck
k this deck
32
The following MINITAB output display presents a 95% confidence interval for the difference between two proportions.
A) -0.123422
B) 0.215778
C) 0.108
D) 0.057
A) -0.123422
B) 0.215778
C) 0.108
D) 0.057
Unlock Deck
Unlock for access to all 44 flashcards in this deck.
Unlock Deck
k this deck
33
The following MINITAB output display presents a 95% confidence interval for the difference between two means. Fill in the blanks: We are 95% confident that the difference in the means is between ______
And ______.
A) 9, 15
B) 144.384, 168.966
C) 0, 19
D) -44.197, -4.967
Fill in the blanks: We are 95% confident that the difference in the means is between ______And ______.
A) 9, 15
B) 144.384, 168.966
C) 0, 19
D) -44.197, -4.967
Unlock Deck
Unlock for access to all 44 flashcards in this deck.
Unlock Deck
k this deck
34
A group of six individuals with high blood pressure volunteered to test whether petting cats for 10 minutes can alter systolic blood pressure levels. Systolic blood pressures (in millimeters of mercury,
Or mmHg) were measured for each subject before and after petting cats for 10 minutes, with the
Following results: Find the 99% confidence interval for the mean reduction in systolic blood pressure.
A) (-47.97, 40.97)
B) (-56.42, 49.42)
C) (-49.31, 46.75)
D) (-53.75, -56.42)
Or mmHg) were measured for each subject before and after petting cats for 10 minutes, with the
Following results:
Find the 99% confidence interval for the mean reduction in systolic blood pressure.A) (-47.97, 40.97)
B) (-56.42, 49.42)
C) (-49.31, 46.75)
D) (-53.75, -56.42)
Unlock Deck
Unlock for access to all 44 flashcards in this deck.
Unlock Deck
k this deck
35
In a random sample of 65 patients undergoing a standard surgical procedure, 12 required medication for postoperative pain. In a random sample of 90 patients undergoing a new procedure, only 14
Required medication.
Construct a 98% confidence interval for the difference in the proportions of patients needing pain
Medication between the old and new procedures.
A) (-0.003, 0.061)
B) (0.185, 0.156)
C) (0.042, 0.328)
D) (-0.114, 0.172)
Required medication.
Construct a 98% confidence interval for the difference in the proportions of patients needing pain
Medication between the old and new procedures.
A) (-0.003, 0.061)
B) (0.185, 0.156)
C) (0.042, 0.328)
D) (-0.114, 0.172)
Unlock Deck
Unlock for access to all 44 flashcards in this deck.
Unlock Deck
k this deck
36
The following MINITAB output display presents a 95% confidence interval for the difference between two proportions. Fill in the blanks: We are 95% confident that the difference between the proportions is between ______ and
______.
A) 0, 0.040462
B) 0.18007, 0.220532
C) 526, 572
D) -0.014, 0.095
Fill in the blanks: We are 95% confident that the difference between the proportions is between ______ and______.
A) 0, 0.040462
B) 0.18007, 0.220532
C) 526, 572
D) -0.014, 0.095
Unlock Deck
Unlock for access to all 44 flashcards in this deck.
Unlock Deck
k this deck
37
A computer software magazine compares the rates of malware infection for computers protected by security software A with the rates of infection for computers protected by security software B.
They found that out of 794 computers with security software A, 24 became infected with some type of
Malware after 1000 hours of internet interaction. For security software B, 47 out of 522 computers
Became infected after 1000 hours of internet interaction.
Assuming these to be random samples of infection rates for the two security software packages, construct a
95% confidence interval for the difference between the proportions of infection for the two types of
Security software packages.
A) (-0.083, -0.037)
B) (-0.086, -0.034)
C) (-0.085, -0.035)
D) (-0.087, -0.033)
Unlock Deck
Unlock for access to all 44 flashcards in this deck.
Unlock Deck
k this deck
38
The following display from a TI-84 Plus calculator presents a 95% confidence interval for the difference between two proportions. Compute the point estimate of
A) -0.004832
B) 0.062
C) 1,851
D) 91
Compute the point estimate of A) -0.004832
B) 0.062
C) 1,851
D) 91
Unlock Deck
Unlock for access to all 44 flashcards in this deck.
Unlock Deck
k this deck
39
A group of six individuals with high cholesterol levels were given a new diet designed to lower cholesterol levels. Cholesterol levels, in milligrams per deciliter, were measured before and after the
Implementation of the diet for each individual, with the following results: A dietician claims that the mean reduction in cholesterol level is 51 milligrams per deciliter. Does the
98% confidence interval contradict this claim? (Hint: you need to find the 98% confidence interval
For the mean reduction in cholesterol level.)
A) No
B) Yes
Implementation of the diet for each individual, with the following results:
A dietician claims that the mean reduction in cholesterol level is 51 milligrams per deciliter. Does the98% confidence interval contradict this claim? (Hint: you need to find the 98% confidence interval
For the mean reduction in cholesterol level.)
A) No
B) Yes
Unlock Deck
Unlock for access to all 44 flashcards in this deck.
Unlock Deck
k this deck
40
The following display from a TI-84 Plus calculator presents a 95% confidence interval for the difference between two proportions. Fill in the blanks: We are 95% confident that the difference between two proportions is between _______ and
_______.
A) -0.032, 0.028
B) 0, 1,455
C) 0.138399, 0.140669
D) 718, 737
Fill in the blanks: We are 95% confident that the difference between two proportions is between _______ and_______.
A) -0.032, 0.028
B) 0, 1,455
C) 0.138399, 0.140669
D) 718, 737
Unlock Deck
Unlock for access to all 44 flashcards in this deck.
Unlock Deck
k this deck
41
The following output from MINITAB presents a confidence interval for the mean difference between matched pairs.
A) 3.2282, 8.84
B) 0.724738, 2.8059
C) 0, 6.0341
D) 4.4797, 7.5885
A) 3.2282, 8.84
B) 0.724738, 2.8059
C) 0, 6.0341
D) 4.4797, 7.5885
Unlock Deck
Unlock for access to all 44 flashcards in this deck.
Unlock Deck
k this deck
42
The following output from MINITAB presents a confidence interval for the mean difference between matched pairs.
A) 1.57675
B) 15
C) 4.9474
D) 6.3070
A) 1.57675
B) 15
C) 4.9474
D) 6.3070
Unlock Deck
Unlock for access to all 44 flashcards in this deck.
Unlock Deck
k this deck
43
The following output from MINITAB presents a confidence interval for the mean difference between matched pairs. How many degrees of freedom are there?
A) 13
B) 14
C) 1.9327
D) 7.2315
How many degrees of freedom are there?A) 13
B) 14
C) 1.9327
D) 7.2315
Unlock Deck
Unlock for access to all 44 flashcards in this deck.
Unlock Deck
k this deck
44
The following display from a TI-84 Plus calculator presents a 95% confidence interval for the mean difference between matched pairs. Fill in the blanks: We are 95% confident that the mean difference is between ______ and ______.
A) 0, 10.2663
B) 6.714808, 13.817792
C) 2.6779, 17.8547
D) 0, 20
Fill in the blanks: We are 95% confident that the mean difference is between ______ and ______.A) 0, 10.2663
B) 6.714808, 13.817792
C) 2.6779, 17.8547
D) 0, 20
Unlock Deck
Unlock for access to all 44 flashcards in this deck.
Unlock Deck
k this deck
Unlock Deck
Unlock for access to all 44 flashcards in this deck.


