Deck 6: Normal Probability Distributions
Full screen (f)
Question
Question

Question
Question
Question
Question
Question
Question
Using the following uniform density curve, answer the question. 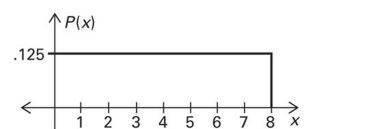 What is the probability that the random variable has a value greater than 5?
A) 0.250
B) 0.500
C) 0.325
D) 0.375
What is the probability that the random variable has a value greater than 5?A) 0.250
B) 0.500
C) 0.325
D) 0.375
Question
Question
Question
Assume that the weight loss for the first month of a diet program varies between 6 pounds and 12 pounds, and is spread evenly over the range of possibilities, so that there is a uniform distribution. Find the probability that
The given range of pounds lost is between 8 pounds and 11 pounds.
The given range of pounds lost is between 8 pounds and 11 pounds.
Question
Question
Question
The distribution of certain test scores is a nonstandard normal distribution with a mean of 50 and a standard deviation of 6. What are the values of the mean and standard deviation after all test scores have been
Standardized by converting them to z-scores using ?
?
A) The mean is 10 and the standard deviation is 100.
B) The mean is 0 and the standard deviation is 1.
C) The mean is 100 and the standard deviation is 10.
D) The mean is 1 and the standard deviation is 0.
Standardized by converting them to z-scores using
?A) The mean is 10 and the standard deviation is 100.
B) The mean is 0 and the standard deviation is 1.
C) The mean is 100 and the standard deviation is 10.
D) The mean is 1 and the standard deviation is 0.
Question
Question
Estimate the indicated probability by using the normal distribution as an approximation to the binomial distribution. Estimate 
A) 0.1015
B) 0.1239
C) 0.8513
D) 0.1958
A) 0.1015
B) 0.1239
C) 0.8513
D) 0.1958
Question
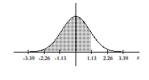
Find the area of the shaded region. The graph depicts the standard normal distribution with mean 0 and standard deviation 1. 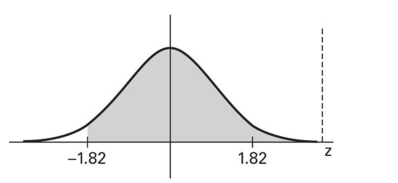
A) 0.0344
B) 0.4656
C) -0.0344
D) 0.9656
A) 0.0344
B) 0.4656
C) -0.0344
D) 0.9656
Question
Question

Question
Question
Find the area of the shaded region. The graph depicts the standard normal distribution with mean 0 and standard deviation 1. 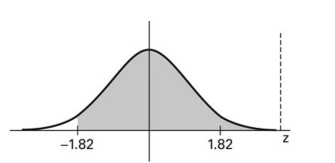
A) 0.4656
B) 0.0344
C) -0.0344
D) 0.9656
A) 0.4656
B) 0.0344
C) -0.0344
D) 0.9656
Question
Question
Question
Scores on a test are normally distributed with a mean of 63.2 and a standard deviation of 11.7. Find  , which separates the bottom 81% from the top 19%.
A) 0.291
B) 66.6
C) 73.5
D) 0.88
, which separates the bottom 81% from the top 19%.A) 0.291
B) 66.6
C) 73.5
D) 0.88
Question
Question
Question
If z is a standard normal variable, find the probability: 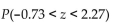
A) 0.4884
B) 0.7557
C) 1.54
D) 0.2211
A) 0.4884
B) 0.7557
C) 1.54
D) 0.2211
Question
Question
Question
Question
Question
Question
Question
Question
Question
Question
In a population of 210 women, the heights of the women are normally distributed with a mean of 64.4 inches and a standard deviation of 2.9 inches. If 36 women are selected at random, find the mean  and standard
Deviation of the population of sample means. Assume that the sampling is done without replacement and
Use a finite population correction factor.
A) 58.8 inches, 2.65 inches
B) 64.4 inches, 2.07 inches
C) 64.4 inches, 2.9 inches
D) 64.4 inches, 0.44 inches
and standardDeviation
of the population of sample means. Assume that the sampling is done without replacement andUse a finite population correction factor.
A) 58.8 inches, 2.65 inches
B) 64.4 inches, 2.07 inches
C) 64.4 inches, 2.9 inches
D) 64.4 inches, 0.44 inches
Question
Assume that the red blood cell counts of women are normally distributed with a mean of 4.577 million cells per microliter and a standard deviation of 0.382 million cells per microliter. Find the 80  percentile for the red
Blood cell counts of women.
A) 4.898 million cells per microliter
B) 4.655 million cells per microliter
C) 4.878 million cells per microliter
percentile for the redBlood cell counts of women.
A) 4.898 million cells per microliter
B) 4.655 million cells per microliter
C) 4.878 million cells per microliter
Question
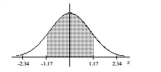
Find the indicated z score. The graph depicts the standard normal distribution with mean 0 and standard deviation 1. Shaded area is 0.4483. 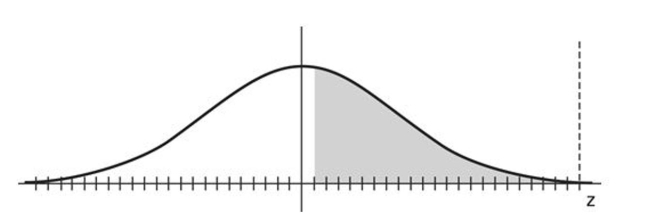
A) 0.3264
B) 0.13
C) 0.6736
D) -0.13
A) 0.3264
B) 0.13
C) 0.6736
D) -0.13
Question
Question
Question
Question
A normal quartile plot is given below for a sample of scores on an aptitude test. Use the plot to assess the
normality of scores on this test. Explain your reasoning.
normality of scores on this test. Explain your reasoning.
Question
You will use a normal distribution to approximate a binomial distribution. Complete the following table for a
distribution in which 16. It might be helpful to make a diagram to help you determine the continuity factor
for each entry.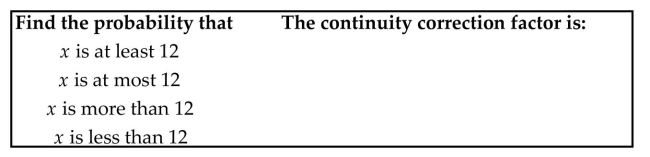
distribution in which
16. It might be helpful to make a diagram to help you determine the continuity factorfor each entry.
Question
Question
Question
Question
A normal quartile plot is given below for the lifetimes (in hours) of a sample of batteries of a particular brand.
Use the plot to assess the normality of the lifetimes of these batteries. Explain your reasoning.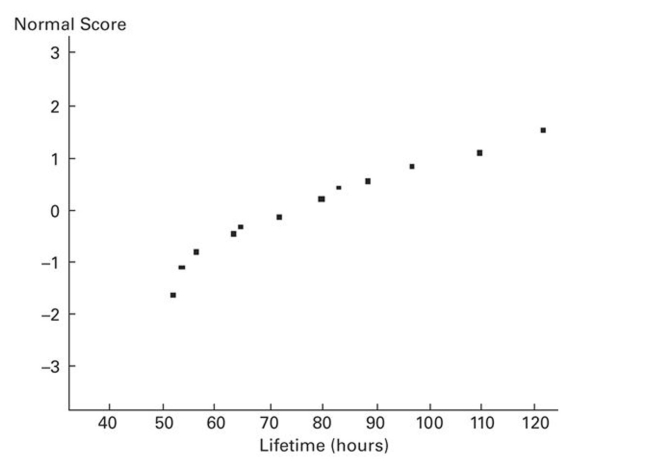
Use the plot to assess the normality of the lifetimes of these batteries. Explain your reasoning.
Question
Question
A normal quartile plot is given below for the weekly incomes (in dollars) of a sample of engineers in one town.
Describe what each x value represents and what each y value represents. Use the plot to assess the normality of
the incomes of engineers in this town. Explain your reasoning.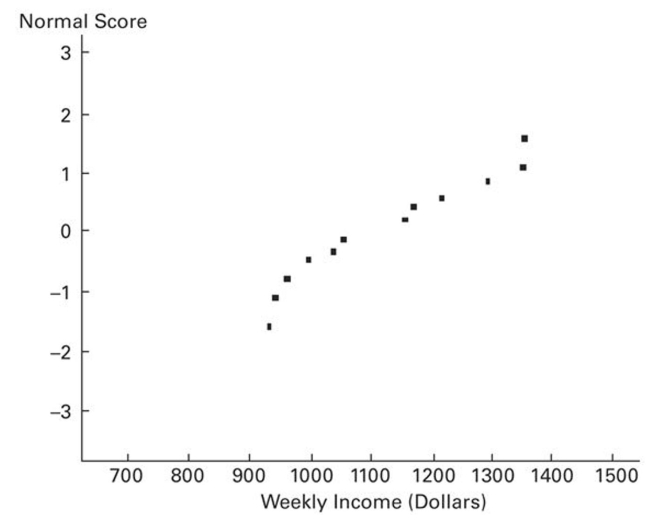
Describe what each x value represents and what each y value represents. Use the plot to assess the normality of
the incomes of engineers in this town. Explain your reasoning.
Question
The population of current statistics students has ages with mean  and standard deviation σ. Samples of
statistics are randomly selected so that there are exactly 40 students in each sample. For each sample, the mean
age is computed. What does the central limit theorem tell us about the distribution of those mean ages?
and standard deviation σ. Samples ofstatistics are randomly selected so that there are exactly 40 students in each sample. For each sample, the mean
age is computed. What does the central limit theorem tell us about the distribution of those mean ages?
Question
Suppose that you wish to find  ) for a continuous uniform distribution having a minimum of -3 and
a maximum of 3. If you incorrectly assume that the distribution is normal instead of uniform, will your answer
be too big, too small, or will you still obtain the correct answer? Explain your thinking.
) for a continuous uniform distribution having a minimum of -3 anda maximum of 3. If you incorrectly assume that the distribution is normal instead of uniform, will your answer
be too big, too small, or will you still obtain the correct answer? Explain your thinking.
Question
Question
Question
Question
Question
Question
Question
Question
Question
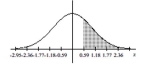
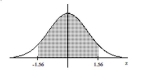
Find the area of the shaded region. The graph depicts the standard normal distribution with mean 0 and standard
deviation 1.
A) 0.8599
B) 0.1401
C) 0.7198
D) 0.2802
deviation 1.
A) 0.8599
B) 0.1401
C) 0.7198
D) 0.2802
Question
Find the indicated z score. The graph depicts the standard normal distribution with mean 0 and standard deviation 1.
Shaded area is 0.4013.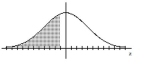
A) 0.25
B) 0.57
C) -0.57
D) -0.25
Shaded area is 0.4013.
A) 0.25
B) 0.57
C) -0.57
D) -0.25
Question
Question
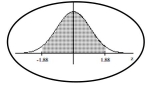
Find the area of the shaded region. The graph depicts the standard normal distribution with mean 0 and standard
deviation 1.
A) 0.2420
B) 0.7580
C) 0.8790
D) 0.1210
deviation 1.
A) 0.2420
B) 0.7580
C) 0.8790
D) 0.1210
Question
Find the area of the shaded region. The graph depicts the standard normal distribution with mean 0 and standard
deviation 1.
A) 0.4656
B) -0.0344
C) 0.9656
D) 0.0344
deviation 1.
A) 0.4656
B) -0.0344
C) 0.9656
D) 0.0344
Question
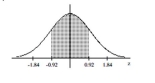
Find the area of the shaded region. The graph depicts the standard normal distribution with mean 0 and standard
deviation 1.
A) 0.2190
B) 0.2224
C) 0.2776
D) 0.7224
deviation 1.
A) 0.2190
B) 0.2224
C) 0.2776
D) 0.7224
Question
Find the area of the shaded region. The graph depicts the standard normal distribution with mean 0 and standard
deviation 1.
A) 0.8907
B) 0.8708
C) 0.1292
D) 0.8485
deviation 1.
A) 0.8907
B) 0.8708
C) 0.1292
D) 0.8485
Question
Find the area of the shaded region. The graph depicts the standard normal distribution with mean 0 and standard
deviation 1.
A) 0.8812
B) 0.9406
C) 0.1188
D) 0.0594
deviation 1.
A) 0.8812
B) 0.9406
C) 0.1188
D) 0.0594
Question
Find the area of the shaded region. The graph depicts the standard normal distribution with mean 0 and standard
deviation 1.
A) 0.9398
B) 0.0301
C) 0.0602
D) 0.9699
deviation 1.
A) 0.9398
B) 0.0301
C) 0.0602
D) 0.9699
Question
Question
Find the area of the shaded region. The graph depicts the standard normal distribution with mean 0 and standard
deviation 1.
A) 0.6424
B) 0.3576
C) 0.8212
D) 0.1788
deviation 1.
A) 0.6424
B) 0.3576
C) 0.8212
D) 0.1788
Question
Assume that the weight loss for the first month of a diet program varies between 6 pounds and 12 pounds, and is spread
evenly over the range of possibilities, so that there is a uniform distribution. Find the probability of the given range of
pounds lost.
Less than 11 pounds
evenly over the range of possibilities, so that there is a uniform distribution. Find the probability of the given range of
pounds lost.
Less than 11 pounds
Question
Assume that the weight loss for the first month of a diet program varies between 6 pounds and 12 pounds, and is spread
evenly over the range of possibilities, so that there is a uniform distribution. Find the probability of the given range of
pounds lost.
Between 8.5 pounds and 10 pounds
evenly over the range of possibilities, so that there is a uniform distribution. Find the probability of the given range of
pounds lost.
Between 8.5 pounds and 10 pounds
Question
Question
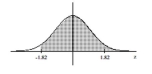
Find the indicated z score. The graph depicts the standard normal distribution with mean 0 and standard deviation 1.
Shaded area is 0.9599.
A) 1.82
B) 1.75
C) 1.03
D) -1.38
Shaded area is 0.9599.
A) 1.82
B) 1.75
C) 1.03
D) -1.38
Question
Question
Assume that the weight loss for the first month of a diet program varies between 6 pounds and 12 pounds, and is spread
evenly over the range of possibilities, so that there is a uniform distribution. Find the probability of the given range of
pounds lost.
Between 8 pounds and 11 pounds
evenly over the range of possibilities, so that there is a uniform distribution. Find the probability of the given range of
pounds lost.
Between 8 pounds and 11 pounds
Question
Question
Assume that the weight loss for the first month of a diet program varies between 6 pounds and 12 pounds, and is spread
evenly over the range of possibilities, so that there is a uniform distribution. Find the probability of the given range of
pounds lost.
More than 10 pounds
evenly over the range of possibilities, so that there is a uniform distribution. Find the probability of the given range of
pounds lost.
More than 10 pounds
Question

Unlock Deck
Sign up to unlock the cards in this deck!
Unlock Deck
Unlock Deck
1/254
Play
Full screen (f)
Deck 6: Normal Probability Distributions
1
The heights of adult females are normally distributed. If you were to construct a histogram of 40 randomly selected women, what shape would the histogram of those heights have and what pattern would you expect in
A normal quantile plot of these data?
A) The histogram would by non-symmetric, and the normal quantile plot would have data points that would be non-linear.
B) The histogram would be approximately bell-shaped, and the normal quantile plot would have data points have follow a straight-line pattern.
C) The histogram would by approximately bell-shaped, and the normal quantile plot would have data points that would be bell-shaped.
D) The histogram would by approximately bell-shaped, and the normal quantile plot would have data points that would be non-linear.
B
2
A
3
If a sample size is < ________, the sample size must come from a population having a normal distribution in order to follow normal distribution calculations.
A) 100
B) 50
C) 40
D) 30
A) 100
B) 50
C) 40
D) 30
D
4
The given values are discrete. Use the continuity correction and describe the region of the normal distribution that corresponds to the indicated probability. The probability of exactly 44 green marbles
A) The area between 44 and 44.5
B) The area between 43.5 and 45.5
C) The area between 43.5 and 44
D) The area between 43.5 and 44.5
A) The area between 44 and 44.5
B) The area between 43.5 and 45.5
C) The area between 43.5 and 44
D) The area between 43.5 and 44.5
Unlock Deck
Unlock for access to all 254 flashcards in this deck.
Unlock Deck
k this deck
5
Estimate the probability of getting exactly 43 boys in 90 births. Estimate the indicated probability by using the normal distribution as an approximation to the binomial distribution.
A) 0.0764
B) 0.0159
C) 0.0729
D) 0.1628
A) 0.0764
B) 0.0159
C) 0.0729
D) 0.1628
Unlock Deck
Unlock for access to all 254 flashcards in this deck.
Unlock Deck
k this deck
6
For women aged 18-24, systolic blood pressures are normally distributed with a mean of 114.8 mm Hg and a standard deviation of 13.1 mm Hg. If 23 women aged 18-24 are randomly selected, find the probability that
Their mean systolic blood pressure is between 119 and 122 mm Hg.
A) 0.0833
B) 0.9341
C) 0.3343
D) 0.0577
Their mean systolic blood pressure is between 119 and 122 mm Hg.
A) 0.0833
B) 0.9341
C) 0.3343
D) 0.0577
Unlock Deck
Unlock for access to all 254 flashcards in this deck.
Unlock Deck
k this deck
7
If z is a standard normal variable, find the probability that z lies between -2.41 and 0.
A) 0.4910
B) 0.0948
C) 0.4920
D) 0.5080
A) 0.4910
B) 0.0948
C) 0.4920
D) 0.5080
Unlock Deck
Unlock for access to all 254 flashcards in this deck.
Unlock Deck
k this deck
8
Using the following uniform density curve, answer the question. What is the probability that the random variable has a value greater than 5?
A) 0.250
B) 0.500
C) 0.325
D) 0.375
What is the probability that the random variable has a value greater than 5?A) 0.250
B) 0.500
C) 0.325
D) 0.375
Unlock Deck
Unlock for access to all 254 flashcards in this deck.
Unlock Deck
k this deck
9
Scores on a test have a mean of 70 and Q3 is 83. The scores have a distribution that is approximately normal. Find P90. (You will need to first find the standard deviation.)
A) 94.8
B) 92.9
C) 93.7
D) 95.6
A) 94.8
B) 92.9
C) 93.7
D) 95.6
Unlock Deck
Unlock for access to all 254 flashcards in this deck.
Unlock Deck
k this deck
10
The continuity correction is used to compensate for the fact that a ________ distribution is used to approximate a ________ distribution.
A) discrete; uniform
B) discrete; continuous
C) binomial; uniform
D) continuous; discrete
A) discrete; uniform
B) discrete; continuous
C) binomial; uniform
D) continuous; discrete
Unlock Deck
Unlock for access to all 254 flashcards in this deck.
Unlock Deck
k this deck
11
Assume that the weight loss for the first month of a diet program varies between 6 pounds and 12 pounds, and is spread evenly over the range of possibilities, so that there is a uniform distribution. Find the probability that
The given range of pounds lost is between 8 pounds and 11 pounds.
The given range of pounds lost is between 8 pounds and 11 pounds.
Unlock Deck
Unlock for access to all 254 flashcards in this deck.
Unlock Deck
k this deck
12
Find the probability that in 200 tosses of a fair die, we will obtain at most 30 fives. Use the normal distribution to approximate the desired probability.
A) 0.4936
B) 0.2946
C) 0.1871
D) 0.3229
A) 0.4936
B) 0.2946
C) 0.1871
D) 0.3229
Unlock Deck
Unlock for access to all 254 flashcards in this deck.
Unlock Deck
k this deck
13
A study of the amount of time it takes a mechanic to rebuild the transmission for a 2010 Chevrolet Colorado shows that the mean is 8.4 hours and the standard deviation is 1.8 hours. If 40 mechanics are randomly selected,
Find the probability that their mean rebuild time is less than 8.9 hours.
A) 0.4276
B) 0.9589
C) 0.9756
D) 0.9608
Find the probability that their mean rebuild time is less than 8.9 hours.
A) 0.4276
B) 0.9589
C) 0.9756
D) 0.9608
Unlock Deck
Unlock for access to all 254 flashcards in this deck.
Unlock Deck
k this deck
14
The distribution of certain test scores is a nonstandard normal distribution with a mean of 50 and a standard deviation of 6. What are the values of the mean and standard deviation after all test scores have been
Standardized by converting them to z-scores using ?
A) The mean is 10 and the standard deviation is 100.
B) The mean is 0 and the standard deviation is 1.
C) The mean is 100 and the standard deviation is 10.
D) The mean is 1 and the standard deviation is 0.
Standardized by converting them to z-scores using
?A) The mean is 10 and the standard deviation is 100.
B) The mean is 0 and the standard deviation is 1.
C) The mean is 100 and the standard deviation is 10.
D) The mean is 1 and the standard deviation is 0.
Unlock Deck
Unlock for access to all 254 flashcards in this deck.
Unlock Deck
k this deck
15
If a histogram of a sample of men's ages is skewed, what do you expect to see in the normal quantile plot?
A) Points are following a straight-line pattern.
B) Points are not following a straight-line pattern.
A) Points are following a straight-line pattern.
B) Points are not following a straight-line pattern.
Unlock Deck
Unlock for access to all 254 flashcards in this deck.
Unlock Deck
k this deck
16
Estimate the indicated probability by using the normal distribution as an approximation to the binomial distribution. Estimate
A) 0.1015
B) 0.1239
C) 0.8513
D) 0.1958
A) 0.1015
B) 0.1239
C) 0.8513
D) 0.1958
Unlock Deck
Unlock for access to all 254 flashcards in this deck.
Unlock Deck
k this deck
17
Find the area of the shaded region. The graph depicts the standard normal distribution with mean 0 and standard deviation 1.
A) 0.0344
B) 0.4656
C) -0.0344
D) 0.9656
A) 0.0344
B) 0.4656
C) -0.0344
D) 0.9656
Unlock Deck
Unlock for access to all 254 flashcards in this deck.
Unlock Deck
k this deck
18
The lengths of human pregnancies are normally distributed with a mean of 268 days and a standard deviation of 15 days. What is the probability that a pregnancy last at least 300 days?
A) 0.0166
B) 0.4834
C) 0.9834
D) 0.0179
A) 0.0166
B) 0.4834
C) 0.9834
D) 0.0179
Unlock Deck
Unlock for access to all 254 flashcards in this deck.
Unlock Deck
k this deck
19
Unlock Deck
Unlock for access to all 254 flashcards in this deck.
Unlock Deck
k this deck
20
Unlock Deck
Unlock for access to all 254 flashcards in this deck.
Unlock Deck
k this deck
21
Find the area of the shaded region. The graph depicts the standard normal distribution with mean 0 and standard deviation 1.
A) 0.4656
B) 0.0344
C) -0.0344
D) 0.9656
A) 0.4656
B) 0.0344
C) -0.0344
D) 0.9656
Unlock Deck
Unlock for access to all 254 flashcards in this deck.
Unlock Deck
k this deck
22
An unbiased estimator is a statistic that targets the value of the of the population parameter such that the sampling distribution of the statistic has a ________ equal to the ________ of the corresponding parameter.
A) range; range/4
B) mean; standard deviation
C) mean; mean
D) standard deviation; standard deviation
A) range; range/4
B) mean; standard deviation
C) mean; mean
D) standard deviation; standard deviation
Unlock Deck
Unlock for access to all 254 flashcards in this deck.
Unlock Deck
k this deck
23
A baseball player has a batting average of 0.346, so the probability of a hit is 0.346. Assume that his hitting attempts are independent of each other. Assume that the batter gets up to bat 4 times in each game. Estimate the
Probability that in 50 consecutive games, there are at least 45 games in which the batter gets at least one hit.
(Hint: first find the probability that in one game the batter gets at least one hit)
A) 0.0918
B) 0.0446
C) 0.8171
D) 0.0643
Probability that in 50 consecutive games, there are at least 45 games in which the batter gets at least one hit.
(Hint: first find the probability that in one game the batter gets at least one hit)
A) 0.0918
B) 0.0446
C) 0.8171
D) 0.0643
Unlock Deck
Unlock for access to all 254 flashcards in this deck.
Unlock Deck
k this deck
24
Scores on a test are normally distributed with a mean of 63.2 and a standard deviation of 11.7. Find , which separates the bottom 81% from the top 19%.
A) 0.291
B) 66.6
C) 73.5
D) 0.88
, which separates the bottom 81% from the top 19%.A) 0.291
B) 66.6
C) 73.5
D) 0.88
Unlock Deck
Unlock for access to all 254 flashcards in this deck.
Unlock Deck
k this deck
25
In one region, the September energy consumption levels for single -family homes are found to be normally distributed with a mean of 1050 kWh and a standard deviation of 218 kWh. For a randomly selected home, find
The probability that the September energy consumption level is between 1100 kWh and 1225 kWh.
A) 0.2881
B) 0.0910
C) 0.3791
D) 0.1971
The probability that the September energy consumption level is between 1100 kWh and 1225 kWh.
A) 0.2881
B) 0.0910
C) 0.3791
D) 0.1971
Unlock Deck
Unlock for access to all 254 flashcards in this deck.
Unlock Deck
k this deck
26
A coin is tossed 20 times. A person who claims to have extrasensory perception is asked to predict the outcome of each flip in advance. She predicts correctly on 14 tosses. What is the probability of being correct 14 or more
Times by guessing? Does this probability seem to verify her claim? Use the normal distribution to approximate
The desired probability.
A) 0.0582, no
B) 0.4418, no
C) 0.4418, yes
D) 0.0582, yes
Times by guessing? Does this probability seem to verify her claim? Use the normal distribution to approximate
The desired probability.
A) 0.0582, no
B) 0.4418, no
C) 0.4418, yes
D) 0.0582, yes
Unlock Deck
Unlock for access to all 254 flashcards in this deck.
Unlock Deck
k this deck
27
If z is a standard normal variable, find the probability:
A) 0.4884
B) 0.7557
C) 1.54
D) 0.2211
A) 0.4884
B) 0.7557
C) 1.54
D) 0.2211
Unlock Deck
Unlock for access to all 254 flashcards in this deck.
Unlock Deck
k this deck
28
The probability that a radish seed will germinate is 0.7. Estimate the probability that of 140 randomly selected seeds, exactly 100 will germinate.
A) 0.0679
B) 0.9331
C) 0.0769
D) 0.0669
A) 0.0679
B) 0.9331
C) 0.0769
D) 0.0669
Unlock Deck
Unlock for access to all 254 flashcards in this deck.
Unlock Deck
k this deck
29
The weights of college football players are normally distributed with a mean of 200 pounds and a standard deviation of 50 pounds. If a college football player is randomly selected, find the probability that he weighs
Between 170 and 220 pounds.
A) 0.1554
B) 0.3811
C) 0.0703
D) 0.2257
Between 170 and 220 pounds.
A) 0.1554
B) 0.3811
C) 0.0703
D) 0.2257
Unlock Deck
Unlock for access to all 254 flashcards in this deck.
Unlock Deck
k this deck
30
A bank's loan officer rates applicants for credit. The ratings are normally distributed with a mean of 200 and a standard deviation of 50. If an applicant is randomly selected, find the probability of a rating that is between 200
And 275.
A) 0.5
B) 0.9332
C) 0.0668
D) 0.4332
And 275.
A) 0.5
B) 0.9332
C) 0.0668
D) 0.4332
Unlock Deck
Unlock for access to all 254 flashcards in this deck.
Unlock Deck
k this deck
31
The given values are discrete. Use the continuity correction and describe the region of the normal distribution that corresponds to the indicated probability.
The probability of no more than 35 defective CDs.
A) The area to the left of 35.5
B) The area to the right of 35.5
C) The area to the left of 35
D) The area to the left of 34.5
The probability of no more than 35 defective CDs.
A) The area to the left of 35.5
B) The area to the right of 35.5
C) The area to the left of 35
D) The area to the left of 34.5
Unlock Deck
Unlock for access to all 254 flashcards in this deck.
Unlock Deck
k this deck
32
Estimate the indicated probability by using the normal distribution as an approximation to the binomial distribution. Two percent of hair dryers produced in a certain plant are defective. Estimate the probability that
Of 10,000 randomly selected hair dryers, at least 219 are defective.
A) 0.0934
B) 0.0823
C) 0.0869
D) 0.9066
Of 10,000 randomly selected hair dryers, at least 219 are defective.
A) 0.0934
B) 0.0823
C) 0.0869
D) 0.9066
Unlock Deck
Unlock for access to all 254 flashcards in this deck.
Unlock Deck
k this deck
33
Assume that the red blood cell counts of women are normally distributed with a mean of 4.577 million cells per microliter and a standard deviation of 0.382 million cells per microliter. Approximately what percentage of
Women have red blood cell counts in the normal range from 4.2 to 5.4 million cells per microliter?
A) 4.09%
B) 82.31%
C) 16.11%
D) 17.69%
Women have red blood cell counts in the normal range from 4.2 to 5.4 million cells per microliter?
A) 4.09%
B) 82.31%
C) 16.11%
D) 17.69%
Unlock Deck
Unlock for access to all 254 flashcards in this deck.
Unlock Deck
k this deck
34
Assume that the red blood cell counts of women are normally distributed with a mean of 4.577 million cells per microliter and a standard deviation of 0.382 million cells per microliter. Find the value closest to the probability
That a randomly selected woman has a red blood cell count above the normal range of 4.2 to 5.4 million cells per
Microliter.
A) 0.1611
B) 0.9842
C) 0.0409
D) 0.0158
That a randomly selected woman has a red blood cell count above the normal range of 4.2 to 5.4 million cells per
Microliter.
A) 0.1611
B) 0.9842
C) 0.0409
D) 0.0158
Unlock Deck
Unlock for access to all 254 flashcards in this deck.
Unlock Deck
k this deck
35
The Precision Scientific Instrument Company manufactures thermometers that are supposed to give readings of 0°C at the freezing point of water. Tests on a large sample of these thermometers reveal that at the freezing
Point of water, some give readings below 0°C (denoted by negative numbers) and some give readings above
0°C (denoted by positive numbers). Assume that the mean reading is 0°C and the standard deviation of the
Readings is 1.00°C. Also assume that the frequency distribution of errors closely resembles the normal
Distribution. A thermometer is randomly selected and tested. A quality control analyst wants to examine
Thermometers that give readings in the bottom 4%. Find the temperature reading that separates the bottom 4%
From the others.
A) -1.48°
B) -1.75°
C) -1.89°
D) -1.63°
Unlock Deck
Unlock for access to all 254 flashcards in this deck.
Unlock Deck
k this deck
36
If z is a standard normal variable, find P(z > 0.97).
A) 0.1685
B) 0.8340
C) 0.1660
D) 0.1922
A) 0.1685
B) 0.8340
C) 0.1660
D) 0.1922
Unlock Deck
Unlock for access to all 254 flashcards in this deck.
Unlock Deck
k this deck
37
In a population of 210 women, the heights of the women are normally distributed with a mean of 64.4 inches and a standard deviation of 2.9 inches. If 36 women are selected at random, find the mean and standard
Deviation of the population of sample means. Assume that the sampling is done without replacement and
Use a finite population correction factor.
A) 58.8 inches, 2.65 inches
B) 64.4 inches, 2.07 inches
C) 64.4 inches, 2.9 inches
D) 64.4 inches, 0.44 inches
and standardDeviation
of the population of sample means. Assume that the sampling is done without replacement andUse a finite population correction factor.
A) 58.8 inches, 2.65 inches
B) 64.4 inches, 2.07 inches
C) 64.4 inches, 2.9 inches
D) 64.4 inches, 0.44 inches
Unlock Deck
Unlock for access to all 254 flashcards in this deck.
Unlock Deck
k this deck
38
Assume that the red blood cell counts of women are normally distributed with a mean of 4.577 million cells per microliter and a standard deviation of 0.382 million cells per microliter. Find the 80 percentile for the red
Blood cell counts of women.
A) 4.898 million cells per microliter
B) 4.655 million cells per microliter
C) 4.878 million cells per microliter
percentile for the redBlood cell counts of women.
A) 4.898 million cells per microliter
B) 4.655 million cells per microliter
C) 4.878 million cells per microliter
Unlock Deck
Unlock for access to all 254 flashcards in this deck.
Unlock Deck
k this deck
39
Find the indicated z score. The graph depicts the standard normal distribution with mean 0 and standard deviation 1. Shaded area is 0.4483.
A) 0.3264
B) 0.13
C) 0.6736
D) -0.13
A) 0.3264
B) 0.13
C) 0.6736
D) -0.13
Unlock Deck
Unlock for access to all 254 flashcards in this deck.
Unlock Deck
k this deck
40
Which of the following is a biased estimator?
A) mean
B) variance
C) proportion
D) standard deviation
A) mean
B) variance
C) proportion
D) standard deviation
Unlock Deck
Unlock for access to all 254 flashcards in this deck.
Unlock Deck
k this deck
41
Identify three important criteria to determine if the use of a normal distribution is justified.
Unlock Deck
Unlock for access to all 254 flashcards in this deck.
Unlock Deck
k this deck
42
Lengths of pregnancies are normally distributed with a mean of 268 days and a standard deviation of 15 days.
(a) Find the probability of a pregnancy lasting more than 250 days. (b) Find the probability of a pregnancy
lasting more than 280 days. Draw the diagram for each and discuss the part of the solution that would be
different for finding the requested probabilities.
(a) Find the probability of a pregnancy lasting more than 250 days. (b) Find the probability of a pregnancy
lasting more than 280 days. Draw the diagram for each and discuss the part of the solution that would be
different for finding the requested probabilities.
Unlock Deck
Unlock for access to all 254 flashcards in this deck.
Unlock Deck
k this deck
43
A normal quartile plot is given below for a sample of scores on an aptitude test. Use the plot to assess the
normality of scores on this test. Explain your reasoning.
normality of scores on this test. Explain your reasoning.
Unlock Deck
Unlock for access to all 254 flashcards in this deck.
Unlock Deck
k this deck
44
You will use a normal distribution to approximate a binomial distribution. Complete the following table for a
distribution in which 16. It might be helpful to make a diagram to help you determine the continuity factor
for each entry.
distribution in which
16. It might be helpful to make a diagram to help you determine the continuity factorfor each entry.
Unlock Deck
Unlock for access to all 254 flashcards in this deck.
Unlock Deck
k this deck
45
Describe what an unbiased estimator is and give an example of an unbiased estimator and a biased estimator.
Unlock Deck
Unlock for access to all 254 flashcards in this deck.
Unlock Deck
k this deck
46
Three randomly selected households are surveyed as a pilot project for a larger survey to be conducted later.
The numbers of people in the households are 2, 3, and 8. Consider the values of 2, 3, and 8 to be a population.
Assume that samples of size n = 2 are randomly selected with replacement from the population of 2, 3, and 8. The nine
different samples are as follows: (2, 2), (2, 3), (2, 8), (3, 2), (3, 3), (3, 8), (8, 2), (8, 3), and (8, 8).
(i) Find the range of each of the nine samples, then summarize the sampling distribution of the ranges in the format of a
table representing the probability distribution. (ii) Compare the population range to the mean of the sample ranges.
(iii) Do the sample ranges target the value of the population range? In general, do ranges make good estimators
of population ranges? Why or why not?
Unlock Deck
Unlock for access to all 254 flashcards in this deck.
Unlock Deck
k this deck
47
State the central limit theorem. Describe the sampling distribution for a population that is uniform and for a
population that is normal.
population that is normal.
Unlock Deck
Unlock for access to all 254 flashcards in this deck.
Unlock Deck
k this deck
48
A normal quartile plot is given below for the lifetimes (in hours) of a sample of batteries of a particular brand.
Use the plot to assess the normality of the lifetimes of these batteries. Explain your reasoning.
Use the plot to assess the normality of the lifetimes of these batteries. Explain your reasoning.
Unlock Deck
Unlock for access to all 254 flashcards in this deck.
Unlock Deck
k this deck
49
In a recent year, the U.S. Mint in Denver manufactured 270 million quarters. Assume that on each day of
production, a sample of 50 quarters is randomly selected and the mean weight is obtained. Given that the
population of quarters has a mean weight of 5.67 g, what do you know about the mean of the sample means?
What do you know about the shape of the distribution of the sample means?
production, a sample of 50 quarters is randomly selected and the mean weight is obtained. Given that the
population of quarters has a mean weight of 5.67 g, what do you know about the mean of the sample means?
What do you know about the shape of the distribution of the sample means?
Unlock Deck
Unlock for access to all 254 flashcards in this deck.
Unlock Deck
k this deck
50
A normal quartile plot is given below for the weekly incomes (in dollars) of a sample of engineers in one town.
Describe what each x value represents and what each y value represents. Use the plot to assess the normality of
the incomes of engineers in this town. Explain your reasoning.
Describe what each x value represents and what each y value represents. Use the plot to assess the normality of
the incomes of engineers in this town. Explain your reasoning.
Unlock Deck
Unlock for access to all 254 flashcards in this deck.
Unlock Deck
k this deck
51
The population of current statistics students has ages with mean and standard deviation σ. Samples of
statistics are randomly selected so that there are exactly 40 students in each sample. For each sample, the mean
age is computed. What does the central limit theorem tell us about the distribution of those mean ages?
and standard deviation σ. Samples ofstatistics are randomly selected so that there are exactly 40 students in each sample. For each sample, the mean
age is computed. What does the central limit theorem tell us about the distribution of those mean ages?
Unlock Deck
Unlock for access to all 254 flashcards in this deck.
Unlock Deck
k this deck
52
Suppose that you wish to find ) for a continuous uniform distribution having a minimum of -3 and
a maximum of 3. If you incorrectly assume that the distribution is normal instead of uniform, will your answer
be too big, too small, or will you still obtain the correct answer? Explain your thinking.
) for a continuous uniform distribution having a minimum of -3 anda maximum of 3. If you incorrectly assume that the distribution is normal instead of uniform, will your answer
be too big, too small, or will you still obtain the correct answer? Explain your thinking.
Unlock Deck
Unlock for access to all 254 flashcards in this deck.
Unlock Deck
k this deck
53
Explain how a nonstandard normal distribution differs from the standard normal distribution. Describe the
process for finding probabilities for nonstandard normal distributions.
process for finding probabilities for nonstandard normal distributions.
Unlock Deck
Unlock for access to all 254 flashcards in this deck.
Unlock Deck
k this deck
54
Heights of adult females are normally distributed. Samples of height of adult females, each of size n = 3, are
randomly collected and the sample means are found. Is it correct to conclude that the sample means cannot be
treated as a normal distribution because the sample size is so small? Explain.
randomly collected and the sample means are found. Is it correct to conclude that the sample means cannot be
treated as a normal distribution because the sample size is so small? Explain.
Unlock Deck
Unlock for access to all 254 flashcards in this deck.
Unlock Deck
k this deck
55
SAT verbal scores are normally distributed with a mean of 430 and a standard deviation of 120 (based on data
from the College Board ATP). (a) If a single student is randomly selected, find the probability that the sample
mean is above 500. (b) If a sample of 35 students are selected randomly, find the probability that the sample
mean is above 500. These two problems appear to be very similar. Which problem requires the application of
the central limit theorem, and in what way does the solution process differ between the two problems?
Unlock Deck
Unlock for access to all 254 flashcards in this deck.
Unlock Deck
k this deck
56
The number of books sold over the course of the four-day book fair were 194, 197, 247, and 76. Assume that
samples of size 2 are randomly selected with replacement from this population of four values. List the different
possible samples, and find the mean of each of them.
samples of size 2 are randomly selected with replacement from this population of four values. List the different
possible samples, and find the mean of each of them.
Unlock Deck
Unlock for access to all 254 flashcards in this deck.
Unlock Deck
k this deck
57
Three randomly selected households are surveyed as a pilot project for a larger survey to be conducted later.
The numbers of people in the households are 5, 7, and 9. Consider the values of 5, 7, and 9 to be a population.
Assume that samples of size n = 2 are randomly selected with replacement from the population of 5, 7, and 9.
The nine different samples are as follows: (5, 5), (5, 7), (5, 9), (7, 5), (7, 7), (7, 9), (9, 5), (9, 7), and (9, 9). (i) Find the
mean of each of the nine samples, then summarize the sampling distribution of the means in the format of a
table representing the probability distribution. (ii) Compare the population mean to the mean of the sample
means. (iii) Do the sample means target the value of the population mean? In general, do means make good
estimators of population means? Why or why not?
Unlock Deck
Unlock for access to all 254 flashcards in this deck.
Unlock Deck
k this deck
58
Define a density curve and describe the two properties that it must satisfy. Show a density curve for a uniform
distribution. Make sure that your graph satisfies both properties.
distribution. Make sure that your graph satisfies both properties.
Unlock Deck
Unlock for access to all 254 flashcards in this deck.
Unlock Deck
k this deck
59
After constructing a new manufacturing machine, five prototype integrated circuit chips are produced and it is
found that two are defective and three are acceptable. Assume that two of the chips are randomly selected with
replacement from this population. After identifying the 25 possible samples, find the proportion of defects in
each of them, using a table to describe the sampling distribution of the proportions of the defects.
Unlock Deck
Unlock for access to all 254 flashcards in this deck.
Unlock Deck
k this deck
60
Define the central limit theorem and its relationship to the sampling distribution of sample means. Define how
you can approximate a normal distribution from an original population that is not normally distributed
you can approximate a normal distribution from an original population that is not normally distributed
Unlock Deck
Unlock for access to all 254 flashcards in this deck.
Unlock Deck
k this deck
61
Find the area of the shaded region. The graph depicts the standard normal distribution with mean 0 and standard
deviation 1.
A) 0.8599
B) 0.1401
C) 0.7198
D) 0.2802
deviation 1.
A) 0.8599
B) 0.1401
C) 0.7198
D) 0.2802
Unlock Deck
Unlock for access to all 254 flashcards in this deck.
Unlock Deck
k this deck
62
Find the indicated z score. The graph depicts the standard normal distribution with mean 0 and standard deviation 1.
Shaded area is 0.4013.
A) 0.25
B) 0.57
C) -0.57
D) -0.25
Shaded area is 0.4013.
A) 0.25
B) 0.57
C) -0.57
D) -0.25
Unlock Deck
Unlock for access to all 254 flashcards in this deck.
Unlock Deck
k this deck
63
What is the probability that the random variable has a value less than 6?
A) 0.500
B) 0.750
C) 0.875
D) 0.625
A) 0.500
B) 0.750
C) 0.875
D) 0.625
Unlock Deck
Unlock for access to all 254 flashcards in this deck.
Unlock Deck
k this deck
64
Find the area of the shaded region. The graph depicts the standard normal distribution with mean 0 and standard
deviation 1.
A) 0.2420
B) 0.7580
C) 0.8790
D) 0.1210
deviation 1.
A) 0.2420
B) 0.7580
C) 0.8790
D) 0.1210
Unlock Deck
Unlock for access to all 254 flashcards in this deck.
Unlock Deck
k this deck
65
Find the area of the shaded region. The graph depicts the standard normal distribution with mean 0 and standard
deviation 1.
A) 0.4656
B) -0.0344
C) 0.9656
D) 0.0344
deviation 1.
A) 0.4656
B) -0.0344
C) 0.9656
D) 0.0344
Unlock Deck
Unlock for access to all 254 flashcards in this deck.
Unlock Deck
k this deck
66
Find the area of the shaded region. The graph depicts the standard normal distribution with mean 0 and standard
deviation 1.
A) 0.2190
B) 0.2224
C) 0.2776
D) 0.7224
deviation 1.
A) 0.2190
B) 0.2224
C) 0.2776
D) 0.7224
Unlock Deck
Unlock for access to all 254 flashcards in this deck.
Unlock Deck
k this deck
67
Find the area of the shaded region. The graph depicts the standard normal distribution with mean 0 and standard
deviation 1.
A) 0.8907
B) 0.8708
C) 0.1292
D) 0.8485
deviation 1.
A) 0.8907
B) 0.8708
C) 0.1292
D) 0.8485
Unlock Deck
Unlock for access to all 254 flashcards in this deck.
Unlock Deck
k this deck
68
Find the area of the shaded region. The graph depicts the standard normal distribution with mean 0 and standard
deviation 1.
A) 0.8812
B) 0.9406
C) 0.1188
D) 0.0594
deviation 1.
A) 0.8812
B) 0.9406
C) 0.1188
D) 0.0594
Unlock Deck
Unlock for access to all 254 flashcards in this deck.
Unlock Deck
k this deck
69
Find the area of the shaded region. The graph depicts the standard normal distribution with mean 0 and standard
deviation 1.
A) 0.9398
B) 0.0301
C) 0.0602
D) 0.9699
deviation 1.
A) 0.9398
B) 0.0301
C) 0.0602
D) 0.9699
Unlock Deck
Unlock for access to all 254 flashcards in this deck.
Unlock Deck
k this deck
70
What is the probability that the random variable has a value between 5.3 and 5.7?
A) 0.3000
B) 0.0500
C) 0.1750
D) 0.0750
A) 0.3000
B) 0.0500
C) 0.1750
D) 0.0750
Unlock Deck
Unlock for access to all 254 flashcards in this deck.
Unlock Deck
k this deck
71
Find the area of the shaded region. The graph depicts the standard normal distribution with mean 0 and standard
deviation 1.
A) 0.6424
B) 0.3576
C) 0.8212
D) 0.1788
deviation 1.
A) 0.6424
B) 0.3576
C) 0.8212
D) 0.1788
Unlock Deck
Unlock for access to all 254 flashcards in this deck.
Unlock Deck
k this deck
72
Assume that the weight loss for the first month of a diet program varies between 6 pounds and 12 pounds, and is spread
evenly over the range of possibilities, so that there is a uniform distribution. Find the probability of the given range of
pounds lost.
Less than 11 pounds
evenly over the range of possibilities, so that there is a uniform distribution. Find the probability of the given range of
pounds lost.
Less than 11 pounds
Unlock Deck
Unlock for access to all 254 flashcards in this deck.
Unlock Deck
k this deck
73
Assume that the weight loss for the first month of a diet program varies between 6 pounds and 12 pounds, and is spread
evenly over the range of possibilities, so that there is a uniform distribution. Find the probability of the given range of
pounds lost.
Between 8.5 pounds and 10 pounds
evenly over the range of possibilities, so that there is a uniform distribution. Find the probability of the given range of
pounds lost.
Between 8.5 pounds and 10 pounds
Unlock Deck
Unlock for access to all 254 flashcards in this deck.
Unlock Deck
k this deck
74
What is the probability that the random variable has a value greater than 1.3?
A) 0.7875
B) 0.7125
C) 0.8375
D) 0.9625
A) 0.7875
B) 0.7125
C) 0.8375
D) 0.9625
Unlock Deck
Unlock for access to all 254 flashcards in this deck.
Unlock Deck
k this deck
75
Find the indicated z score. The graph depicts the standard normal distribution with mean 0 and standard deviation 1.
Shaded area is 0.9599.
A) 1.82
B) 1.75
C) 1.03
D) -1.38
Shaded area is 0.9599.
A) 1.82
B) 1.75
C) 1.03
D) -1.38
Unlock Deck
Unlock for access to all 254 flashcards in this deck.
Unlock Deck
k this deck
76
What is the probability that the random variable has a value between 0.4 and 0.8?
A) 0.3
B) 0.175
C) 0.075
D) 0.05
A) 0.3
B) 0.175
C) 0.075
D) 0.05
Unlock Deck
Unlock for access to all 254 flashcards in this deck.
Unlock Deck
k this deck
77
Assume that the weight loss for the first month of a diet program varies between 6 pounds and 12 pounds, and is spread
evenly over the range of possibilities, so that there is a uniform distribution. Find the probability of the given range of
pounds lost.
Between 8 pounds and 11 pounds
evenly over the range of possibilities, so that there is a uniform distribution. Find the probability of the given range of
pounds lost.
Between 8 pounds and 11 pounds
Unlock Deck
Unlock for access to all 254 flashcards in this deck.
Unlock Deck
k this deck
78
What is the probability that the random variable has a value less than 2.7?
A) 0.4625
B) 0.2125
C) 0.3375
D) 0.0875
A) 0.4625
B) 0.2125
C) 0.3375
D) 0.0875
Unlock Deck
Unlock for access to all 254 flashcards in this deck.
Unlock Deck
k this deck
79
Assume that the weight loss for the first month of a diet program varies between 6 pounds and 12 pounds, and is spread
evenly over the range of possibilities, so that there is a uniform distribution. Find the probability of the given range of
pounds lost.
More than 10 pounds
evenly over the range of possibilities, so that there is a uniform distribution. Find the probability of the given range of
pounds lost.
More than 10 pounds
Unlock Deck
Unlock for access to all 254 flashcards in this deck.
Unlock Deck
k this deck
80
What is the probability that the random variable has a value greater than 5?
A) 0.500
B) 0.250
C) 0.325
D) 0.375
A) 0.500
B) 0.250
C) 0.325
D) 0.375
Unlock Deck
Unlock for access to all 254 flashcards in this deck.
Unlock Deck
k this deck
Unlock Deck
Unlock for access to all 254 flashcards in this deck.


