Deck 13: Nonparametric Tests
Full screen (f)
Question
Use the runs test to determine whether the given sequence is random. Use a significance level of 0.05. A
true-false test had the following answer sequence. Test the null hypothesis that the sequence was random.
true-false test had the following answer sequence.
Test the null hypothesis that the sequence was random. Question
Use the sign test to test the indicated claim. Fourteen people rated two brands of soda on a scale of 1 to 5. 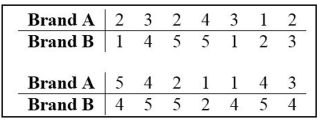 At the 5 percent level, test the null hypothesis that the two brands of soda are equally popular.
At the 5 percent level, test the null hypothesis that the two brands of soda are equally popular. Question
Question
Use a 0.05 level of significance to test the claim that the sequence of computer-generated numbers is random. Test
for randomness above and below the mean.
for randomness above and below the mean.
Question
Question
Question
Use the rank correlation coefficient to test for a correlation between the two variables. Given that the rank
correlation coefficient, for 37 pairs of data is 0.324, test the claim of correlation between the two variables.
Use a significance level of 0.01.
correlation coefficient,
for 37 pairs of data is 0.324, test the claim of correlation between the two variables.Use a significance level of 0.01.
Question
Question
Question
Use the Wilcoxon rank-sum test to test the claim that the two independent samples come from populations with
equal medians. SAT scores for students selected randomly from two different schools are shown below. Use a
significance level of 0.05 to test the claim that the scores for the two schools are from populations with the same
median.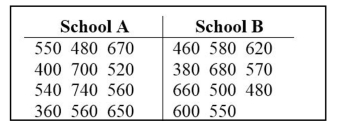
equal medians. SAT scores for students selected randomly from two different schools are shown below. Use a
significance level of 0.05 to test the claim that the scores for the two schools are from populations with the same
median.
Question
Use the runs test to determine whether the given sequence is random. Use a significance level of 0.05. The sequence of
numbers below represents the maximum temperature (in degrees Fahrenheit) in July in one U.S. town for 30
consecutive years. Test the sequence for randomness above and below the median.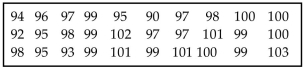
numbers below represents the maximum temperature (in degrees Fahrenheit) in July in one U.S. town for 30
consecutive years. Test the sequence for randomness above and below the median.
Question
Question
Use a Kruskal-Wallis test to test the claim that the samples come from populations with equal medians. Listed
below are grade averages for randomly selected students with three different categories of high-school
background. At the 0.05 level of significance, test the claim that the three groups have the same median grade
average.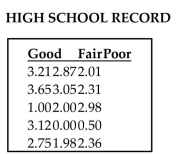
below are grade averages for randomly selected students with three different categories of high-school
background. At the 0.05 level of significance, test the claim that the three groups have the same median grade
average.
Question
Use the Wilcoxon rank-sum test to test the claim that the two independent samples come from populations with
equal medians. Use the Wilcoxon rank-sum approach to test the claim that the sample student grade averages
at two colleges come from populations with the same median. The sample data is listed below. Use a 0.05 level
of significance, and assume that the samples were randomly selected.
equal medians. Use the Wilcoxon rank-sum approach to test the claim that the sample student grade averages
at two colleges come from populations with the same median. The sample data is listed below. Use a 0.05 level
of significance, and assume that the samples were randomly selected.
Question
Question
Question
A standard aptitude test is given to several randomly selected programmers, and the scores are given below for the
mathematics and verbal portions of the test. Use the sign test to test the claim that programmers do better on the
mathematics portion of the test. Use a 0.05 level of significance.
mathematics and verbal portions of the test. Use the sign test to test the claim that programmers do better on the
mathematics portion of the test. Use a 0.05 level of significance.
Question
Use the Wilcoxon signed-ranks test to test the claim that the matched pairs have differences that come from a
population with a median equal to zero. Eleven runners are timed at the 100-meter dash and are timed again
one month later after following a new training program. The times (in seconds) are shown in the table. Use
Wilcoxon's signed-ranks test and a significance level of 0.05 to test the claim that the training has no effect on
the times.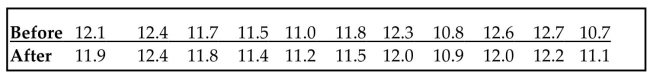
Question
Use the sign test to test the indicated claim. The heights of 16 randomly selected women are given below. Use a
significance level of 0.05 to test the claim that the population median is equal to 64.0 inches.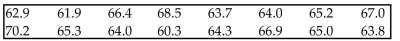
significance level of 0.05 to test the claim that the population median is equal to 64.0 inches.
Question
Use the rank correlation coefficient to test for a correlation between the two variables. A placement test is
required for students desiring to take a finite mathematics course at a university. The instructor of the course
studies the relationship between students' placement test score and final course score. A random sample of eight
students yields the following data.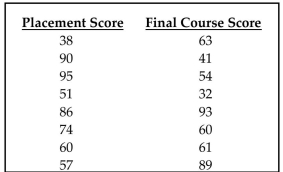 Compute the rank correlation coefficient, rs, of the data and test the claim of correlation between placement score
and final course score. Use a significance level of 0.05.
required for students desiring to take a finite mathematics course at a university. The instructor of the course
studies the relationship between students' placement test score and final course score. A random sample of eight
students yields the following data.
Compute the rank correlation coefficient, rs, of the data and test the claim of correlation between placement scoreand final course score. Use a significance level of 0.05.
Question
Question
Question
Use the rank correlation coefficient to test for a correlation between the two variables. Ten trucks were ranked
according to their comfort levels and their prices.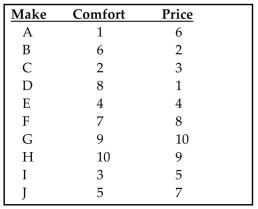 Find the rank correlation coefficient and test the claim of correlation between comfort and price. Use a significance level
of 0.05.
according to their comfort levels and their prices.
Find the rank correlation coefficient and test the claim of correlation between comfort and price. Use a significance levelof 0.05.
Question
Use the Wilcoxon signed -ranks test to test the claim that the matched pairs have differences that come from a
population with a median equal to zero. Eleven runners are timed at the 100-meter dash and are timed again
one month later after following a new training program. The times (in seconds) are shown in the table. Use
Wilcoxon's signed-ranks test and a significance level of 0.05 to test the claim that the training has no effect on the times.
Question
Match the parametric test with its comparable nonparametric test. 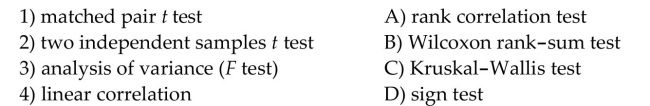
Question
Use the sign test to test the indicated claim. The waiting times (in minutes) of 28 randomly selected customers in
a bank are given below. Use a significance level of 0.05 to test the claim that the population median is equal to
5.3 minutes.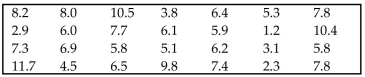
a bank are given below. Use a significance level of 0.05 to test the claim that the population median is equal to
5.3 minutes.
Question
Use the rank correlation coefficient to test for a correlation between the two variables. Use the sample data
below to find the rank correlation coefficient and test the claim of correlation between math and verbal scores.
Use a significance level of 0.05.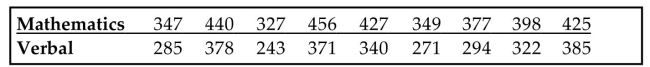
below to find the rank correlation coefficient and test the claim of correlation between math and verbal scores.
Use a significance level of 0.05.
Question
Question
Use the runs test to determine whether the given sequence is random. Use a significance level of 0.05. The
sequence of numbers below represents the maximum temperature (in degrees Fahrenheit) in July in one U.S.
town for 30 consecutive years. Test the sequence for randomness above and below the median.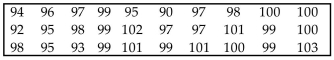
sequence of numbers below represents the maximum temperature (in degrees Fahrenheit) in July in one U.S.
town for 30 consecutive years. Test the sequence for randomness above and below the median.
Question
Use a Kruskal-Wallis test to test the claim that the samples come from populations with equal medians. Listed
below are grade averages for randomly selected students with three different categories of high-school
background. At the 0.05 level of significance, test the claim that the three groups have the same median grade
average.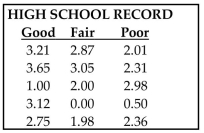
below are grade averages for randomly selected students with three different categories of high-school
background. At the 0.05 level of significance, test the claim that the three groups have the same median grade
average.
Question
Question
Use the runs test to determine whether the given sequence is random. Use a significance level of 0.05. A sample
of 30 clock radios is selected in sequence from an assembly line. Each radio is examined and judged to be
acceptable (A) or defective (D). The results are shown below. Test for randomness.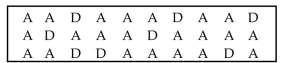
of 30 clock radios is selected in sequence from an assembly line. Each radio is examined and judged to be
acceptable (A) or defective (D). The results are shown below. Test for randomness.
Question
Use the runs test to determine whether the given sequence is random. Use a significance level of 0.05. Test the
sequence of digits below for randomness above and below the value of 4.5.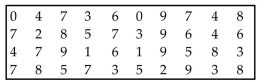
sequence of digits below for randomness above and below the value of 4.5.
Question
Question
Question
Use a Kruskal-Wallis test to test the claim that the samples come from populations with equal medians. The
table below shows the weights (in pounds) of 6 randomly selected women in each of three different age groups.
Use a 0.01 significance level to test the claim that the 3 age-groups have the same median weight.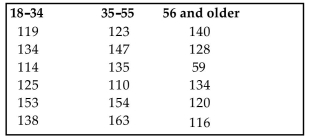
table below shows the weights (in pounds) of 6 randomly selected women in each of three different age groups.
Use a 0.01 significance level to test the claim that the 3 age-groups have the same median weight.
Question
Use the sign test to test the indicated claim. An instructor gives a test before and after a lesson and results from
randomly selected students are given below. At the 0.05 level of significance, test the claim that the lesson has no effect
on the grade. Use the sign test.
randomly selected students are given below. At the 0.05 level of significance, test the claim that the lesson has no effect
on the grade. Use the sign test.
Question
A teacher uses two different CAI programs to remediate a randomly selected group of students. Results for two
independent samples on a standardized test are listed in a table below. At the 0.05 level of significance, use the
Wilcoxon rank-sum test to test the hypothesis that the sample results are from populations with equal medians.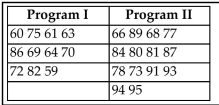
independent samples on a standardized test are listed in a table below. At the 0.05 level of significance, use the
Wilcoxon rank-sum test to test the hypothesis that the sample results are from populations with equal medians.
Question
Question
Use the Wilcoxon rank-sum approach to test the claim that the two independent sample student grade averages at
two colleges come from populations with equal medians. The sample data is listed below. Use a 0.05 level of significance,
and assume that the samples were randomly selected.
two colleges come from populations with equal medians. The sample data is listed below. Use a 0.05 level of significance,
and assume that the samples were randomly selected.
Question
Question
Question
Question
Question

Question
Question
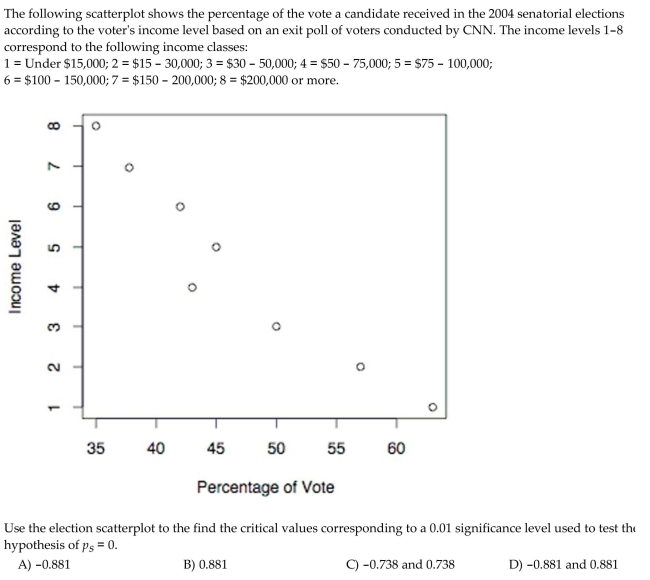
The following scatterplot shows the percentage of the vote a candidate received in the 2004 senatorial elections according to the voter's income level based on an exit poll of voters conducted by CNN. The income levels 1-8 correspond to the
Following income classes:
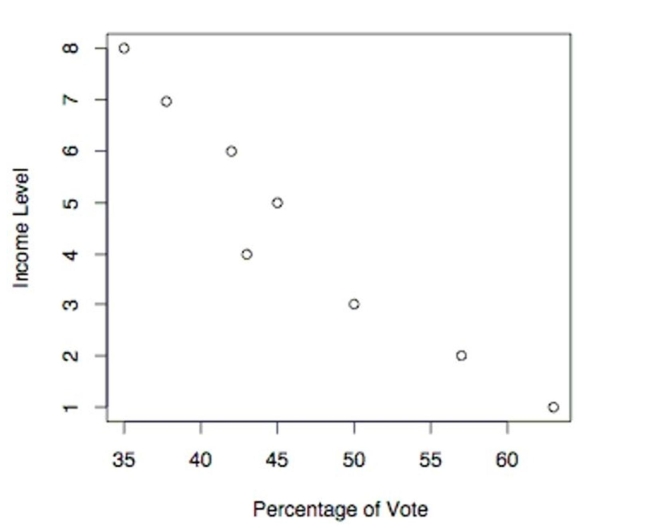 Use the election scatterplot to determine whether there is a correlation between percentage of vote and income level at
The 0.01 significance level with a null hypothesis of
A) The test statistic is not between the critical values, so we reject the null hypothesis. There is sufficient evidence to support a claim of correlation between percentage of vote and income level.
B) The test statistic is between the critical values, so we fail to reject the null hypothesis. There is no evidence to support a claim of correlation between percentage of vote and income level.
C) The test statistic is between the critical values, so we reject the null hypothesis. There is sufficient evidence to support a claim of correlation between percentage of vote and income level.
D) The test statistic is not between the critical values, so we fail to reject the null hypothesis. There is no evidence to support a claim of correlation between percentage of vote and income level.
Following income classes:
Use the election scatterplot to determine whether there is a correlation between percentage of vote and income level atThe 0.01 significance level with a null hypothesis of
A) The test statistic is not between the critical values, so we reject the null hypothesis. There is sufficient evidence to support a claim of correlation between percentage of vote and income level.
B) The test statistic is between the critical values, so we fail to reject the null hypothesis. There is no evidence to support a claim of correlation between percentage of vote and income level.
C) The test statistic is between the critical values, so we reject the null hypothesis. There is sufficient evidence to support a claim of correlation between percentage of vote and income level.
D) The test statistic is not between the critical values, so we fail to reject the null hypothesis. There is no evidence to support a claim of correlation between percentage of vote and income level.
Question
Use the runs test to determine whether the given sequence is random. Use a significance level of 0.05. The outcomes (odd number or even number) of a roulette wheel are shown below. Test for randomness of odd (O)
And even (E) numbers. Use a significance level of 0.05.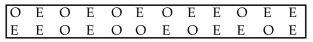 What is the value of G, the number of runs?
A) 10
B) 18
C) 17
D) 14
And even (E) numbers. Use a significance level of 0.05.
What is the value of G, the number of runs?A) 10
B) 18
C) 17
D) 14
Question
Question
Question
Question
Question
In a study of the effectiveness of physical exercise in weight reduction, 12 subjects followed a program of physical exercise for two months. Their weights (in pounds) before and after this program are shown in the
Table. Use Wilcoxon's signed-ranks test and a significance level of 0.05 to test the claim that the exercise
Program has no effect on weight. What would be the signed rank for the column with values of 175 and 168?
A) 10
B) 8.5
C) 9
D) 8
Table. Use Wilcoxon's signed-ranks test and a significance level of 0.05 to test the claim that the exercise
Program has no effect on weight.
What would be the signed rank for the column with values of 175 and 168?A) 10
B) 8.5
C) 9
D) 8
Question
Question
Question

Question
Use a Kruskal-Wallis test to test the claim that the samples come from populations with equal medians. SAT scores for students selected randomly from three different schools are shown below. Use a significance level of
0)05 to test the claim that the students from the three schools had the same median SAT score.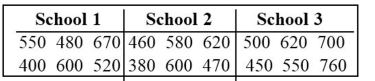 What would be the value of R1 that would be used in finding H?
0)05 to test the claim that the students from the three schools had the same median SAT score.
What would be the value of R1 that would be used in finding H? Question
Question
Question

Question
The waiting times (in minutes) of 28 randomly selected customers in a bank are given below. Use a significance
level of 0.05 to test the claim that the population median is equal to 5.3 minutes.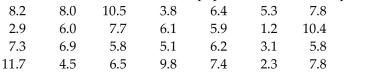
level of 0.05 to test the claim that the population median is equal to 5.3 minutes.
Question
A teacher uses two different CAI programs to remediate a randomly selected group of students. Results
for each group on a standardized test are listed in a table below. At the 0.05 level of significance, test the
hypothesis that the sample results are from populations with the same median.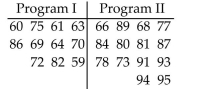
for each group on a standardized test are listed in a table below. At the 0.05 level of significance, test the
hypothesis that the sample results are from populations with the same median.
Question
A person who commutes to work is choosing between two different routes. He tries the first route 11 times and
the second route 12 times and records the time of each trip. The results (in minutes) are shown below. Use a
significance level of 0.01 to test the claim that the times for both routes come from populations with the same
median. Assume the routes were tested on days which were randomly selected.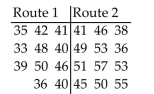
the second route 12 times and records the time of each trip. The results (in minutes) are shown below. Use a
significance level of 0.01 to test the claim that the times for both routes come from populations with the same
median. Assume the routes were tested on days which were randomly selected.
Question
An instructor gives a test before and after a lesson and results from randomly selected students are given below.
At the 0.05 level of significance, test the claim that the lesson has no effect on the grade. Use the sign test.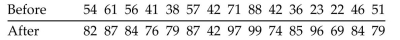
At the 0.05 level of significance, test the claim that the lesson has no effect on the grade. Use the sign test.
Question
Question
Use Wilcoxon's signed-ranks test and a 0.05 significance level to test the claim that the population of of
differences between the mathematics and verbal scores has a median of zero.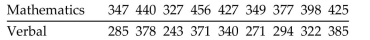
differences between the mathematics and verbal scores has a median of zero.
Question
Fourteen people rated two brands of soda on a scale of 1 to 5. 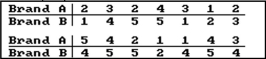 At the 5 percent level, test the null hypothesis that the two brands of soda are equally popular.
At the 5 percent level, test the null hypothesis that the two brands of soda are equally popular. Question
A standard aptitude test is given to several randomly selected programmers, and the scores are given below for
the mathematics and verbal portions of the test. Use the sign test to test the claim that programmers do better on
the mathematics portion of the test. Use a 0.05 level of significance.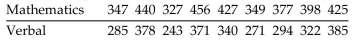
the mathematics and verbal portions of the test. Use the sign test to test the claim that programmers do better on
the mathematics portion of the test. Use a 0.05 level of significance.
Question
An instructor gives a test before and after a lesson and results from randomly selected students are given below.
Use Wilcoxon's signed-ranks test and a 0.05 significance level to test the claim that the lesson has no effect on
the grade.
Use Wilcoxon's signed-ranks test and a 0.05 significance level to test the claim that the lesson has no effect on
the grade.
Question
The heights of 16 randomly selected women are given below. Use a significance level of 0.05 to test the claim
that the population median is equal to 64.0 inches.
that the population median is equal to 64.0 inches.
Question
The systolic blood pressure readings of ten subjects before and after following a particular diet for a month are
shown in the table. Use Wilcoxon's signed-ranks test and a 0.01 significance level to test the claim that the diet
has no effect on systolic blood pressure.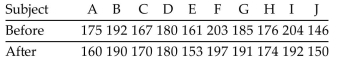
shown in the table. Use Wilcoxon's signed-ranks test and a 0.01 significance level to test the claim that the diet
has no effect on systolic blood pressure.
Question
Question
Question
SAT scores for students selected randomly from two different schools are shown below. Use a significance level
of 0.05 to test the claim that the scores for the two schools are from populations with the same median.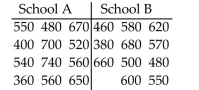
of 0.05 to test the claim that the scores for the two schools are from populations with the same median.
Question
The Wilcoxon signed-ranks test can be used to test the claim that a sample comes from a population with a
specified median. The procedure used is the same as the one described in this section except that the differences
are obtained by subtracting the value of the hypothesized median from each value.
The sample data below represent the weights (in pounds) of 12 women aged 20-30. Use a Wilcoxon
signed-ranks test to test the claim that the median weight of women aged 20-30 is equal to 130 pounds. Use a
significance level of 0.05. Be sure to state the hypotheses, the value of the test statistic, the critical values, and
your conclusion.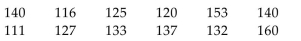
Question
Use the Wilcoxon rank-sum approach to test the claim that the sample student grade averages at two colleges
come from populations with the same median. The sample data is listed below. Use a 0.05 level of significance,
and assume that the samples were randomly selected.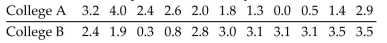
come from populations with the same median. The sample data is listed below. Use a 0.05 level of significance,
and assume that the samples were randomly selected.
Question
11 runners are timed at the 100-meter dash and are timed again one month later after following a new training
program. The times (in seconds) are shown in the table. Use Wilcoxon's signed-ranks test and a significance
level of 0.05 to test the claim that the training has no effect on the times.
program. The times (in seconds) are shown in the table. Use Wilcoxon's signed-ranks test and a significance
level of 0.05 to test the claim that the training has no effect on the times.
Question
Question
In a study of the effectiveness of physical exercise in weight reduction, 12 subjects followed a program of
physical exercise for two months. Their weights (in pounds) before and after this program are shown in the
table. Use Wilcoxon's signed-ranks test and a significance level of 0.05 to test the claim that the exercise
program has no effect on weight.
physical exercise for two months. Their weights (in pounds) before and after this program are shown in the
table. Use Wilcoxon's signed-ranks test and a significance level of 0.05 to test the claim that the exercise
program has no effect on weight.
Question
11 female employees and 11 male employees are randomly selected from one company and their weekly
salaries are recorded. The salaries (in dollars) are shown below. Use a significance level of 0.10 to test the claim
that the median salary for males and females at the company is the same.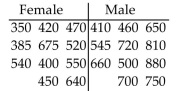
salaries are recorded. The salaries (in dollars) are shown below. Use a significance level of 0.10 to test the claim
that the median salary for males and females at the company is the same.

Unlock Deck
Sign up to unlock the cards in this deck!
Unlock Deck
Unlock Deck
1/121
Play
Full screen (f)
Deck 13: Nonparametric Tests
1
Use the runs test to determine whether the given sequence is random. Use a significance level of 0.05. A
true-false test had the following answer sequence. Test the null hypothesis that the sequence was random.
true-false test had the following answer sequence.
Test the null hypothesis that the sequence was random.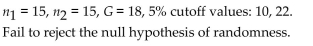
2
Use the sign test to test the indicated claim. Fourteen people rated two brands of soda on a scale of 1 to 5. At the 5 percent level, test the null hypothesis that the two brands of soda are equally popular.
At the 5 percent level, test the null hypothesis that the two brands of soda are equally popular.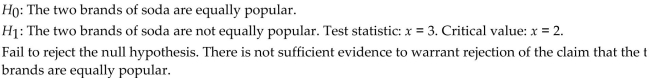 o
o 3
When applying the runs test for randomness above and below the median for 12 dollar/Euro exchange rate
highs, the test statistic is G = 2. What does that value tell us about the data?
highs, the test statistic is G = 2. What does that value tell us about the data?
This tells us that there are only two runs. All of the values below the median occur at the beginning and
all of the values above the median occur at the end or vice versa. This indicates an upward (or
downward) trend.
all of the values above the median occur at the end or vice versa. This indicates an upward (or
downward) trend.
4
Use a 0.05 level of significance to test the claim that the sequence of computer-generated numbers is random. Test
for randomness above and below the mean.
for randomness above and below the mean.
Unlock Deck
Unlock for access to all 121 flashcards in this deck.
Unlock Deck
k this deck
5
Describe the sign test. What types of hypotheses is it used to test? What is the underlying concept?
Unlock Deck
Unlock for access to all 121 flashcards in this deck.
Unlock Deck
k this deck
6
Explain what an efficiency rating is. You may use an example to explain this concept. Do comparable
parametric or nonparametric tests have higher efficiency ratings?
parametric or nonparametric tests have higher efficiency ratings?
Unlock Deck
Unlock for access to all 121 flashcards in this deck.
Unlock Deck
k this deck
7
Use the rank correlation coefficient to test for a correlation between the two variables. Given that the rank
correlation coefficient, for 37 pairs of data is 0.324, test the claim of correlation between the two variables.
Use a significance level of 0.01.
correlation coefficient,
for 37 pairs of data is 0.324, test the claim of correlation between the two variables.Use a significance level of 0.01.
Unlock Deck
Unlock for access to all 121 flashcards in this deck.
Unlock Deck
k this deck
8
Define rank. Explain how to find the rank for data which repeats (for example, the data set: 4, 5, 5, 5, 7, 8, 12, 12,
15, 18).
15, 18).
Unlock Deck
Unlock for access to all 121 flashcards in this deck.
Unlock Deck
k this deck
9
Give at least two examples of nonparametric tests and their comparable parametric tests.
Unlock Deck
Unlock for access to all 121 flashcards in this deck.
Unlock Deck
k this deck
10
Use the Wilcoxon rank-sum test to test the claim that the two independent samples come from populations with
equal medians. SAT scores for students selected randomly from two different schools are shown below. Use a
significance level of 0.05 to test the claim that the scores for the two schools are from populations with the same
median.
equal medians. SAT scores for students selected randomly from two different schools are shown below. Use a
significance level of 0.05 to test the claim that the scores for the two schools are from populations with the same
median.
Unlock Deck
Unlock for access to all 121 flashcards in this deck.
Unlock Deck
k this deck
11
Use the runs test to determine whether the given sequence is random. Use a significance level of 0.05. The sequence of
numbers below represents the maximum temperature (in degrees Fahrenheit) in July in one U.S. town for 30
consecutive years. Test the sequence for randomness above and below the median.
numbers below represents the maximum temperature (in degrees Fahrenheit) in July in one U.S. town for 30
consecutive years. Test the sequence for randomness above and below the median.
Unlock Deck
Unlock for access to all 121 flashcards in this deck.
Unlock Deck
k this deck
12
Describe the rank correlation test. What types of hypotheses is it used to test? How does the rank correlation
coefficient rs differ from the Pearson correlation coefficient r?
coefficient rs differ from the Pearson correlation coefficient r?
Unlock Deck
Unlock for access to all 121 flashcards in this deck.
Unlock Deck
k this deck
13
Use a Kruskal-Wallis test to test the claim that the samples come from populations with equal medians. Listed
below are grade averages for randomly selected students with three different categories of high-school
background. At the 0.05 level of significance, test the claim that the three groups have the same median grade
average.
below are grade averages for randomly selected students with three different categories of high-school
background. At the 0.05 level of significance, test the claim that the three groups have the same median grade
average.
Unlock Deck
Unlock for access to all 121 flashcards in this deck.
Unlock Deck
k this deck
14
Use the Wilcoxon rank-sum test to test the claim that the two independent samples come from populations with
equal medians. Use the Wilcoxon rank-sum approach to test the claim that the sample student grade averages
at two colleges come from populations with the same median. The sample data is listed below. Use a 0.05 level
of significance, and assume that the samples were randomly selected.
equal medians. Use the Wilcoxon rank-sum approach to test the claim that the sample student grade averages
at two colleges come from populations with the same median. The sample data is listed below. Use a 0.05 level
of significance, and assume that the samples were randomly selected.
Unlock Deck
Unlock for access to all 121 flashcards in this deck.
Unlock Deck
k this deck
15
Describe the Wilcoxon rank-sum test. What type of hypotheses is it used to test? What assumptions are made
for this test? What is the underlying concept?
for this test? What is the underlying concept?
Unlock Deck
Unlock for access to all 121 flashcards in this deck.
Unlock Deck
k this deck
16
List the advantages and disadvantages of nonparametric tests.
Unlock Deck
Unlock for access to all 121 flashcards in this deck.
Unlock Deck
k this deck
17
A standard aptitude test is given to several randomly selected programmers, and the scores are given below for the
mathematics and verbal portions of the test. Use the sign test to test the claim that programmers do better on the
mathematics portion of the test. Use a 0.05 level of significance.
mathematics and verbal portions of the test. Use the sign test to test the claim that programmers do better on the
mathematics portion of the test. Use a 0.05 level of significance.
Unlock Deck
Unlock for access to all 121 flashcards in this deck.
Unlock Deck
k this deck
18
Use the Wilcoxon signed-ranks test to test the claim that the matched pairs have differences that come from a
population with a median equal to zero. Eleven runners are timed at the 100-meter dash and are timed again
one month later after following a new training program. The times (in seconds) are shown in the table. Use
Wilcoxon's signed-ranks test and a significance level of 0.05 to test the claim that the training has no effect on
the times.
population with a median equal to zero. Eleven runners are timed at the 100-meter dash and are timed again
one month later after following a new training program. The times (in seconds) are shown in the table. Use
Wilcoxon's signed-ranks test and a significance level of 0.05 to test the claim that the training has no effect on
the times.
Unlock Deck
Unlock for access to all 121 flashcards in this deck.
Unlock Deck
k this deck
19
Use the sign test to test the indicated claim. The heights of 16 randomly selected women are given below. Use a
significance level of 0.05 to test the claim that the population median is equal to 64.0 inches.
significance level of 0.05 to test the claim that the population median is equal to 64.0 inches.
Unlock Deck
Unlock for access to all 121 flashcards in this deck.
Unlock Deck
k this deck
20
Use the rank correlation coefficient to test for a correlation between the two variables. A placement test is
required for students desiring to take a finite mathematics course at a university. The instructor of the course
studies the relationship between students' placement test score and final course score. A random sample of eight
students yields the following data. Compute the rank correlation coefficient, rs, of the data and test the claim of correlation between placement score
and final course score. Use a significance level of 0.05.
required for students desiring to take a finite mathematics course at a university. The instructor of the course
studies the relationship between students' placement test score and final course score. A random sample of eight
students yields the following data.
Compute the rank correlation coefficient, rs, of the data and test the claim of correlation between placement scoreand final course score. Use a significance level of 0.05.
Unlock Deck
Unlock for access to all 121 flashcards in this deck.
Unlock Deck
k this deck
21
When applying the runs test for randomness above and below the median for 10 scores on a final exam, the test
statistic is G = 2. What does that value tell us about the data?
statistic is G = 2. What does that value tell us about the data?
Unlock Deck
Unlock for access to all 121 flashcards in this deck.
Unlock Deck
k this deck
22
Solve the problem. Critical values for the runs test for randomness can be calculated by listing all possible
sequences. Using the elements B, B, B, R, R, R list the 20 different possible sequences. Find the number of runs
for each sequence. Are you able to find 5% cutoff values for G? What do you conclude?
sequences. Using the elements B, B, B, R, R, R list the 20 different possible sequences. Find the number of runs
for each sequence. Are you able to find 5% cutoff values for G? What do you conclude?
Unlock Deck
Unlock for access to all 121 flashcards in this deck.
Unlock Deck
k this deck
23
Use the rank correlation coefficient to test for a correlation between the two variables. Ten trucks were ranked
according to their comfort levels and their prices. Find the rank correlation coefficient and test the claim of correlation between comfort and price. Use a significance level
of 0.05.
according to their comfort levels and their prices.
Find the rank correlation coefficient and test the claim of correlation between comfort and price. Use a significance levelof 0.05.
Unlock Deck
Unlock for access to all 121 flashcards in this deck.
Unlock Deck
k this deck
24
Use the Wilcoxon signed -ranks test to test the claim that the matched pairs have differences that come from a
population with a median equal to zero. Eleven runners are timed at the 100-meter dash and are timed again
one month later after following a new training program. The times (in seconds) are shown in the table. Use
Wilcoxon's signed-ranks test and a significance level of 0.05 to test the claim that the training has no effect on the times.
population with a median equal to zero. Eleven runners are timed at the 100-meter dash and are timed again
one month later after following a new training program. The times (in seconds) are shown in the table. Use
Wilcoxon's signed-ranks test and a significance level of 0.05 to test the claim that the training has no effect on the times.
Unlock Deck
Unlock for access to all 121 flashcards in this deck.
Unlock Deck
k this deck
25
Match the parametric test with its comparable nonparametric test.
Unlock Deck
Unlock for access to all 121 flashcards in this deck.
Unlock Deck
k this deck
26
Use the sign test to test the indicated claim. The waiting times (in minutes) of 28 randomly selected customers in
a bank are given below. Use a significance level of 0.05 to test the claim that the population median is equal to
5.3 minutes.
a bank are given below. Use a significance level of 0.05 to test the claim that the population median is equal to
5.3 minutes.
Unlock Deck
Unlock for access to all 121 flashcards in this deck.
Unlock Deck
k this deck
27
Use the rank correlation coefficient to test for a correlation between the two variables. Use the sample data
below to find the rank correlation coefficient and test the claim of correlation between math and verbal scores.
Use a significance level of 0.05.
below to find the rank correlation coefficient and test the claim of correlation between math and verbal scores.
Use a significance level of 0.05.
Unlock Deck
Unlock for access to all 121 flashcards in this deck.
Unlock Deck
k this deck
28
Provide the appropriate response. Describe the Wilcoxon signed-ranks test. What types of hypotheses is it used
to test? What assumptions are made for this test?
to test? What assumptions are made for this test?
Unlock Deck
Unlock for access to all 121 flashcards in this deck.
Unlock Deck
k this deck
29
Use the runs test to determine whether the given sequence is random. Use a significance level of 0.05. The
sequence of numbers below represents the maximum temperature (in degrees Fahrenheit) in July in one U.S.
town for 30 consecutive years. Test the sequence for randomness above and below the median.
sequence of numbers below represents the maximum temperature (in degrees Fahrenheit) in July in one U.S.
town for 30 consecutive years. Test the sequence for randomness above and below the median.
Unlock Deck
Unlock for access to all 121 flashcards in this deck.
Unlock Deck
k this deck
30
Use a Kruskal-Wallis test to test the claim that the samples come from populations with equal medians. Listed
below are grade averages for randomly selected students with three different categories of high-school
background. At the 0.05 level of significance, test the claim that the three groups have the same median grade
average.
below are grade averages for randomly selected students with three different categories of high-school
background. At the 0.05 level of significance, test the claim that the three groups have the same median grade
average.
Unlock Deck
Unlock for access to all 121 flashcards in this deck.
Unlock Deck
k this deck
31
Use the sign test to test the indicated claim. A researcher wishes to test whether a particular diet has an effect on
blood pressure. The blood pressure of 25 randomly selected adults is measured. After one month on the diet,
each person's blood pressure is again measured. For 19 people, the second blood pressure reading was lower
than the first, and for 6 people, the second blood pressure reading was higher than the first. At the 0.01
significance level, test the claim that the diet has an effect on blood pressure.
Unlock Deck
Unlock for access to all 121 flashcards in this deck.
Unlock Deck
k this deck
32
Use the runs test to determine whether the given sequence is random. Use a significance level of 0.05. A sample
of 30 clock radios is selected in sequence from an assembly line. Each radio is examined and judged to be
acceptable (A) or defective (D). The results are shown below. Test for randomness.
of 30 clock radios is selected in sequence from an assembly line. Each radio is examined and judged to be
acceptable (A) or defective (D). The results are shown below. Test for randomness.
Unlock Deck
Unlock for access to all 121 flashcards in this deck.
Unlock Deck
k this deck
33
Use the runs test to determine whether the given sequence is random. Use a significance level of 0.05. Test the
sequence of digits below for randomness above and below the value of 4.5.
sequence of digits below for randomness above and below the value of 4.5.
Unlock Deck
Unlock for access to all 121 flashcards in this deck.
Unlock Deck
k this deck
34
If test A has an efficiency rating of 0.94 as compared to test B, explain what that efficiency rating means. Do
comparable nonparametric or parametric tests have higher efficiency ratings?
comparable nonparametric or parametric tests have higher efficiency ratings?
Unlock Deck
Unlock for access to all 121 flashcards in this deck.
Unlock Deck
k this deck
35
Describe the runs test for randomness. What types of hypotheses is it used to test? Does the runs test measure
frequency? What is the underlying concept?
frequency? What is the underlying concept?
Unlock Deck
Unlock for access to all 121 flashcards in this deck.
Unlock Deck
k this deck
36
Use a Kruskal-Wallis test to test the claim that the samples come from populations with equal medians. The
table below shows the weights (in pounds) of 6 randomly selected women in each of three different age groups.
Use a 0.01 significance level to test the claim that the 3 age-groups have the same median weight.
table below shows the weights (in pounds) of 6 randomly selected women in each of three different age groups.
Use a 0.01 significance level to test the claim that the 3 age-groups have the same median weight.
Unlock Deck
Unlock for access to all 121 flashcards in this deck.
Unlock Deck
k this deck
37
Use the sign test to test the indicated claim. An instructor gives a test before and after a lesson and results from
randomly selected students are given below. At the 0.05 level of significance, test the claim that the lesson has no effect
on the grade. Use the sign test.
randomly selected students are given below. At the 0.05 level of significance, test the claim that the lesson has no effect
on the grade. Use the sign test.
Unlock Deck
Unlock for access to all 121 flashcards in this deck.
Unlock Deck
k this deck
38
A teacher uses two different CAI programs to remediate a randomly selected group of students. Results for two
independent samples on a standardized test are listed in a table below. At the 0.05 level of significance, use the
Wilcoxon rank-sum test to test the hypothesis that the sample results are from populations with equal medians.
independent samples on a standardized test are listed in a table below. At the 0.05 level of significance, use the
Wilcoxon rank-sum test to test the hypothesis that the sample results are from populations with equal medians.
Unlock Deck
Unlock for access to all 121 flashcards in this deck.
Unlock Deck
k this deck
39
Describe the sign test. What types of hypotheses is it used to test? What is the underlying concept?
Unlock Deck
Unlock for access to all 121 flashcards in this deck.
Unlock Deck
k this deck
40
Use the Wilcoxon rank-sum approach to test the claim that the two independent sample student grade averages at
two colleges come from populations with equal medians. The sample data is listed below. Use a 0.05 level of significance,
and assume that the samples were randomly selected.
two colleges come from populations with equal medians. The sample data is listed below. Use a 0.05 level of significance,
and assume that the samples were randomly selected.
Unlock Deck
Unlock for access to all 121 flashcards in this deck.
Unlock Deck
k this deck
41
Match the parametric test with its related nonparametric test. Analysis of variance (F test)
A) Kruskal-Wallis test
B) Wilcoxon rank-sum test
C) Sign test
D) Rank correlation test
A) Kruskal-Wallis test
B) Wilcoxon rank-sum test
C) Sign test
D) Rank correlation test
Unlock Deck
Unlock for access to all 121 flashcards in this deck.
Unlock Deck
k this deck
42
Which statement is false about the Wilcoxon signed-ranks test?
A) It is used for testing a claim that a single population of individual values has a mean equal to some claimed value.
B) It is used for testing a claim that a population of matched pairs has the property that the matched pairs have differences with a median equal to zero.
C) It is used for testing a claim that a single population of individual values has a median equal to some claimed value.
D) It is a nonparametric test.
Unlock Deck
Unlock for access to all 121 flashcards in this deck.
Unlock Deck
k this deck
43
If the critical values for a run test (found from table A-10) are 8 and 19 and the G value is 17, what should your conclusion about randomness be?
A) Support randomness.
B) Reject randomness.
C) Fail to reject randomness.
A) Support randomness.
B) Reject randomness.
C) Fail to reject randomness.
Unlock Deck
Unlock for access to all 121 flashcards in this deck.
Unlock Deck
k this deck
44
A rank correlation coefficient is to be calculated for a collection of paired data. The values lie between -10 and 10. Which of the following could affect the value of the rank correlation coefficient?
I: Multiplying every value of one variable by 3
II: Interchanging the two variables
III: Adding 2 to each value of one variable
IV: Replacing every value of one variable by its absolute value
A) I
B) III
C) I and IV
D) IV
I: Multiplying every value of one variable by 3
II: Interchanging the two variables
III: Adding 2 to each value of one variable
IV: Replacing every value of one variable by its absolute value
A) I
B) III
C) I and IV
D) IV
Unlock Deck
Unlock for access to all 121 flashcards in this deck.
Unlock Deck
k this deck
45
Unlock Deck
Unlock for access to all 121 flashcards in this deck.
Unlock Deck
k this deck
46
Which of the following is not an application of the sign test?
A) Test claims about the median of a single population
B) Test claims about correlation
C) Test claims involving nominal data
D) Test claims involving matched pairs
A) Test claims about the median of a single population
B) Test claims about correlation
C) Test claims involving nominal data
D) Test claims involving matched pairs
Unlock Deck
Unlock for access to all 121 flashcards in this deck.
Unlock Deck
k this deck
47
The following scatterplot shows the percentage of the vote a candidate received in the 2004 senatorial elections according to the voter's income level based on an exit poll of voters conducted by CNN. The income levels 1-8 correspond to the
Following income classes: Use the election scatterplot to determine whether there is a correlation between percentage of vote and income level at
The 0.01 significance level with a null hypothesis of
A) The test statistic is not between the critical values, so we reject the null hypothesis. There is sufficient evidence to support a claim of correlation between percentage of vote and income level.
B) The test statistic is between the critical values, so we fail to reject the null hypothesis. There is no evidence to support a claim of correlation between percentage of vote and income level.
C) The test statistic is between the critical values, so we reject the null hypothesis. There is sufficient evidence to support a claim of correlation between percentage of vote and income level.
D) The test statistic is not between the critical values, so we fail to reject the null hypothesis. There is no evidence to support a claim of correlation between percentage of vote and income level.
Following income classes:
Use the election scatterplot to determine whether there is a correlation between percentage of vote and income level atThe 0.01 significance level with a null hypothesis of
A) The test statistic is not between the critical values, so we reject the null hypothesis. There is sufficient evidence to support a claim of correlation between percentage of vote and income level.
B) The test statistic is between the critical values, so we fail to reject the null hypothesis. There is no evidence to support a claim of correlation between percentage of vote and income level.
C) The test statistic is between the critical values, so we reject the null hypothesis. There is sufficient evidence to support a claim of correlation between percentage of vote and income level.
D) The test statistic is not between the critical values, so we fail to reject the null hypothesis. There is no evidence to support a claim of correlation between percentage of vote and income level.
Unlock Deck
Unlock for access to all 121 flashcards in this deck.
Unlock Deck
k this deck
48
Use the runs test to determine whether the given sequence is random. Use a significance level of 0.05. The outcomes (odd number or even number) of a roulette wheel are shown below. Test for randomness of odd (O)
And even (E) numbers. Use a significance level of 0.05. What is the value of G, the number of runs?
A) 10
B) 18
C) 17
D) 14
And even (E) numbers. Use a significance level of 0.05.
What is the value of G, the number of runs?A) 10
B) 18
C) 17
D) 14
Unlock Deck
Unlock for access to all 121 flashcards in this deck.
Unlock Deck
k this deck
49
Which of the following terms is sometimes used instead of "non-parametric test"?
A) Distribution-free test
B) Abnormality test
C) Normality test
D) Efficiency test
A) Distribution-free test
B) Abnormality test
C) Normality test
D) Efficiency test
Unlock Deck
Unlock for access to all 121 flashcards in this deck.
Unlock Deck
k this deck
50
Match the nonparametric test with its related parametric test. Runs test
A) Linear correlation
B) t test
C) ANOVA
D) There is no related parametric test.
A) Linear correlation
B) t test
C) ANOVA
D) There is no related parametric test.
Unlock Deck
Unlock for access to all 121 flashcards in this deck.
Unlock Deck
k this deck
51
Unlock Deck
Unlock for access to all 121 flashcards in this deck.
Unlock Deck
k this deck
52
Which of the following distribution-free tests has the lowest efficiency rating compared to its parametric counterpart?
A) Kruskal-Wallis test
B) Wilcoxon signed-ranks test
C) Rank correlation test
D) Wilcoxon rank-sum test
A) Kruskal-Wallis test
B) Wilcoxon signed-ranks test
C) Rank correlation test
D) Wilcoxon rank-sum test
Unlock Deck
Unlock for access to all 121 flashcards in this deck.
Unlock Deck
k this deck
53
In a study of the effectiveness of physical exercise in weight reduction, 12 subjects followed a program of physical exercise for two months. Their weights (in pounds) before and after this program are shown in the
Table. Use Wilcoxon's signed-ranks test and a significance level of 0.05 to test the claim that the exercise
Program has no effect on weight. What would be the signed rank for the column with values of 175 and 168?
A) 10
B) 8.5
C) 9
D) 8
Table. Use Wilcoxon's signed-ranks test and a significance level of 0.05 to test the claim that the exercise
Program has no effect on weight.
What would be the signed rank for the column with values of 175 and 168?A) 10
B) 8.5
C) 9
D) 8
Unlock Deck
Unlock for access to all 121 flashcards in this deck.
Unlock Deck
k this deck
54
Unlock Deck
Unlock for access to all 121 flashcards in this deck.
Unlock Deck
k this deck
55
Use the sign test to test the indicated claim. A researcher wishes to test whether a particular diet has an effect on blood pressure. The blood pressure of 24 randomly selected adults is measured. After one month on the diet,
Each person's blood pressure is again measured. For 18 people, the second blood pressure reading was lower
Than the first, and for 6 people, the second blood pressure reading was higher than the first. At the 0.01
Significance level, test the claim that the diet has an effect on blood pressure. What would be the value of the test
Statistic, x?
A) 19
B) 5
C) 13
D) 6
Unlock Deck
Unlock for access to all 121 flashcards in this deck.
Unlock Deck
k this deck
56
Unlock Deck
Unlock for access to all 121 flashcards in this deck.
Unlock Deck
k this deck
57
Use a Kruskal-Wallis test to test the claim that the samples come from populations with equal medians. SAT scores for students selected randomly from three different schools are shown below. Use a significance level of
0)05 to test the claim that the students from the three schools had the same median SAT score. What would be the value of R1 that would be used in finding H?
0)05 to test the claim that the students from the three schools had the same median SAT score.
What would be the value of R1 that would be used in finding H? Unlock Deck
Unlock for access to all 121 flashcards in this deck.
Unlock Deck
k this deck
58
Four different judges each rank the quality of 20 different singers. What method can be used for agreement among the four judges?
A) Rank correlation
B) Wilcoxon rank-sum test
C) Kruskal-Wallis Test
D) Runs Test
A) Rank correlation
B) Wilcoxon rank-sum test
C) Kruskal-Wallis Test
D) Runs Test
Unlock Deck
Unlock for access to all 121 flashcards in this deck.
Unlock Deck
k this deck
59
Do parametric or nonparametric tests have higher efficiency ratings?
A) Parametric
B) Nonparamtric
A) Parametric
B) Nonparamtric
Unlock Deck
Unlock for access to all 121 flashcards in this deck.
Unlock Deck
k this deck
60
Unlock Deck
Unlock for access to all 121 flashcards in this deck.
Unlock Deck
k this deck
61
The waiting times (in minutes) of 28 randomly selected customers in a bank are given below. Use a significance
level of 0.05 to test the claim that the population median is equal to 5.3 minutes.
level of 0.05 to test the claim that the population median is equal to 5.3 minutes.
Unlock Deck
Unlock for access to all 121 flashcards in this deck.
Unlock Deck
k this deck
62
A teacher uses two different CAI programs to remediate a randomly selected group of students. Results
for each group on a standardized test are listed in a table below. At the 0.05 level of significance, test the
hypothesis that the sample results are from populations with the same median.
for each group on a standardized test are listed in a table below. At the 0.05 level of significance, test the
hypothesis that the sample results are from populations with the same median.
Unlock Deck
Unlock for access to all 121 flashcards in this deck.
Unlock Deck
k this deck
63
A person who commutes to work is choosing between two different routes. He tries the first route 11 times and
the second route 12 times and records the time of each trip. The results (in minutes) are shown below. Use a
significance level of 0.01 to test the claim that the times for both routes come from populations with the same
median. Assume the routes were tested on days which were randomly selected.
the second route 12 times and records the time of each trip. The results (in minutes) are shown below. Use a
significance level of 0.01 to test the claim that the times for both routes come from populations with the same
median. Assume the routes were tested on days which were randomly selected.
Unlock Deck
Unlock for access to all 121 flashcards in this deck.
Unlock Deck
k this deck
64
An instructor gives a test before and after a lesson and results from randomly selected students are given below.
At the 0.05 level of significance, test the claim that the lesson has no effect on the grade. Use the sign test.
At the 0.05 level of significance, test the claim that the lesson has no effect on the grade. Use the sign test.
Unlock Deck
Unlock for access to all 121 flashcards in this deck.
Unlock Deck
k this deck
65
A researcher wishes to study whether a particular diet is effective in helping people to lose weight. 90 randomly
selected adults were weighed before starting the diet and again after following the diet for one month. 48 people
lost weight, 40 gained weight, and 2 observed no change in their weight. At the 0.01 significance level, test the
claim that the diet is effective.
selected adults were weighed before starting the diet and again after following the diet for one month. 48 people
lost weight, 40 gained weight, and 2 observed no change in their weight. At the 0.01 significance level, test the
claim that the diet is effective.
Unlock Deck
Unlock for access to all 121 flashcards in this deck.
Unlock Deck
k this deck
66
Use Wilcoxon's signed-ranks test and a 0.05 significance level to test the claim that the population of of
differences between the mathematics and verbal scores has a median of zero.
differences between the mathematics and verbal scores has a median of zero.
Unlock Deck
Unlock for access to all 121 flashcards in this deck.
Unlock Deck
k this deck
67
Fourteen people rated two brands of soda on a scale of 1 to 5. At the 5 percent level, test the null hypothesis that the two brands of soda are equally popular.
At the 5 percent level, test the null hypothesis that the two brands of soda are equally popular. Unlock Deck
Unlock for access to all 121 flashcards in this deck.
Unlock Deck
k this deck
68
A standard aptitude test is given to several randomly selected programmers, and the scores are given below for
the mathematics and verbal portions of the test. Use the sign test to test the claim that programmers do better on
the mathematics portion of the test. Use a 0.05 level of significance.
the mathematics and verbal portions of the test. Use the sign test to test the claim that programmers do better on
the mathematics portion of the test. Use a 0.05 level of significance.
Unlock Deck
Unlock for access to all 121 flashcards in this deck.
Unlock Deck
k this deck
69
An instructor gives a test before and after a lesson and results from randomly selected students are given below.
Use Wilcoxon's signed-ranks test and a 0.05 significance level to test the claim that the lesson has no effect on
the grade.
Use Wilcoxon's signed-ranks test and a 0.05 significance level to test the claim that the lesson has no effect on
the grade.
Unlock Deck
Unlock for access to all 121 flashcards in this deck.
Unlock Deck
k this deck
70
The heights of 16 randomly selected women are given below. Use a significance level of 0.05 to test the claim
that the population median is equal to 64.0 inches.
that the population median is equal to 64.0 inches.
Unlock Deck
Unlock for access to all 121 flashcards in this deck.
Unlock Deck
k this deck
71
The systolic blood pressure readings of ten subjects before and after following a particular diet for a month are
shown in the table. Use Wilcoxon's signed-ranks test and a 0.01 significance level to test the claim that the diet
has no effect on systolic blood pressure.
shown in the table. Use Wilcoxon's signed-ranks test and a 0.01 significance level to test the claim that the diet
has no effect on systolic blood pressure.
Unlock Deck
Unlock for access to all 121 flashcards in this deck.
Unlock Deck
k this deck
72
In the sign test procedure the most common approach to handling ties is to exclude the ties. A second approach
is to treat half the 0s (representing ties) as positive signs and half as negative signs. In this approach, if the
number of ties is odd, one tie is excluded so that they can be divided equally. In a sign test for matched pairs
with a claim that the median of the differences is equal to zero, there are 30 positive signs, 50 negative signs, and
23 ties. Identify the test statistic and conclusion for the two different methods. Use a significance level of 0.05.
Unlock Deck
Unlock for access to all 121 flashcards in this deck.
Unlock Deck
k this deck
73
A researcher wishes to study whether music has any effect on the ability to memorize information. 91 randomly
selected adults are given a memory test in a quiet room. They are then given a second memory test while
listening to classical music. 68 people received a higher score on the second test, 22 a lower score, and 1 received
the same score. At the 0.05 significance level, test the claim that the music has no effect on memorization skills.
Unlock Deck
Unlock for access to all 121 flashcards in this deck.
Unlock Deck
k this deck
74
SAT scores for students selected randomly from two different schools are shown below. Use a significance level
of 0.05 to test the claim that the scores for the two schools are from populations with the same median.
of 0.05 to test the claim that the scores for the two schools are from populations with the same median.
Unlock Deck
Unlock for access to all 121 flashcards in this deck.
Unlock Deck
k this deck
75
The Wilcoxon signed-ranks test can be used to test the claim that a sample comes from a population with a
specified median. The procedure used is the same as the one described in this section except that the differences
are obtained by subtracting the value of the hypothesized median from each value.
The sample data below represent the weights (in pounds) of 12 women aged 20-30. Use a Wilcoxon
signed-ranks test to test the claim that the median weight of women aged 20-30 is equal to 130 pounds. Use a
significance level of 0.05. Be sure to state the hypotheses, the value of the test statistic, the critical values, and
your conclusion.
specified median. The procedure used is the same as the one described in this section except that the differences
are obtained by subtracting the value of the hypothesized median from each value.
The sample data below represent the weights (in pounds) of 12 women aged 20-30. Use a Wilcoxon
signed-ranks test to test the claim that the median weight of women aged 20-30 is equal to 130 pounds. Use a
significance level of 0.05. Be sure to state the hypotheses, the value of the test statistic, the critical values, and
your conclusion.
Unlock Deck
Unlock for access to all 121 flashcards in this deck.
Unlock Deck
k this deck
76
Use the Wilcoxon rank-sum approach to test the claim that the sample student grade averages at two colleges
come from populations with the same median. The sample data is listed below. Use a 0.05 level of significance,
and assume that the samples were randomly selected.
come from populations with the same median. The sample data is listed below. Use a 0.05 level of significance,
and assume that the samples were randomly selected.
Unlock Deck
Unlock for access to all 121 flashcards in this deck.
Unlock Deck
k this deck
77
11 runners are timed at the 100-meter dash and are timed again one month later after following a new training
program. The times (in seconds) are shown in the table. Use Wilcoxon's signed-ranks test and a significance
level of 0.05 to test the claim that the training has no effect on the times.
program. The times (in seconds) are shown in the table. Use Wilcoxon's signed-ranks test and a significance
level of 0.05 to test the claim that the training has no effect on the times.
Unlock Deck
Unlock for access to all 121 flashcards in this deck.
Unlock Deck
k this deck
78
A researcher wishes to test whether a particular diet has an effect on blood pressure. The blood pressure of 25
randomly selected adults is measured. After one month on the diet, each person's blood pressure is again
measured. For 19 people, the second blood pressure reading was lower than the first, and for 6 people, the
second blood pressure reading was higher than the first. At the 0.01 significance level, test the claim that the diet
has an effect on blood pressure.
Unlock Deck
Unlock for access to all 121 flashcards in this deck.
Unlock Deck
k this deck
79
In a study of the effectiveness of physical exercise in weight reduction, 12 subjects followed a program of
physical exercise for two months. Their weights (in pounds) before and after this program are shown in the
table. Use Wilcoxon's signed-ranks test and a significance level of 0.05 to test the claim that the exercise
program has no effect on weight.
physical exercise for two months. Their weights (in pounds) before and after this program are shown in the
table. Use Wilcoxon's signed-ranks test and a significance level of 0.05 to test the claim that the exercise
program has no effect on weight.
Unlock Deck
Unlock for access to all 121 flashcards in this deck.
Unlock Deck
k this deck
80
11 female employees and 11 male employees are randomly selected from one company and their weekly
salaries are recorded. The salaries (in dollars) are shown below. Use a significance level of 0.10 to test the claim
that the median salary for males and females at the company is the same.
salaries are recorded. The salaries (in dollars) are shown below. Use a significance level of 0.10 to test the claim
that the median salary for males and females at the company is the same.
Unlock Deck
Unlock for access to all 121 flashcards in this deck.
Unlock Deck
k this deck
Unlock Deck
Unlock for access to all 121 flashcards in this deck.


