Deck 3: Displaying and Describing Quantitative Data
Full screen (f)
Question
Following is the five number summary of the hourly wages ($) for sales managers
displayed in question 1.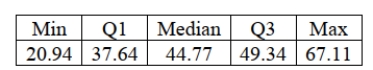 Suppose there had been an error and that the lowest hourly wage for sales managers was
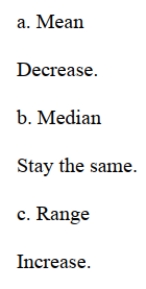
$18.50 instead of $20.94. Indicate how this change would affect the following summary
statistics (increase, decrease, or stay about the same):
A. Mean
b. Median
c. Range
d. IQR
e. Standard deviation
displayed in question 1.
Suppose there had been an error and that the lowest hourly wage for sales managers was$18.50 instead of $20.94. Indicate how this change would affect the following summary
statistics (increase, decrease, or stay about the same):
A. Mean
b. Median
c. Range
d. IQR
e. Standard deviation
Question
Question
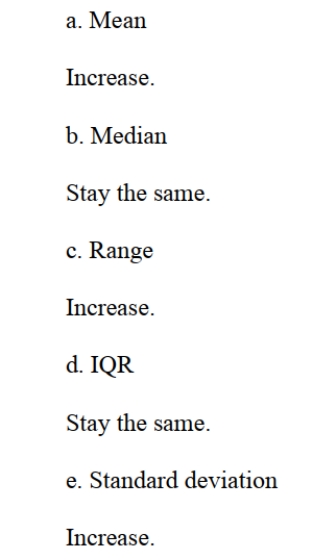
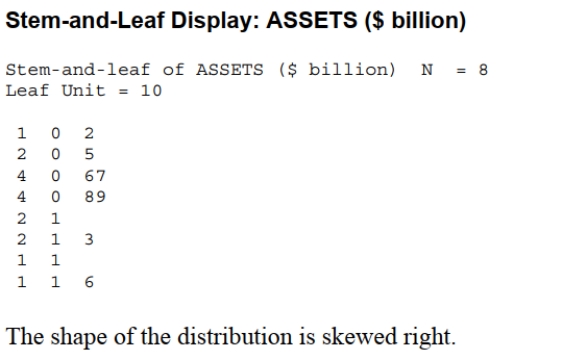
The following table shows data on total assets ($ billion) for a small sample of U.S.
banks. Prepare a stem and leaf display. Comment on the shape of the distribution.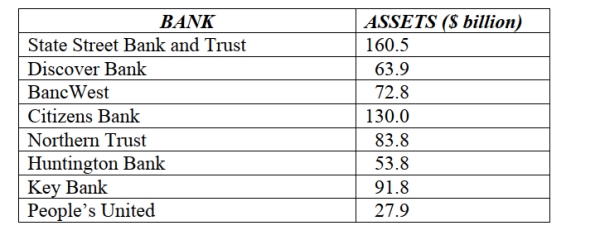
banks. Prepare a stem and leaf display. Comment on the shape of the distribution.
Question
The following table shows representative recent closing share prices in late 2013 for a small sample of companies based in India. 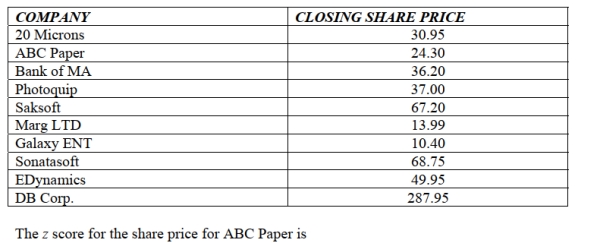
A) 2.76.
B) 0.47.
C) -2.76.
D) -1.49.
E) -0.47.
A) 2.76.
B) 0.47.
C) -2.76.
D) -1.49.
E) -0.47.
Question
The following table shows representative recent closing share prices for a small sample of companies based in India in late 2013. 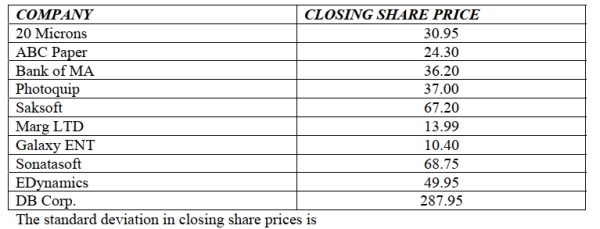
A) $81.6.
B) $25.8.
C) $36.6.
D) $62.7.
E) $67.6.
A) $81.6.
B) $25.8.
C) $36.6.
D) $62.7.
E) $67.6.
Question
The following boxplots show monthly sales revenue figures ($ thousands) for a
discount office supply company with locations in three different regions of the U.S.
(Northeast, Southeast, and West).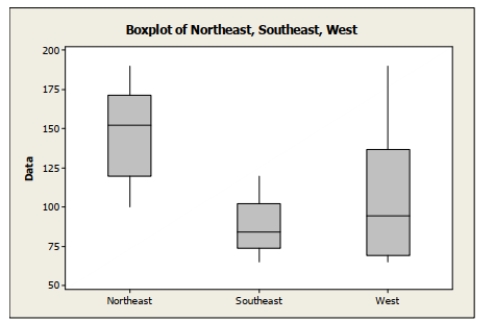
A. Which region has the highest median sales revenue?
b. Which region has the lowest median sales revenue?
c. Which region has the most variable sales revenue values? Explain.
discount office supply company with locations in three different regions of the U.S.
(Northeast, Southeast, and West).
A. Which region has the highest median sales revenue?
b. Which region has the lowest median sales revenue?
c. Which region has the most variable sales revenue values? Explain.
Question
Following is a histogram of salaries (in $) for a sample of U.S. marketing managers.
Comment on the shape of the distribution.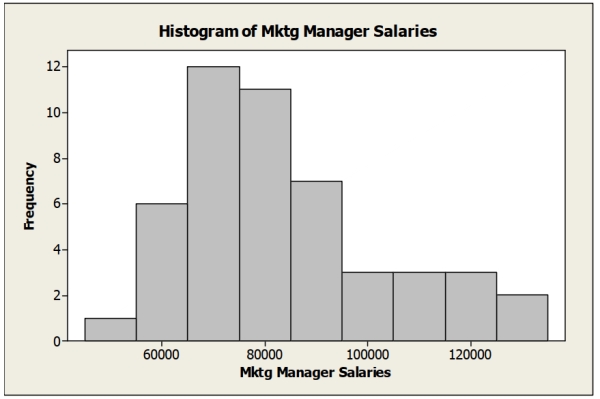
Comment on the shape of the distribution.
Question
The following table shows representative recent closing share prices in late 2013 for a
small sample of companies based in India.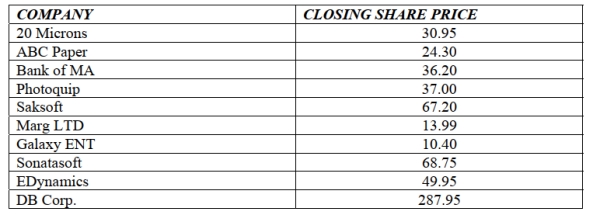
A. Calculate the mean.
b. Calculate the standard deviation.
c. Standardize the share price for DP Corp. (find the z score). Interpret its meaning.
small sample of companies based in India.
A. Calculate the mean.
b. Calculate the standard deviation.
c. Standardize the share price for DP Corp. (find the z score). Interpret its meaning.
Question
Question
The following boxplots show monthly sales revenue figures ($ thousands) for a discount office supply company with locations in three different regions of the U.S.
(Northeast, Southeast, and West). Which of the following statements is true?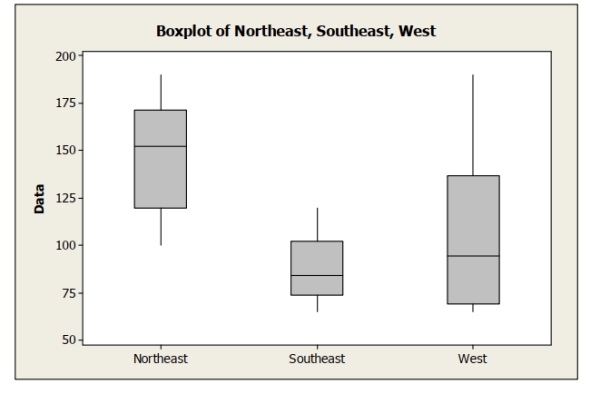
A) The Northeast has the lowest mean sales revenue.
B) The Southeast has the lowest median sales revenue.
C) The West has the lowest mean sales revenue.
D) The West has the lowest median sales revenue.
E) None of the above.
Question
Below is a histogram of salaries (in $) for a sample of U.S. marketing managers. 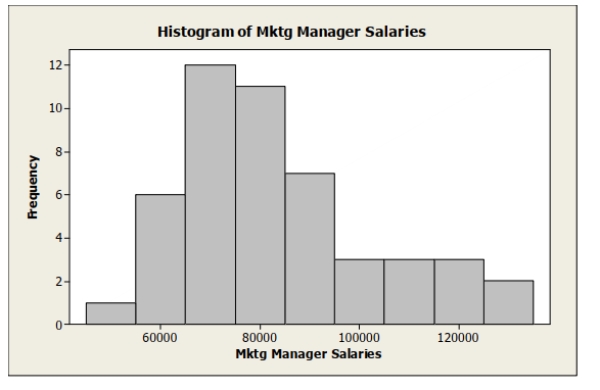 The shape of this distribution is
A) symmetric.
B) bimodal.
C) right skewed.
D) left skewed.
E) normal.
The shape of this distribution isA) symmetric.
B) bimodal.
C) right skewed.
D) left skewed.
E) normal.
Question
Following is the five number summary of the hourly wages ($) for advertising /
promotion managers displayed in question 1.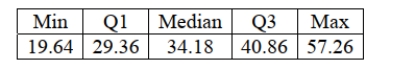
A. Would you expect the mean salary for this sample of marketing managers to be higher
or lower than the median? Explain.
b. Which would be a more appropriate measure of central tendency for these data, the
mean or median? Explain.
c. Calculate the range.
d. Calculate the IQR.
Question
Consider the five number summary for salaries of U.S. marketing managers. 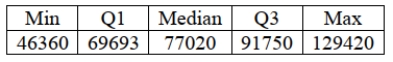 Suppose the marketing manager who was earning $129,420 got a raise and is now earning $140,000. Which of the following statement is true?
A) The mean would increase.
B) The median would increase.
C) The range would increase.
D) Both A and C.
E) All of the above.
Suppose the marketing manager who was earning $129,420 got a raise and is now earning $140,000. Which of the following statement is true?A) The mean would increase.
B) The median would increase.
C) The range would increase.
D) Both A and C.
E) All of the above.
Question
Following is the five-number summary of salaries (in $) for a sample of U.S.
marketing managers displayed in question 1.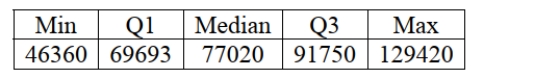
A. Would you expect the mean salary for this sample of marketing managers to be higher
or lower than the median? Explain.
b. Which would be a more appropriate measure of central tendency for these data, the
mean or median? Explain.
c. Calculate the range.
d. Calculate the IQR.
Question
Below is a histogram of salaries (in $) for a sample of U.S. marketing managers. 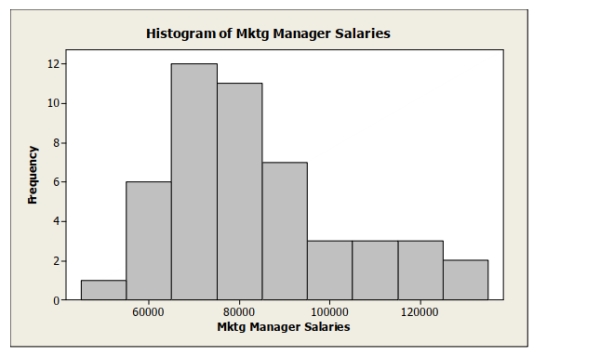 The most appropriate measure of central tendency for these data is the
A) median.
B) mean.
C) mode.
D) range.
E) standard deviation.
The most appropriate measure of central tendency for these data is theA) median.
B) mean.
C) mode.
D) range.
E) standard deviation.
Question
Data were collected on the hourly wage ($) for two types of marketing managers: (1)
advertising / promotion managers and (2) sales managers. The results were used to create
the following histograms.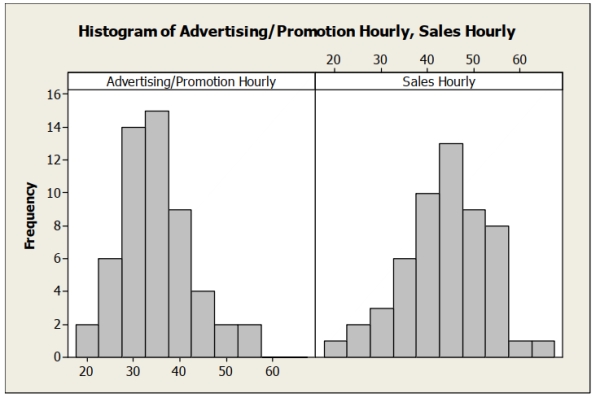
A. Describe the hourly wage distribution for advertising/promotion managers.
b. Describe the hourly wage distribution for sales managers.
c. Compare the hourly wages for the two types of marketing managers based on the
histograms.
Question
The following boxplots show the closing share prices for a sample of oil companies'
percentage change from today and 3 months ago or 1 year ago.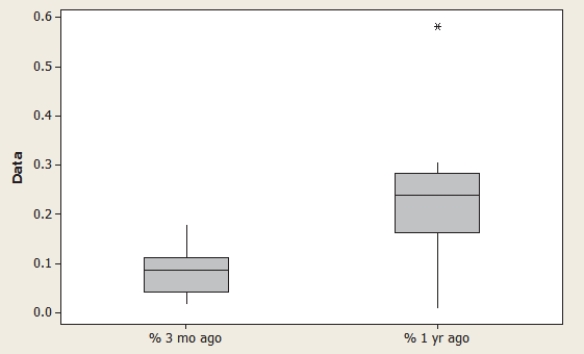
A. For which timeframe was the median closing share percentage higher?
b. For which timeframe were the closing share prices more variable? Explain.
c. Which distribution is more symmetric? Explain.
percentage change from today and 3 months ago or 1 year ago.
A. For which timeframe was the median closing share percentage higher?
b. For which timeframe were the closing share prices more variable? Explain.
c. Which distribution is more symmetric? Explain.
Question
The following table shows data for total assets ($ billion) for a small sample of U.S. banks (late 2013). 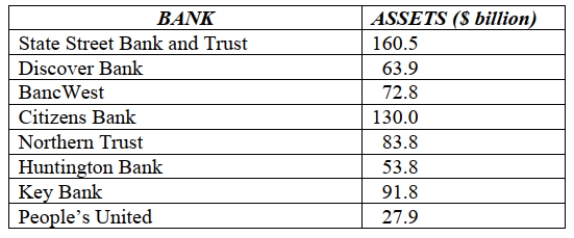 The mean for the total assets data ($ billion) is
A) $78.3.
B) $56.3.
C) $85.6.
D) $120.5.
E) $42.4.
The mean for the total assets data ($ billion) isA) $78.3.
B) $56.3.
C) $85.6.
D) $120.5.
E) $42.4.
Question
Following is a time series graph for monthly closing price for the Dow Jones
Industrial Average (beginning March 2003).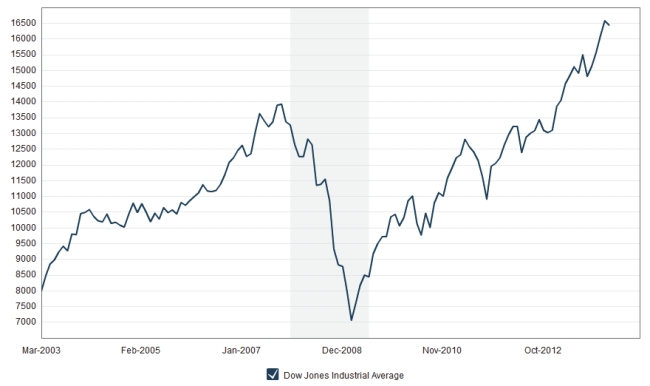
A. Are the closing prices for the Dow Jones Average from October 2004 through
December 2006 fairly stationary? Explain.
b. What was the most volatile period of time for the Dow Jones average? Explain.
c. Would a histogram provide a good summary of these stock prices? Explain.
Question
Here is the five number summary for salaries of U.S. marketing managers. 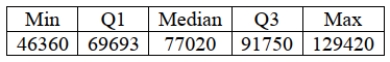 The IQR is
A) $83,060.
B) $22.057.
C) $69,693.
D) $77.020.
E) $14,566.
The IQR isA) $83,060.
B) $22.057.
C) $69,693.
D) $77.020.
E) $14,566.
Question
Consider the five number summary of hourly wages ($) for a sample of advertising / promotion managers. 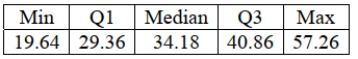 Suppose there had been an error and that the lowest hourly wage was $15.50 instead of
$19)64. This would result in
A) an increase in the median.
B) an increase in the standard deviation.
C) a decrease in the range.
D) a decrease in the IQR.
E) an increase in the mean.
Suppose there had been an error and that the lowest hourly wage was $15.50 instead of$19)64. This would result in
A) an increase in the median.
B) an increase in the standard deviation.
C) a decrease in the range.
D) a decrease in the IQR.
E) an increase in the mean.
Question
The following boxplots show the closing share prices for a sample of technology companies on the first trading days in August 2007 and in August 2002. Which of the
Following statement is true?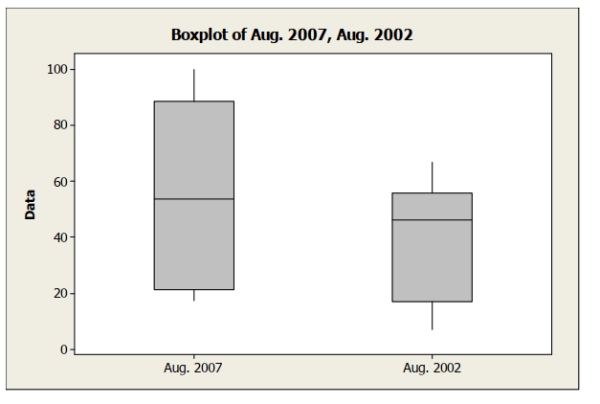
A) The median closing share price is higher in August 2007 compared to August 2002.
B) Closing prices are more variable in August 2007 compared to August 2002.
C) The distribution of closing prices in August 2007 appears more symmetric than the
Distribution of closing prices in August 2002.
D) Both A and B.
E) All of the above.
Question
The following table shows total assets ($ billion) for a small sample of U.S. banks. 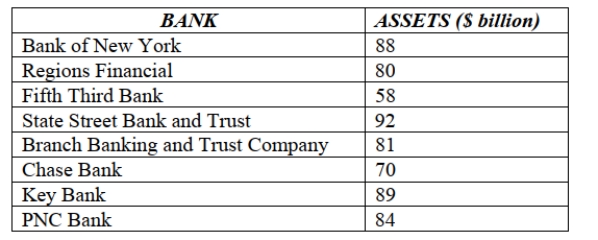 The mean for these data is
A) $ 80.25 billion.
B) $ 100.35 billion.
C) $ 75.68 billion.
D) $ 84 billion.
E) $ 89 billion.
The mean for these data isA) $ 80.25 billion.
B) $ 100.35 billion.
C) $ 75.68 billion.
D) $ 84 billion.
E) $ 89 billion.
Question
Consider the five number summary of hourly wages ($) for a sample of sales managers. 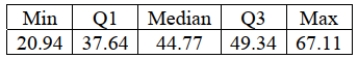 The IQR for these data is
A) $11.70
B) $46.17
C) $67.11
D) $20.94
E) $44.77
The IQR for these data isA) $11.70
B) $46.17
C) $67.11
D) $20.94
E) $44.77
Question
The following boxplots show monthly sales revenue figures ($ thousands) for a discount office supply company with locations in three different regions of the U.S.
(Northeast, Southeast, and West). Which of the following statements is false?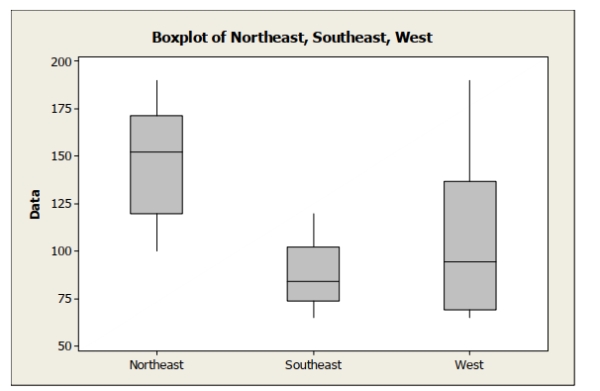
A) The West has the most variable sales revenues.
B) The West has the largest IQR.
C) The Southeast has the smallest IQR.
D) The Northeast has the most variable sales revenues.
E) The Southeast has the least variable sales revenues.
Question
Consider the five number summary of hourly wages ($) for a sample of sales managers. Suppose the mean hourly wage is $38.50. What can we say about the shape
Of the distribution?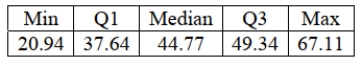
A) The distribution of hourly wages for sales managers is symmetric.
B) The distribution of hourly wages for sales managers is skewed right.
C) The distribution of hourly wages for sales managers is skewed left.
D) The distribution of hourly wages for sales managers is bimodal.
E) None of the above.
Question
Consider the five number summary of hourly wages ($) for a sample of sales managers. 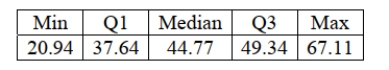 The range for these data is
A) $11.70
B) $46.17
C) $67.11
D) $20.94
E) $44.77
The range for these data isA) $11.70
B) $46.17
C) $67.11
D) $20.94
E) $44.77
Question
The following table shows total assets ($ billion) for a small sample of U.S. banks. 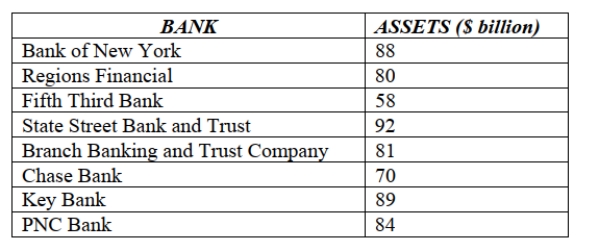 The standard deviation for these data is
A) $12.78 billion.
B) $ 11.27 billion.
C) $ 127.01 billion.
D) $ 21.67 billion.
E) $ 34 billion.
The standard deviation for these data isA) $12.78 billion.
B) $ 11.27 billion.
C) $ 127.01 billion.
D) $ 21.67 billion.
E) $ 34 billion.
Question
Question
Data were collected on the hourly wage ($) for two types of marketing managers: (1) advertising / promotion managers and (2) sales managers. The results were used to create
The following histograms. Which of the following statements is true?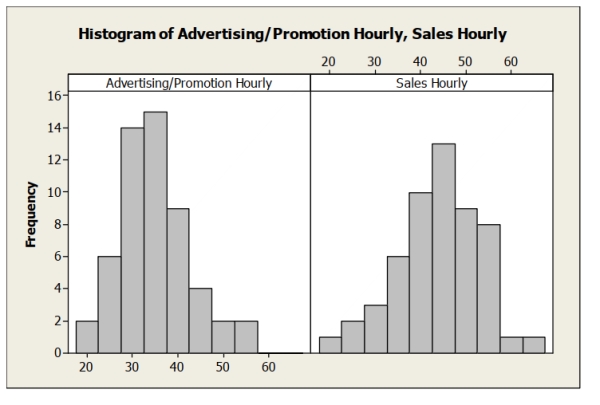
A) The distribution of hourly wages for sales managers is unimodal and skewed right.
B) The distribution of hourly wages for advertising/promotion managers is unimodal and
Skewed left.
C) The distribution of hourly wages for sales managers is unimodal and skewed left.
D) It appears that sales managers earn a lower hourly wage compared to
Advertising/promotion managers.
E) Both C and D.
Question
Following is a time series graph for monthly closing price for the Dow Jones Industrial Average (beginning March 2003). Which of the following statements is true? 
A) A histogram would provide a good representation of these data.
B) The data show an upward trend since late 2008.
C) The data show a 50% drop in the Dow Jones Average by the end of 2008.
D) Both A and C.
E) Both B and C.
A) A histogram would provide a good representation of these data.
B) The data show an upward trend since late 2008.
C) The data show a 50% drop in the Dow Jones Average by the end of 2008.
D) Both A and C.
E) Both B and C.
Question
The following table shows total assets ($ billion) for a small sample of U.S. banks. 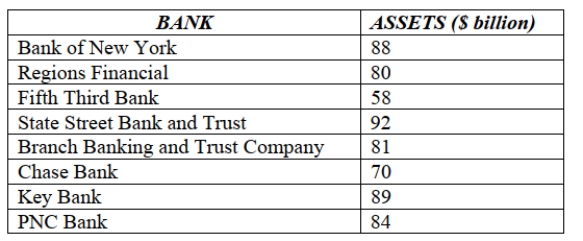 The z- score for the total assets of Fifth Third Bank is
A) 1.25.
B) -1.25.
C) -2.5.
D) 1.97.
E) -1.97.
The z- score for the total assets of Fifth Third Bank isA) 1.25.
B) -1.25.
C) -2.5.
D) 1.97.
E) -1.97.

Unlock Deck
Sign up to unlock the cards in this deck!
Unlock Deck
Unlock Deck
1/32
Play
Full screen (f)
Deck 3: Displaying and Describing Quantitative Data
1
Following is the five number summary of the hourly wages ($) for sales managers
displayed in question 1. Suppose there had been an error and that the lowest hourly wage for sales managers was
$18.50 instead of $20.94. Indicate how this change would affect the following summary
statistics (increase, decrease, or stay about the same):
A. Mean
b. Median
c. Range
d. IQR
e. Standard deviation
displayed in question 1.
Suppose there had been an error and that the lowest hourly wage for sales managers was$18.50 instead of $20.94. Indicate how this change would affect the following summary
statistics (increase, decrease, or stay about the same):
A. Mean
b. Median
c. Range
d. IQR
e. Standard deviation
2
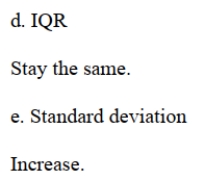
Suppose the marketing manager who was earning $129,420 got a raise and is now
earning $140,000. Indicate how this change would affect the following summary
statistics (increase, decrease, or stay about the same):
A. Mean
b. Median
c. Range
d. IQR
e. Standard deviation
earning $140,000. Indicate how this change would affect the following summary
statistics (increase, decrease, or stay about the same):
A. Mean
b. Median
c. Range
d. IQR
e. Standard deviation
3
The following table shows data on total assets ($ billion) for a small sample of U.S.
banks. Prepare a stem and leaf display. Comment on the shape of the distribution.
banks. Prepare a stem and leaf display. Comment on the shape of the distribution.
4
The following table shows representative recent closing share prices in late 2013 for a small sample of companies based in India.
A) 2.76.
B) 0.47.
C) -2.76.
D) -1.49.
E) -0.47.
A) 2.76.
B) 0.47.
C) -2.76.
D) -1.49.
E) -0.47.
Unlock Deck
Unlock for access to all 32 flashcards in this deck.
Unlock Deck
k this deck
5
The following table shows representative recent closing share prices for a small sample of companies based in India in late 2013.
A) $81.6.
B) $25.8.
C) $36.6.
D) $62.7.
E) $67.6.
A) $81.6.
B) $25.8.
C) $36.6.
D) $62.7.
E) $67.6.
Unlock Deck
Unlock for access to all 32 flashcards in this deck.
Unlock Deck
k this deck
6
The following boxplots show monthly sales revenue figures ($ thousands) for a
discount office supply company with locations in three different regions of the U.S.
(Northeast, Southeast, and West).
A. Which region has the highest median sales revenue?
b. Which region has the lowest median sales revenue?
c. Which region has the most variable sales revenue values? Explain.
discount office supply company with locations in three different regions of the U.S.
(Northeast, Southeast, and West).
A. Which region has the highest median sales revenue?
b. Which region has the lowest median sales revenue?
c. Which region has the most variable sales revenue values? Explain.
Unlock Deck
Unlock for access to all 32 flashcards in this deck.
Unlock Deck
k this deck
7
Following is a histogram of salaries (in $) for a sample of U.S. marketing managers.
Comment on the shape of the distribution.
Comment on the shape of the distribution.
Unlock Deck
Unlock for access to all 32 flashcards in this deck.
Unlock Deck
k this deck
8
The following table shows representative recent closing share prices in late 2013 for a
small sample of companies based in India.
A. Calculate the mean.
b. Calculate the standard deviation.
c. Standardize the share price for DP Corp. (find the z score). Interpret its meaning.
small sample of companies based in India.
A. Calculate the mean.
b. Calculate the standard deviation.
c. Standardize the share price for DP Corp. (find the z score). Interpret its meaning.
Unlock Deck
Unlock for access to all 32 flashcards in this deck.
Unlock Deck
k this deck
9
For the data on total assets ($ billion) for a small sample of U.S. banks provided in the
previous question:
A. Calculate the mean.
b. Calculate the standard deviation.
c. Standardize the asset value of State Street Bank and Trust (find the z score). Interpret
its meaning.
previous question:
A. Calculate the mean.
b. Calculate the standard deviation.
c. Standardize the asset value of State Street Bank and Trust (find the z score). Interpret
its meaning.
Unlock Deck
Unlock for access to all 32 flashcards in this deck.
Unlock Deck
k this deck
10
The following boxplots show monthly sales revenue figures ($ thousands) for a discount office supply company with locations in three different regions of the U.S.
(Northeast, Southeast, and West). Which of the following statements is true?
A) The Northeast has the lowest mean sales revenue.
B) The Southeast has the lowest median sales revenue.
C) The West has the lowest mean sales revenue.
D) The West has the lowest median sales revenue.
E) None of the above.
Unlock Deck
Unlock for access to all 32 flashcards in this deck.
Unlock Deck
k this deck
11
Below is a histogram of salaries (in $) for a sample of U.S. marketing managers. The shape of this distribution is
A) symmetric.
B) bimodal.
C) right skewed.
D) left skewed.
E) normal.
The shape of this distribution isA) symmetric.
B) bimodal.
C) right skewed.
D) left skewed.
E) normal.
Unlock Deck
Unlock for access to all 32 flashcards in this deck.
Unlock Deck
k this deck
12
Following is the five number summary of the hourly wages ($) for advertising /
promotion managers displayed in question 1.
A. Would you expect the mean salary for this sample of marketing managers to be higher
or lower than the median? Explain.
b. Which would be a more appropriate measure of central tendency for these data, the
mean or median? Explain.
c. Calculate the range.
d. Calculate the IQR.
promotion managers displayed in question 1.
A. Would you expect the mean salary for this sample of marketing managers to be higher
or lower than the median? Explain.
b. Which would be a more appropriate measure of central tendency for these data, the
mean or median? Explain.
c. Calculate the range.
d. Calculate the IQR.
Unlock Deck
Unlock for access to all 32 flashcards in this deck.
Unlock Deck
k this deck
13
Consider the five number summary for salaries of U.S. marketing managers. Suppose the marketing manager who was earning $129,420 got a raise and is now earning $140,000. Which of the following statement is true?
A) The mean would increase.
B) The median would increase.
C) The range would increase.
D) Both A and C.
E) All of the above.
Suppose the marketing manager who was earning $129,420 got a raise and is now earning $140,000. Which of the following statement is true?A) The mean would increase.
B) The median would increase.
C) The range would increase.
D) Both A and C.
E) All of the above.
Unlock Deck
Unlock for access to all 32 flashcards in this deck.
Unlock Deck
k this deck
14
Following is the five-number summary of salaries (in $) for a sample of U.S.
marketing managers displayed in question 1.
A. Would you expect the mean salary for this sample of marketing managers to be higher
or lower than the median? Explain.
b. Which would be a more appropriate measure of central tendency for these data, the
mean or median? Explain.
c. Calculate the range.
d. Calculate the IQR.
marketing managers displayed in question 1.
A. Would you expect the mean salary for this sample of marketing managers to be higher
or lower than the median? Explain.
b. Which would be a more appropriate measure of central tendency for these data, the
mean or median? Explain.
c. Calculate the range.
d. Calculate the IQR.
Unlock Deck
Unlock for access to all 32 flashcards in this deck.
Unlock Deck
k this deck
15
Below is a histogram of salaries (in $) for a sample of U.S. marketing managers. The most appropriate measure of central tendency for these data is the
A) median.
B) mean.
C) mode.
D) range.
E) standard deviation.
The most appropriate measure of central tendency for these data is theA) median.
B) mean.
C) mode.
D) range.
E) standard deviation.
Unlock Deck
Unlock for access to all 32 flashcards in this deck.
Unlock Deck
k this deck
16
Data were collected on the hourly wage ($) for two types of marketing managers: (1)
advertising / promotion managers and (2) sales managers. The results were used to create
the following histograms.
A. Describe the hourly wage distribution for advertising/promotion managers.
b. Describe the hourly wage distribution for sales managers.
c. Compare the hourly wages for the two types of marketing managers based on the
histograms.
advertising / promotion managers and (2) sales managers. The results were used to create
the following histograms.
A. Describe the hourly wage distribution for advertising/promotion managers.
b. Describe the hourly wage distribution for sales managers.
c. Compare the hourly wages for the two types of marketing managers based on the
histograms.
Unlock Deck
Unlock for access to all 32 flashcards in this deck.
Unlock Deck
k this deck
17
The following boxplots show the closing share prices for a sample of oil companies'
percentage change from today and 3 months ago or 1 year ago.
A. For which timeframe was the median closing share percentage higher?
b. For which timeframe were the closing share prices more variable? Explain.
c. Which distribution is more symmetric? Explain.
percentage change from today and 3 months ago or 1 year ago.
A. For which timeframe was the median closing share percentage higher?
b. For which timeframe were the closing share prices more variable? Explain.
c. Which distribution is more symmetric? Explain.
Unlock Deck
Unlock for access to all 32 flashcards in this deck.
Unlock Deck
k this deck
18
The following table shows data for total assets ($ billion) for a small sample of U.S. banks (late 2013). The mean for the total assets data ($ billion) is
A) $78.3.
B) $56.3.
C) $85.6.
D) $120.5.
E) $42.4.
The mean for the total assets data ($ billion) isA) $78.3.
B) $56.3.
C) $85.6.
D) $120.5.
E) $42.4.
Unlock Deck
Unlock for access to all 32 flashcards in this deck.
Unlock Deck
k this deck
19
Following is a time series graph for monthly closing price for the Dow Jones
Industrial Average (beginning March 2003).
A. Are the closing prices for the Dow Jones Average from October 2004 through
December 2006 fairly stationary? Explain.
b. What was the most volatile period of time for the Dow Jones average? Explain.
c. Would a histogram provide a good summary of these stock prices? Explain.
Industrial Average (beginning March 2003).
A. Are the closing prices for the Dow Jones Average from October 2004 through
December 2006 fairly stationary? Explain.
b. What was the most volatile period of time for the Dow Jones average? Explain.
c. Would a histogram provide a good summary of these stock prices? Explain.
Unlock Deck
Unlock for access to all 32 flashcards in this deck.
Unlock Deck
k this deck
20
Here is the five number summary for salaries of U.S. marketing managers. The IQR is
A) $83,060.
B) $22.057.
C) $69,693.
D) $77.020.
E) $14,566.
The IQR isA) $83,060.
B) $22.057.
C) $69,693.
D) $77.020.
E) $14,566.
Unlock Deck
Unlock for access to all 32 flashcards in this deck.
Unlock Deck
k this deck
21
Consider the five number summary of hourly wages ($) for a sample of advertising / promotion managers. Suppose there had been an error and that the lowest hourly wage was $15.50 instead of
$19)64. This would result in
A) an increase in the median.
B) an increase in the standard deviation.
C) a decrease in the range.
D) a decrease in the IQR.
E) an increase in the mean.
Suppose there had been an error and that the lowest hourly wage was $15.50 instead of$19)64. This would result in
A) an increase in the median.
B) an increase in the standard deviation.
C) a decrease in the range.
D) a decrease in the IQR.
E) an increase in the mean.
Unlock Deck
Unlock for access to all 32 flashcards in this deck.
Unlock Deck
k this deck
22
The following boxplots show the closing share prices for a sample of technology companies on the first trading days in August 2007 and in August 2002. Which of the
Following statement is true?
A) The median closing share price is higher in August 2007 compared to August 2002.
B) Closing prices are more variable in August 2007 compared to August 2002.
C) The distribution of closing prices in August 2007 appears more symmetric than the
Distribution of closing prices in August 2002.
D) Both A and B.
E) All of the above.
Following statement is true?
A) The median closing share price is higher in August 2007 compared to August 2002.
B) Closing prices are more variable in August 2007 compared to August 2002.
C) The distribution of closing prices in August 2007 appears more symmetric than the
Distribution of closing prices in August 2002.
D) Both A and B.
E) All of the above.
Unlock Deck
Unlock for access to all 32 flashcards in this deck.
Unlock Deck
k this deck
23
The following table shows total assets ($ billion) for a small sample of U.S. banks. The mean for these data is
A) $ 80.25 billion.
B) $ 100.35 billion.
C) $ 75.68 billion.
D) $ 84 billion.
E) $ 89 billion.
The mean for these data isA) $ 80.25 billion.
B) $ 100.35 billion.
C) $ 75.68 billion.
D) $ 84 billion.
E) $ 89 billion.
Unlock Deck
Unlock for access to all 32 flashcards in this deck.
Unlock Deck
k this deck
24
Consider the five number summary of hourly wages ($) for a sample of sales managers. The IQR for these data is
A) $11.70
B) $46.17
C) $67.11
D) $20.94
E) $44.77
The IQR for these data isA) $11.70
B) $46.17
C) $67.11
D) $20.94
E) $44.77
Unlock Deck
Unlock for access to all 32 flashcards in this deck.
Unlock Deck
k this deck
25
The following boxplots show monthly sales revenue figures ($ thousands) for a discount office supply company with locations in three different regions of the U.S.
(Northeast, Southeast, and West). Which of the following statements is false?
A) The West has the most variable sales revenues.
B) The West has the largest IQR.
C) The Southeast has the smallest IQR.
D) The Northeast has the most variable sales revenues.
E) The Southeast has the least variable sales revenues.
Unlock Deck
Unlock for access to all 32 flashcards in this deck.
Unlock Deck
k this deck
26
Consider the five number summary of hourly wages ($) for a sample of sales managers. Suppose the mean hourly wage is $38.50. What can we say about the shape
Of the distribution?
A) The distribution of hourly wages for sales managers is symmetric.
B) The distribution of hourly wages for sales managers is skewed right.
C) The distribution of hourly wages for sales managers is skewed left.
D) The distribution of hourly wages for sales managers is bimodal.
E) None of the above.
Of the distribution?
A) The distribution of hourly wages for sales managers is symmetric.
B) The distribution of hourly wages for sales managers is skewed right.
C) The distribution of hourly wages for sales managers is skewed left.
D) The distribution of hourly wages for sales managers is bimodal.
E) None of the above.
Unlock Deck
Unlock for access to all 32 flashcards in this deck.
Unlock Deck
k this deck
27
Consider the five number summary of hourly wages ($) for a sample of sales managers. The range for these data is
A) $11.70
B) $46.17
C) $67.11
D) $20.94
E) $44.77
The range for these data isA) $11.70
B) $46.17
C) $67.11
D) $20.94
E) $44.77
Unlock Deck
Unlock for access to all 32 flashcards in this deck.
Unlock Deck
k this deck
28
The following table shows total assets ($ billion) for a small sample of U.S. banks. The standard deviation for these data is
A) $12.78 billion.
B) $ 11.27 billion.
C) $ 127.01 billion.
D) $ 21.67 billion.
E) $ 34 billion.
The standard deviation for these data isA) $12.78 billion.
B) $ 11.27 billion.
C) $ 127.01 billion.
D) $ 21.67 billion.
E) $ 34 billion.
Unlock Deck
Unlock for access to all 32 flashcards in this deck.
Unlock Deck
k this deck
29
The ASQ (American Society for Quality) regularly conducts a salary survey of its membership, primarily quality management professionals. Based on the most recently
Published mean and standard deviation, a quality control specialist calculated the z-score
Associated with his own salary and found it was -2.50. This tells him that his salary is
A) 2 and a half times more than the average salary.
B) 2 and a half times less than the average salary.
C) is 2.5 standard deviations above the average salary.
D) is 2.5 standard deviations below the average salary.
E) much higher than the average salary.
Unlock Deck
Unlock for access to all 32 flashcards in this deck.
Unlock Deck
k this deck
30
Data were collected on the hourly wage ($) for two types of marketing managers: (1) advertising / promotion managers and (2) sales managers. The results were used to create
The following histograms. Which of the following statements is true?
A) The distribution of hourly wages for sales managers is unimodal and skewed right.
B) The distribution of hourly wages for advertising/promotion managers is unimodal and
Skewed left.
C) The distribution of hourly wages for sales managers is unimodal and skewed left.
D) It appears that sales managers earn a lower hourly wage compared to
Advertising/promotion managers.
E) Both C and D.
The following histograms. Which of the following statements is true?
A) The distribution of hourly wages for sales managers is unimodal and skewed right.
B) The distribution of hourly wages for advertising/promotion managers is unimodal and
Skewed left.
C) The distribution of hourly wages for sales managers is unimodal and skewed left.
D) It appears that sales managers earn a lower hourly wage compared to
Advertising/promotion managers.
E) Both C and D.
Unlock Deck
Unlock for access to all 32 flashcards in this deck.
Unlock Deck
k this deck
31
Following is a time series graph for monthly closing price for the Dow Jones Industrial Average (beginning March 2003). Which of the following statements is true?
A) A histogram would provide a good representation of these data.
B) The data show an upward trend since late 2008.
C) The data show a 50% drop in the Dow Jones Average by the end of 2008.
D) Both A and C.
E) Both B and C.
A) A histogram would provide a good representation of these data.
B) The data show an upward trend since late 2008.
C) The data show a 50% drop in the Dow Jones Average by the end of 2008.
D) Both A and C.
E) Both B and C.
Unlock Deck
Unlock for access to all 32 flashcards in this deck.
Unlock Deck
k this deck
32
The following table shows total assets ($ billion) for a small sample of U.S. banks. The z- score for the total assets of Fifth Third Bank is
A) 1.25.
B) -1.25.
C) -2.5.
D) 1.97.
E) -1.97.
The z- score for the total assets of Fifth Third Bank isA) 1.25.
B) -1.25.
C) -2.5.
D) 1.97.
E) -1.97.
Unlock Deck
Unlock for access to all 32 flashcards in this deck.
Unlock Deck
k this deck
Unlock Deck
Unlock for access to all 32 flashcards in this deck.


