Deck 5: Displaying and Describing Quantitative Data
Full screen (f)
Question
The following table shows closing share prices for a small sample of companies. 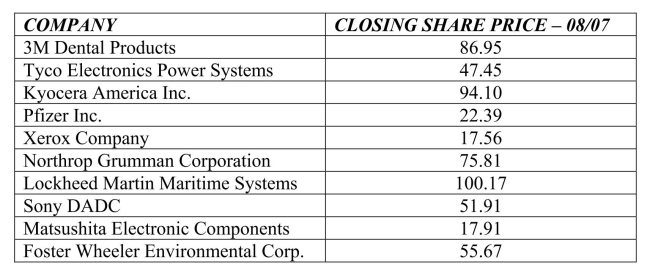 The z score for the share price for Matsushita Electronic Components is
A)1.24.
B)2.34.
C)-2.34.
D)-3.00.
E)-1.24.
The z score for the share price for Matsushita Electronic Components isA)1.24.
B)2.34.
C)-2.34.
D)-3.00.
E)-1.24.
Question
Consider the five number summary of hourly wages ($) for a sample of sales managers.  The IQR for these data is
A)$11.70
B)$46.17
C)$67.11
D)$20.94
E)$44.77
The IQR for these data isA)$11.70
B)$46.17
C)$67.11
D)$20.94
E)$44.77
Question
The following boxplots show monthly sales revenue figures ($ thousands) for a discount office supply company with locations in three different regions of the U.S.
(Northeast, Southeast, and West).Which of the following statements is false?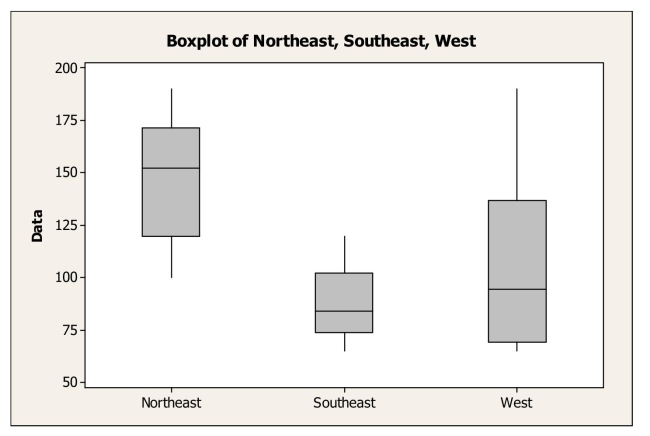
A)The west has the most variable sales revenues.
B)The west has the largest IQR.
C)The southeast has the smallest IQR.
D)The northeast has the most variable sales revenues.
E)The southeast has the least variable sales revenues.
Question
Question
The following table shows closing share prices for a small sample of companies. 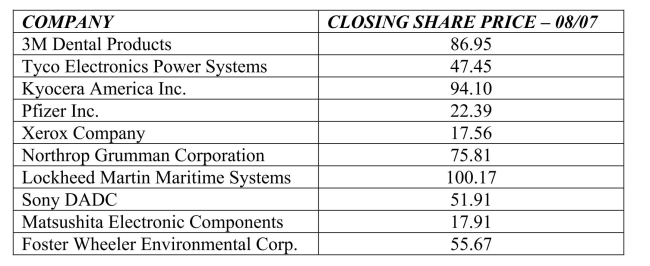 The mean closing share price is
A)$31.23.
B)$44.65.
C)$56.99.
D)$62.19.
E)$75.77.
The mean closing share price isA)$31.23.
B)$44.65.
C)$56.99.
D)$62.19.
E)$75.77.
Question
Here is the five number summary for salaries of U.S.marketing managers. 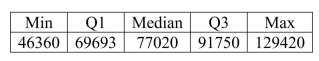 The IQR is
A)$83,060.
B)$22.057.
C)$69,693.
D)$77.020.
E)$14,566.
The IQR isA)$83,060.
B)$22.057.
C)$69,693.
D)$77.020.
E)$14,566.
Question
Below is a histogram of salaries (in $) for a sample of U.S.marketing managers. 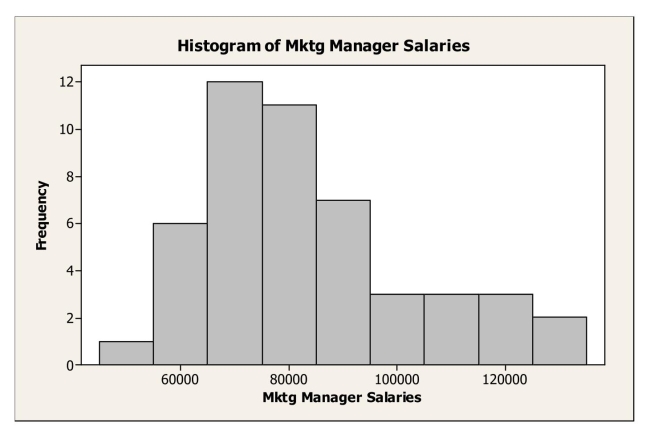 The shape of this distribution is
A)symmetric.
B)bimodal.
C)right skewed.
D)left skewed.
E)normal.
The shape of this distribution isA)symmetric.
B)bimodal.
C)right skewed.
D)left skewed.
E)normal.
Question
Consider the five number summary of hourly wages ($) for a sample of advertising / promotion managers. 
A)an increase in the median.
B)an increase in the standard deviation.
C)a decrease in the range.
D)a decrease in the IQR.
E)an increase in the mean.
A)an increase in the median.
B)an increase in the standard deviation.
C)a decrease in the range.
D)a decrease in the IQR.
E)an increase in the mean.
Question
The following boxplots show monthly sales revenue figures ($ thousands) for a discount office supply company with locations in three different regions of the U.S.
(Northeast, Southeast, and West).Which of the following statements is true?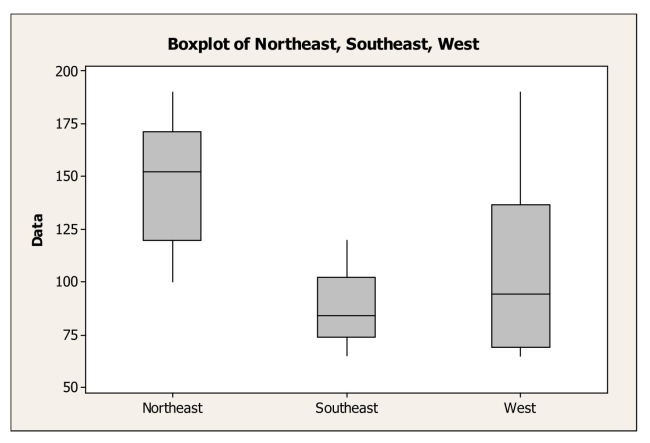 5-20 Chapter 5 Displaying and Describing Quantitative Data
A)The northeast has the lowest mean sales revenue.
B)The southeast has the lowest median sales revenue.
C)The west has the lowest mean sales revenue.
D)The west has the lowest median sales revenue.
E)None of the above.
(Northeast, Southeast, and West).Which of the following statements is true?
5-20 Chapter 5 Displaying and Describing Quantitative DataA)The northeast has the lowest mean sales revenue.
B)The southeast has the lowest median sales revenue.
C)The west has the lowest mean sales revenue.
D)The west has the lowest median sales revenue.
E)None of the above.
Question
Consider the five number summary of hourly wages ($) for a sample of sales managers. 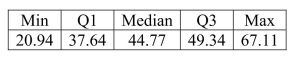
A)$11.70
B)$46.17
C)$67.11
D)$20.94
E)$44.77
A)$11.70
B)$46.17
C)$67.11
D)$20.94
E)$44.77
Question
Below is a histogram of salaries (in $) for a sample of U.S.marketing managers. 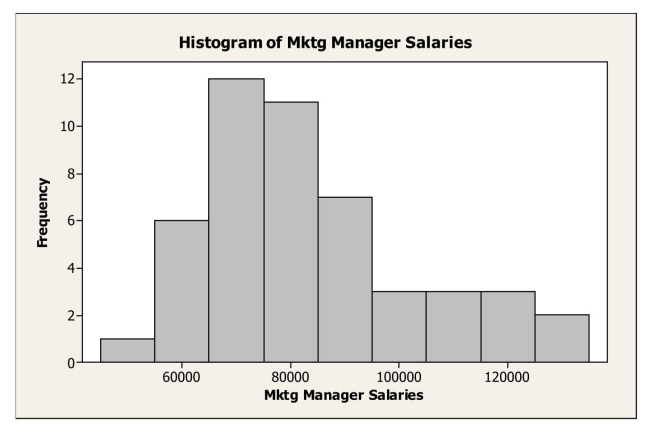 The most appropriate measure of central tendency for these data is the
A)median.
B)mean.
C)mode.
D)range.
E)standard deviation.
The most appropriate measure of central tendency for these data is theA)median.
B)mean.
C)mode.
D)range.
E)standard deviation.
Question
The following table shows closing share prices for a small sample of companies. 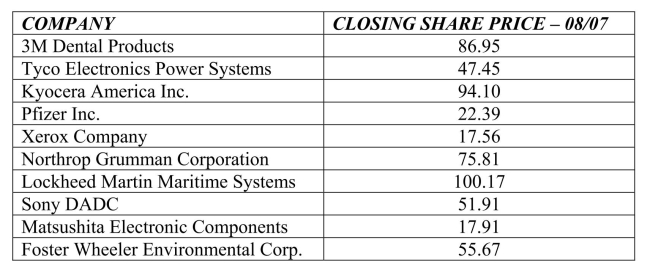 The standard deviation in closing share prices is
A)$31.43.
B)$44.65.
C)$56.99.
D)$62.19.
E)$75.77.
The standard deviation in closing share prices isA)$31.43.
B)$44.65.
C)$56.99.
D)$62.19.
E)$75.77.
Question
The following table shows total assets ($ billion) for a small sample of U.S.banks. 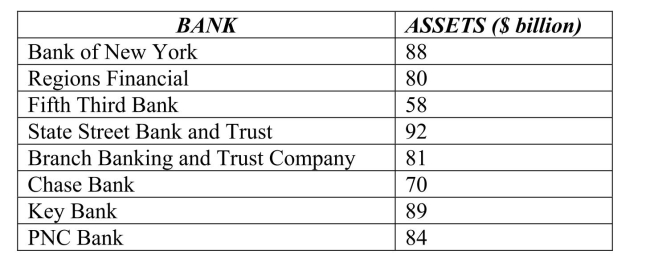 The z- score for the total assets of Fifth Third Bank is
A)1.25.
B)-1.25.
C)-2.5.
D)1.97.
E)-1.97.
The z- score for the total assets of Fifth Third Bank isA)1.25.
B)-1.25.
C)-2.5.
D)1.97.
E)-1.97.
Question
The following table shows total assets ($ billion) for a small sample of U.S.banks. 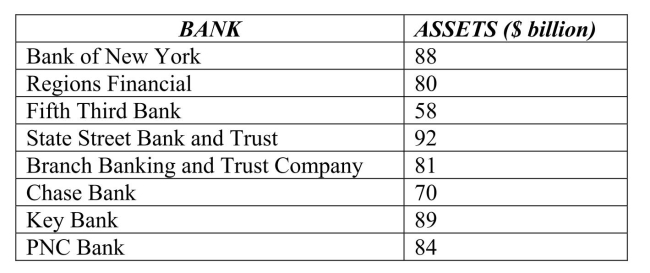 The standard deviation for these data is
A)$12.78 billion.
B)$ 11.27 billion.
C)$ 127.01 billion.
D)$ 21.67 billion.
E)$ 34 billion.
The standard deviation for these data isA)$12.78 billion.
B)$ 11.27 billion.
C)$ 127.01 billion.
D)$ 21.67 billion.
E)$ 34 billion.
Question
Consider the five number summary of hourly wages ($) for a sample of sales managers.Suppose the mean hourly wage is $38.50.What can we say about the shape
Of the distribution?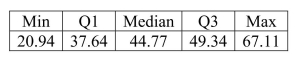
A)The distribution of hourly wages for sales managers is symmetric.
B)The distribution of hourly wages for sales managers is skewed right.
C)The distribution of hourly wages for sales managers is skewed left.
D)The distribution of hourly wages for sales managers is bimodal.
E)None of the above.
Question
The following table shows total assets ($ billion) for a small sample of U.S.banks. 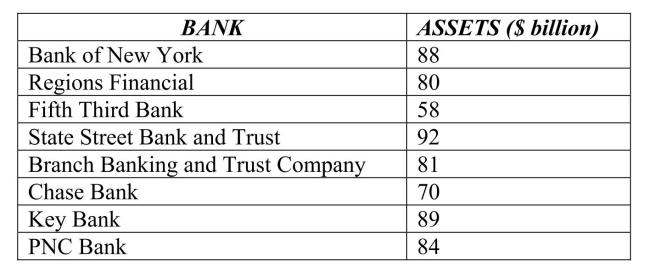 The mean for these data is
A)$ 80.25 billion.
B)$ 100.35 billion.
C)$ 75.68 billion.
D)$ 84 billion.
E)$ 89 billion.
The mean for these data isA)$ 80.25 billion.
B)$ 100.35 billion.
C)$ 75.68 billion.
D)$ 84 billion.
E)$ 89 billion.
Question
Consider the five number summary for salaries of U.S.marketing managers. 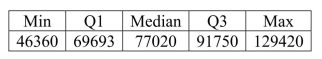 Suppose the marketing manager who was earning $129,420 got a raise and is now earning $140,000.Which of the following statement is true?
A)The mean would increase.
B)The median would increase.
C)The range would increase.
D)Both A and C
Suppose the marketing manager who was earning $129,420 got a raise and is now earning $140,000.Which of the following statement is true?A)The mean would increase.
B)The median would increase.
C)The range would increase.
D)Both A and C

Unlock Deck
Sign up to unlock the cards in this deck!
Unlock Deck
Unlock Deck
1/17
Play
Full screen (f)
Deck 5: Displaying and Describing Quantitative Data
1
The following table shows closing share prices for a small sample of companies. The z score for the share price for Matsushita Electronic Components is
A)1.24.
B)2.34.
C)-2.34.
D)-3.00.
E)-1.24.
The z score for the share price for Matsushita Electronic Components isA)1.24.
B)2.34.
C)-2.34.
D)-3.00.
E)-1.24.
E
2
Consider the five number summary of hourly wages ($) for a sample of sales managers. The IQR for these data is
A)$11.70
B)$46.17
C)$67.11
D)$20.94
E)$44.77
The IQR for these data isA)$11.70
B)$46.17
C)$67.11
D)$20.94
E)$44.77
A
3
The following boxplots show monthly sales revenue figures ($ thousands) for a discount office supply company with locations in three different regions of the U.S.
(Northeast, Southeast, and West).Which of the following statements is false?
A)The west has the most variable sales revenues.
B)The west has the largest IQR.
C)The southeast has the smallest IQR.
D)The northeast has the most variable sales revenues.
E)The southeast has the least variable sales revenues.
D
4
The ASQ (American Society for Quality) regularly conducts a salary survey of its membership, primarily quality management professionals.Based on the most recently
Published mean and standard deviation, a quality control specialist calculated the z-score
Associated with his own salary and found it was -2.50.This tells him that his salary is
A)2 and a half times more than the average salary.
B)2 and a half times less than the average salary.
C)is 2.5 standard deviations above the average salary.
D)is 2.5 standard deviations below the average salary.
E)much higher than the average salary.
Unlock Deck
Unlock for access to all 17 flashcards in this deck.
Unlock Deck
k this deck
5
The following table shows closing share prices for a small sample of companies. The mean closing share price is
A)$31.23.
B)$44.65.
C)$56.99.
D)$62.19.
E)$75.77.
The mean closing share price isA)$31.23.
B)$44.65.
C)$56.99.
D)$62.19.
E)$75.77.
Unlock Deck
Unlock for access to all 17 flashcards in this deck.
Unlock Deck
k this deck
6
Here is the five number summary for salaries of U.S.marketing managers. The IQR is
A)$83,060.
B)$22.057.
C)$69,693.
D)$77.020.
E)$14,566.
The IQR isA)$83,060.
B)$22.057.
C)$69,693.
D)$77.020.
E)$14,566.
Unlock Deck
Unlock for access to all 17 flashcards in this deck.
Unlock Deck
k this deck
7
Below is a histogram of salaries (in $) for a sample of U.S.marketing managers. The shape of this distribution is
A)symmetric.
B)bimodal.
C)right skewed.
D)left skewed.
E)normal.
The shape of this distribution isA)symmetric.
B)bimodal.
C)right skewed.
D)left skewed.
E)normal.
Unlock Deck
Unlock for access to all 17 flashcards in this deck.
Unlock Deck
k this deck
8
Consider the five number summary of hourly wages ($) for a sample of advertising / promotion managers.
A)an increase in the median.
B)an increase in the standard deviation.
C)a decrease in the range.
D)a decrease in the IQR.
E)an increase in the mean.
A)an increase in the median.
B)an increase in the standard deviation.
C)a decrease in the range.
D)a decrease in the IQR.
E)an increase in the mean.
Unlock Deck
Unlock for access to all 17 flashcards in this deck.
Unlock Deck
k this deck
9
The following boxplots show monthly sales revenue figures ($ thousands) for a discount office supply company with locations in three different regions of the U.S.
(Northeast, Southeast, and West).Which of the following statements is true? 5-20 Chapter 5 Displaying and Describing Quantitative Data
A)The northeast has the lowest mean sales revenue.
B)The southeast has the lowest median sales revenue.
C)The west has the lowest mean sales revenue.
D)The west has the lowest median sales revenue.
E)None of the above.
(Northeast, Southeast, and West).Which of the following statements is true?
5-20 Chapter 5 Displaying and Describing Quantitative DataA)The northeast has the lowest mean sales revenue.
B)The southeast has the lowest median sales revenue.
C)The west has the lowest mean sales revenue.
D)The west has the lowest median sales revenue.
E)None of the above.
Unlock Deck
Unlock for access to all 17 flashcards in this deck.
Unlock Deck
k this deck
10
Consider the five number summary of hourly wages ($) for a sample of sales managers.
A)$11.70
B)$46.17
C)$67.11
D)$20.94
E)$44.77
A)$11.70
B)$46.17
C)$67.11
D)$20.94
E)$44.77
Unlock Deck
Unlock for access to all 17 flashcards in this deck.
Unlock Deck
k this deck
11
Below is a histogram of salaries (in $) for a sample of U.S.marketing managers. The most appropriate measure of central tendency for these data is the
A)median.
B)mean.
C)mode.
D)range.
E)standard deviation.
The most appropriate measure of central tendency for these data is theA)median.
B)mean.
C)mode.
D)range.
E)standard deviation.
Unlock Deck
Unlock for access to all 17 flashcards in this deck.
Unlock Deck
k this deck
12
The following table shows closing share prices for a small sample of companies. The standard deviation in closing share prices is
A)$31.43.
B)$44.65.
C)$56.99.
D)$62.19.
E)$75.77.
The standard deviation in closing share prices isA)$31.43.
B)$44.65.
C)$56.99.
D)$62.19.
E)$75.77.
Unlock Deck
Unlock for access to all 17 flashcards in this deck.
Unlock Deck
k this deck
13
The following table shows total assets ($ billion) for a small sample of U.S.banks. The z- score for the total assets of Fifth Third Bank is
A)1.25.
B)-1.25.
C)-2.5.
D)1.97.
E)-1.97.
The z- score for the total assets of Fifth Third Bank isA)1.25.
B)-1.25.
C)-2.5.
D)1.97.
E)-1.97.
Unlock Deck
Unlock for access to all 17 flashcards in this deck.
Unlock Deck
k this deck
14
The following table shows total assets ($ billion) for a small sample of U.S.banks. The standard deviation for these data is
A)$12.78 billion.
B)$ 11.27 billion.
C)$ 127.01 billion.
D)$ 21.67 billion.
E)$ 34 billion.
The standard deviation for these data isA)$12.78 billion.
B)$ 11.27 billion.
C)$ 127.01 billion.
D)$ 21.67 billion.
E)$ 34 billion.
Unlock Deck
Unlock for access to all 17 flashcards in this deck.
Unlock Deck
k this deck
15
Consider the five number summary of hourly wages ($) for a sample of sales managers.Suppose the mean hourly wage is $38.50.What can we say about the shape
Of the distribution?
A)The distribution of hourly wages for sales managers is symmetric.
B)The distribution of hourly wages for sales managers is skewed right.
C)The distribution of hourly wages for sales managers is skewed left.
D)The distribution of hourly wages for sales managers is bimodal.
E)None of the above.
Of the distribution?
A)The distribution of hourly wages for sales managers is symmetric.
B)The distribution of hourly wages for sales managers is skewed right.
C)The distribution of hourly wages for sales managers is skewed left.
D)The distribution of hourly wages for sales managers is bimodal.
E)None of the above.
Unlock Deck
Unlock for access to all 17 flashcards in this deck.
Unlock Deck
k this deck
16
The following table shows total assets ($ billion) for a small sample of U.S.banks. The mean for these data is
A)$ 80.25 billion.
B)$ 100.35 billion.
C)$ 75.68 billion.
D)$ 84 billion.
E)$ 89 billion.
The mean for these data isA)$ 80.25 billion.
B)$ 100.35 billion.
C)$ 75.68 billion.
D)$ 84 billion.
E)$ 89 billion.
Unlock Deck
Unlock for access to all 17 flashcards in this deck.
Unlock Deck
k this deck
17
Consider the five number summary for salaries of U.S.marketing managers. Suppose the marketing manager who was earning $129,420 got a raise and is now earning $140,000.Which of the following statement is true?
A)The mean would increase.
B)The median would increase.
C)The range would increase.
D)Both A and C
Suppose the marketing manager who was earning $129,420 got a raise and is now earning $140,000.Which of the following statement is true?A)The mean would increase.
B)The median would increase.
C)The range would increase.
D)Both A and C
Unlock Deck
Unlock for access to all 17 flashcards in this deck.
Unlock Deck
k this deck
Unlock Deck
Unlock for access to all 17 flashcards in this deck.


