Deck 23: Quantitative Genetics and Multifactorial
Full screen (f)
Question
Question
Question
Question
Question
Question
Question
Question
Question
Question
Question
In the following table, average differences of height, weight, and fingerprint ridge count between monozygotic twins (reared together and apart), dizygotic twins, and nontwin siblings are compared:
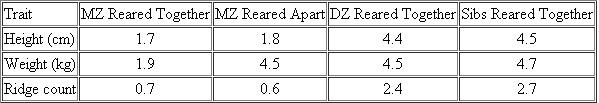 Based on the data in this table, which of these quantitative traits has the highest heritability values?
Based on the data in this table, which of these quantitative traits has the highest heritability values? Question
Question
Question
Corn plants from a test plot are measured, and the distribution of heights at 10-cm intervals is recorded in the following table:
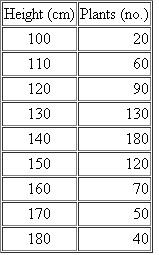 Calculate (a) the mean height, (b) the variance, (c) the standard deviation, and (d) the standard error of the mean. Plot a rough graph of plant height against frequency. Do the values represent a normal distribution? Based on your calculations, how would you assess the variation within this population?
Calculate (a) the mean height, (b) the variance, (c) the standard deviation, and (d) the standard error of the mean. Plot a rough graph of plant height against frequency. Do the values represent a normal distribution? Based on your calculations, how would you assess the variation within this population? Question
The following variances were calculated for two traits in a herd of hogs.
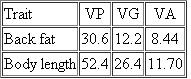 (a) Calculate broad-sense ( H 2 ) and narrow-sense ( h 2 ) heritabilities for each trait in this herd.
(b) Which of the two traits will respond best to selection by a breeder? Why?
(a) Calculate broad-sense ( H 2 ) and narrow-sense ( h 2 ) heritabilities for each trait in this herd.(b) Which of the two traits will respond best to selection by a breeder? Why?
Question
The mean and variance of plant height of two highly inbred strains (P 1 and P 2 ) and their progeny (F 1 and F 2 ) are shown here.
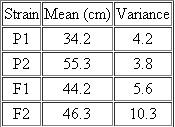 Calculate the broad-sense heritability (H 2 ) of plant height in this species.
Calculate the broad-sense heritability (H 2 ) of plant height in this species. Question
A hypothetical study investigated the vitamin A content and the cholesterol content of eggs from a large population of chickens. The variances ( V ) were calculated, as shown here:
 (a) Calculate the narrow-sense heritability ( h 2 ) for both traits.
(b) Which trait, if either, is likely to respond to selection?
(a) Calculate the narrow-sense heritability ( h 2 ) for both traits.(b) Which trait, if either, is likely to respond to selection?
Question
Question
Question
Question
Question
Question
Question
Question
Question
Question
Question
Question
Question
Question
Floral traits in plants often play key roles in diversification, in that slight modifications of those traits, if genetically determined, may quickly lead to reproductive restrictions and evolution. Insight into genetic involvement in flower formation is often acquired through selection experiments that expose realized heritability. Lendvai and Levin (2003) conducted a series of artificial selection experiments on flower size (diameter) in Phlox drummondii. Data from their selection experiments are presented in the following table in modified form and content.

 (a) Considering that differences in control values represent year-to-year differences in greenhouse conditions, calculate (in mm) the average response to selection over the three-year period.
(b) Calculate the realized heritability for each year and the overall realized heritability.
(c) Assuming that the realized heritability in phlox is relatively high, what factors might account for such a high response?
(d) In terms of evolutionary potential, is a population with high heritability likely to be favored compared to one with a low realized heritability?
(a) Considering that differences in control values represent year-to-year differences in greenhouse conditions, calculate (in mm) the average response to selection over the three-year period.(b) Calculate the realized heritability for each year and the overall realized heritability.
(c) Assuming that the realized heritability in phlox is relatively high, what factors might account for such a high response?
(d) In terms of evolutionary potential, is a population with high heritability likely to be favored compared to one with a low realized heritability?
Question
In 1988, Horst Wilkens investigated blind cavefish, comparing them with members of a sibling species with normal vision that are found in a lake [Wilkens, H. (1988). Ecol. Biol. 23: 271-367]. We will call them cavefish and lakefish. Wilkens found that cavefish eyes are about seven times smaller than lakefish eyes. F 1 hybrids have eyes of intermediate size. These data, as well as the F 1 × F 1 cross and those from backcrosses (F 1 × cavefish and F 1 × lakefish), are depicted below. Examine Wilkens's results and respond to the following questions:
(a) Based strictly on the F 1 and F 2 results of Wilkens's initial crosses, what possible explanation concerning the inheritance of eye size seems most feasible?
(b) Based on the results of the F 1 backcross with cavefish, is your explanation supported? Explain.
(c) Based on the results of the F 1 backcross with lakefish, is your explanation supported? Explain.
(d) Wilkens examined about 1000 F 2 progeny and estimated that 6-7 genes are involved in determining eye size. Is the sample size adequate to justify this conclusion? Propose an experimental protocol to test the hypothesis.
(e) A comparison of the embryonic eye in cavefish and lake-fish revealed that both reach approximately 4 mm in diameter. However, lakefish eyes continue to grow, while cavefish eye size is greatly reduced. Speculate on the role of the genes involved in this problem.
![In 1988, Horst Wilkens investigated blind cavefish, comparing them with members of a sibling species with normal vision that are found in a lake [Wilkens, H. (1988). Ecol. Biol. 23: 271-367]. We will call them cavefish and lakefish. Wilkens found that cavefish eyes are about seven times smaller than lakefish eyes. F 1 hybrids have eyes of intermediate size. These data, as well as the F 1 × F 1 cross and those from backcrosses (F 1 × cavefish and F 1 × lakefish), are depicted below. Examine Wilkens's results and respond to the following questions: (a) Based strictly on the F 1 and F 2 results of Wilkens's initial crosses, what possible explanation concerning the inheritance of eye size seems most feasible? (b) Based on the results of the F 1 backcross with cavefish, is your explanation supported? Explain. (c) Based on the results of the F 1 backcross with lakefish, is your explanation supported? Explain. (d) Wilkens examined about 1000 F 2 progeny and estimated that 6-7 genes are involved in determining eye size. Is the sample size adequate to justify this conclusion? Propose an experimental protocol to test the hypothesis. (e) A comparison of the embryonic eye in cavefish and lake-fish revealed that both reach approximately 4 mm in diameter. However, lakefish eyes continue to grow, while cavefish eye size is greatly reduced. Speculate on the role of the genes involved in this problem. <div style=padding-top: 35px>](https://d2lvgg3v3hfg70.cloudfront.net/SM1220/11eb563d_4e6a_3886_a8c8_df5838032a90_SM1220_00.jpg)
(a) Based strictly on the F 1 and F 2 results of Wilkens's initial crosses, what possible explanation concerning the inheritance of eye size seems most feasible?
(b) Based on the results of the F 1 backcross with cavefish, is your explanation supported? Explain.
(c) Based on the results of the F 1 backcross with lakefish, is your explanation supported? Explain.
(d) Wilkens examined about 1000 F 2 progeny and estimated that 6-7 genes are involved in determining eye size. Is the sample size adequate to justify this conclusion? Propose an experimental protocol to test the hypothesis.
(e) A comparison of the embryonic eye in cavefish and lake-fish revealed that both reach approximately 4 mm in diameter. However, lakefish eyes continue to grow, while cavefish eye size is greatly reduced. Speculate on the role of the genes involved in this problem.

Unlock Deck
Sign up to unlock the cards in this deck!
Unlock Deck
Unlock Deck
1/32
Play
Full screen (f)
Deck 23: Quantitative Genetics and Multifactorial
1
On July 11, 2008, twin sons were born to Stephan Gerth from Germany and Addo Gerth from Ghana. Stephan is very fair-skinned with blue eyes and straight hair; Addo is dark-skinned, with brown eyes and curly hair. The first born of the twins, Ryan, is fair-skinned, with blue eyes and straight hair; his brother, Leo, has light brown skin, brown eyes, and curly hair. Although the twins' hair texture and eye color were the same as those of one or the other parent, the twins had different skin colors, intermediate to that of their parents. Experts explained that the blending effect of skin color in the twins resulted from quantitative inheritance involving at least three different gene pairs, whereas hair texture and eye color are not quantitatively inherited. Using this as an example of quantitative genetics, we can ask the following questions:
What approach is used in estimating how many gene pairs are involved in a quantitative trait? Why would this be extremely difficult in the case of skin color in humans?
What approach is used in estimating how many gene pairs are involved in a quantitative trait? Why would this be extremely difficult in the case of skin color in humans?
(a) To estimate how many gene pairs are involved in quantitative traits use the equation (2n+1) = the number of distinct phenotypic categories observed. N is the number of polygenes involved.
(b) This would be extremely difficult in the case of skin color in humans because it would be hard to determine the number of distinct phenotypic categories. In other words, skin color come in many different shades and it would be hard to determine how many.
(b) This would be extremely difficult in the case of skin color in humans because it would be hard to determine the number of distinct phenotypic categories. In other words, skin color come in many different shades and it would be hard to determine how many.
2
In this chapter, we focused on a mode of inheritance referred to as quantitative genetics, as well as many of the statistical parameters utilized to study quantitative traits. Along the way, we found opportunities to consider the methods and reasoning by which geneticists acquired much of their understanding of quantitative genetics. From the explanations given in the chapter, what answers would you propose to the following fundamental questions:
(a) How do we know that threshold traits are actually polygenic even though they may have as few as two discrete phenotypic classes?
(b) How can we ascertain the number of polygenes involved in the inheritance of a quantitative trait?
(c) What findings led geneticists to postulate the multiple-factor hypothesis that invoked the idea of additive alleles to explain inheritance patterns?
(d) How do we assess environmental factors to determine if they impact the phenotype of a quantitatively inherited trait?
(e) How do we know that monozygotic twins are not identical genotypically as adults?
(a) Threshold traits are polygenetic traits. They have a small number of discrete phenotypic classes and they are the traits right before the onset of a disease. For example, in type II diabetes there is a threshold zone right before a person is considered having clinical diabetes.
(b) The more of additive allele the more intense the expression of the phenotype. The number of polygenes involved in a quantitative trait can be found by using the equation 1/4 n = ratio of F 2 individuals expressing either extreme phenotype.
(c) Nilsson-Ehle used grain color in wheat to test the concept that the cumulative effects of alleles at multiple loci produce the range of phenotypes seen in quantitative traits. Each gene has one potential additive allele that contributes approximately equal to the red grain and one potential non-additive allele that fails to produce an red pigment. From this we can see how the multiple-factor hypothesis could account for the various grain colors.
(d) Using statistical analysis we can rule out environmental factors playing a role in quantitatively inherited traits.
(e) We know that monozygotic twins are not identical genotypically as adults. We know this because gene-expression patterns in twins change with age, leading to phenotypic differences. Even by the time monozygotic twins are born they do not necessarily have identical genomes.
3
On July 11, 2008, twin sons were born to Stephan Gerth from Germany and Addo Gerth from Ghana. Stephan is very fair-skinned with blue eyes and straight hair; Addo is dark-skinned, with brown eyes and curly hair. The first born of the twins, Ryan, is fair-skinned, with blue eyes and straight hair; his brother, Leo, has light brown skin, brown eyes, and curly hair. Although the twins' hair texture and eye color were the same as those of one or the other parent, the twins had different skin colors, intermediate to that of their parents. Experts explained that the blending effect of skin color in the twins resulted from quantitative inheritance involving at least three different gene pairs, whereas hair texture and eye color are not quantitatively inherited. Using this as an example of quantitative genetics, we can ask the following questions:
Would either parent need to have mixed-race ancestry for the twins to be so different?
Would either parent need to have mixed-race ancestry for the twins to be so different?
Neither parent would need to have mixed-race ancestry for the twins to be so different. Skin color is a quantitative trait that depends on the additive effect of a number of genes and this caused a blending effect of skin color in the twins.
4
Review the Chapter Concepts list. These all center around quantitative inheritance and the study and analysis of polygenic traits. Write a short essay that discusses the difference between the more traditional Mendelian and neo-Mendelian modes of inheritance (qualitative inheritance) and quantitative inheritance.
▪Quantitative inheritance results in a range of measurable phenotypes for a polygenic trait.
▪With some exceptions, polygenic traits tend to demonstrate continuous variation.
▪Quantitative traits can be explained in Mendelian terms whereby certain alleles have an additive effect on the traits under study.
▪The study of polygenic traits relies on statistical analysis.
▪Heritability values estimate the genetic contribution to phenotypic variability under specific environmental conditions.
▪Twin studies allow an estimation of heritability in humans.
▪Quantitative trait loci (QTLs) can be mapped and identified
Unlock Deck
Unlock for access to all 32 flashcards in this deck.
Unlock Deck
k this deck
5
On July 11, 2008, twin sons were born to Stephan Gerth from Germany and Addo Gerth from Ghana. Stephan is very fair-skinned with blue eyes and straight hair; Addo is dark-skinned, with brown eyes and curly hair. The first born of the twins, Ryan, is fair-skinned, with blue eyes and straight hair; his brother, Leo, has light brown skin, brown eyes, and curly hair. Although the twins' hair texture and eye color were the same as those of one or the other parent, the twins had different skin colors, intermediate to that of their parents. Experts explained that the blending effect of skin color in the twins resulted from quantitative inheritance involving at least three different gene pairs, whereas hair texture and eye color are not quantitatively inherited. Using this as an example of quantitative genetics, we can ask the following questions:
Would twins showing some parental traits (hair texture, eye color) but a blending of other traits (skin color in this case) seem to be a commonplace event, or are we looking at a "one in a million" event?
Would twins showing some parental traits (hair texture, eye color) but a blending of other traits (skin color in this case) seem to be a commonplace event, or are we looking at a "one in a million" event?
Unlock Deck
Unlock for access to all 32 flashcards in this deck.
Unlock Deck
k this deck
6
Define the following: (a) polygenic, (b) additive alleles, (c) correlation, (d) monozygotic and dizygotic twins, (e) heritability, (f) QTL, and (g) continuous variation.
Unlock Deck
Unlock for access to all 32 flashcards in this deck.
Unlock Deck
k this deck
7
A dark-red strain and a white strain of wheat are crossed and produce an intermediate, medium-red F 1. When the F 1 plants are interbred, an F 2 generation is produced in a ratio of 1 dark-red: 4 medium-dark-red: 6 medium-red: 4 light-red: 1 white. Further crosses reveal that the dark-red and white F 2 plants are true breeding.
(a) Based on the ratios in the F 2 population, how many genes are involved in the production of color?
(b) How many additive alleles are needed to produce each possible phenotype?
(c) Assign symbols to these alleles and list possible genotypes that give rise to the medium-red and light-red phenotypes.
(d) Predict the outcome of the F 1 and F 2 generations in a cross between a true-breeding medium-red plant and a white plant.
Unlock Deck
Unlock for access to all 32 flashcards in this deck.
Unlock Deck
k this deck
8
Height in humans depends on the additive action of genes. Assume that this trait is controlled by the four loci R, S, T, and U and that environmental effects are negligible. Instead of additive versus nonadditive alleles, assume that additive and partially additive alleles exist. Additive alleles contribute two units, and partially additive alleles contribute one unit to height.
(a) Can two individuals of moderate height produce offspring that are much taller or shorter than either parent? If so, how?
(b) If an individual with the minimum height specified by these genes marries an individual of intermediate or moderate height, will any of their children be taller than the tall parent? Why or why not?
Unlock Deck
Unlock for access to all 32 flashcards in this deck.
Unlock Deck
k this deck
9
An inbred strain of plants has a mean height of 24 cm. A second strain of the same species from a different geographical region also has a mean height of 24 cm. When plants from the two strains are crossed together, the F 1 plants are the same height as the parent plants. However, the F 2 generation shows a wide range of heights; the majority are like the P 1 and F 1 plants, but approximately 4 of 1000 are only 12 cm high and about 4 of 1000 are 36 cm high.
(a) What mode of inheritance is occurring here?
(b) How many gene pairs are involved?
(c) How much does each gene contribute to plant height?
(d) Indicate one possible set of genotypes for the original P 1 parents and the F 1 plants that could account for these results.
(e) Indicate three possible genotypes that could account for F 2 plants that are 18 cm high and three that account for F 2 plants that are 33 cm high.
Unlock Deck
Unlock for access to all 32 flashcards in this deck.
Unlock Deck
k this deck
10
Erma and Harvey were a compatible barnyard pair, but a curious sight. Harvey's tail was only 6 cm long, while Erma's was 30 cm. Their F 1 piglet offspring all grew tails that were 18 cm. When inbred, an F 2 generation resulted in many piglets (Erma and Harvey's grandpigs), whose tails ranged in 4-cm intervals from 6 to 30 cm (6, 10, 14, 18, 22, 26, and 30). Most had 18-cm tails, while 1/64 had 6-cm tails and 1/64 had 30-cm tails.
(a) Explain how these tail lengths were inherited by describing the mode of inheritance, indicating how many gene pairs were at work, and designating the genotypes of Harvey, Erma, and their 18-cm-tail offspring.
(b) If one of the 18-cm F 1 pigs is mated with one of the 6-cm F 2 pigs, what phenotypic ratio will be predicted if many offspring resulted? Diagram the cross.
Unlock Deck
Unlock for access to all 32 flashcards in this deck.
Unlock Deck
k this deck
11
In the following table, average differences of height, weight, and fingerprint ridge count between monozygotic twins (reared together and apart), dizygotic twins, and nontwin siblings are compared:
Based on the data in this table, which of these quantitative traits has the highest heritability values?
Based on the data in this table, which of these quantitative traits has the highest heritability values? Unlock Deck
Unlock for access to all 32 flashcards in this deck.
Unlock Deck
k this deck
12
What kind of heritability estimates (broad sense or narrow sense) are obtained from human twin studies?
Unlock Deck
Unlock for access to all 32 flashcards in this deck.
Unlock Deck
k this deck
13
List as many human traits as you can that are likely to be under the control of a polygenic mode of inheritance.
Unlock Deck
Unlock for access to all 32 flashcards in this deck.
Unlock Deck
k this deck
14
Corn plants from a test plot are measured, and the distribution of heights at 10-cm intervals is recorded in the following table:
Calculate (a) the mean height, (b) the variance, (c) the standard deviation, and (d) the standard error of the mean. Plot a rough graph of plant height against frequency. Do the values represent a normal distribution? Based on your calculations, how would you assess the variation within this population?
Calculate (a) the mean height, (b) the variance, (c) the standard deviation, and (d) the standard error of the mean. Plot a rough graph of plant height against frequency. Do the values represent a normal distribution? Based on your calculations, how would you assess the variation within this population? Unlock Deck
Unlock for access to all 32 flashcards in this deck.
Unlock Deck
k this deck
15
The following variances were calculated for two traits in a herd of hogs.
(a) Calculate broad-sense ( H 2 ) and narrow-sense ( h 2 ) heritabilities for each trait in this herd.
(b) Which of the two traits will respond best to selection by a breeder? Why?
(a) Calculate broad-sense ( H 2 ) and narrow-sense ( h 2 ) heritabilities for each trait in this herd.(b) Which of the two traits will respond best to selection by a breeder? Why?
Unlock Deck
Unlock for access to all 32 flashcards in this deck.
Unlock Deck
k this deck
16
The mean and variance of plant height of two highly inbred strains (P 1 and P 2 ) and their progeny (F 1 and F 2 ) are shown here.
Calculate the broad-sense heritability (H 2 ) of plant height in this species.
Calculate the broad-sense heritability (H 2 ) of plant height in this species. Unlock Deck
Unlock for access to all 32 flashcards in this deck.
Unlock Deck
k this deck
17
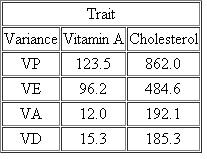
A hypothetical study investigated the vitamin A content and the cholesterol content of eggs from a large population of chickens. The variances ( V ) were calculated, as shown here:
(a) Calculate the narrow-sense heritability ( h 2 ) for both traits.
(b) Which trait, if either, is likely to respond to selection?
(a) Calculate the narrow-sense heritability ( h 2 ) for both traits.(b) Which trait, if either, is likely to respond to selection?
Unlock Deck
Unlock for access to all 32 flashcards in this deck.
Unlock Deck
k this deck
18
In a herd of dairy cows the narrow-sense heritability for milk protein content is 0.76, and for milk butterfat it is 0.82. The correlation coefficient between milk protein content and butterfat is 0.91. If the farmer selects for cows producing more butterfat in their milk, what will be the most likely effect on milk protein content in the next generation?
Unlock Deck
Unlock for access to all 32 flashcards in this deck.
Unlock Deck
k this deck
19
In an assessment of learning in Drosophila , flies were trained to avoid certain olfactory cues. In one population, a mean of 8.5 trials was required. A subgroup of this parental population that was trained most quickly (mean = 6.0) was interbred, and their progeny were examined. These flies demonstrated a mean training value of 7.5. Calculate realized heritability for olfactory learning in Drosophila.
Unlock Deck
Unlock for access to all 32 flashcards in this deck.
Unlock Deck
k this deck
20
Suppose you want to develop a population of Drosophila that would rapidly learn to avoid certain substances the flies could detect by smell. Based on the heritability estimate you obtained in Problem 16, do you think it would be worth doing this by artificial selection? Why or why not?
Unlock Deck
Unlock for access to all 32 flashcards in this deck.
Unlock Deck
k this deck
21
In a population of tomato plants, mean fruit weight is 60 g and h 2 is 0.3. Predict the mean weight of the progeny if tomato plants whose fruit averaged 80 g were selected from the original population and interbred.
Unlock Deck
Unlock for access to all 32 flashcards in this deck.
Unlock Deck
k this deck
22
In a population of 100 inbred, genotypically identical rice plants, variance for grain yield is 4.67. What is the heritability for yield? Would you advise a rice breeder to improve yield in this strain of rice plants by selection?
Unlock Deck
Unlock for access to all 32 flashcards in this deck.
Unlock Deck
k this deck
23
Many traits of economic or medical significance are determined by quantitative trait loci (QTLs) in which many genes, usually scattered throughout the genome, contribute to expression.
(a) What general procedures are used to identify such loci?
(b) What is meant by the term cosegregate in the context of QTL mapping? Why are markers such as RFLPs, SNPs, and microsatellites often used in QTL mapping?
(a) What general procedures are used to identify such loci?
(b) What is meant by the term cosegregate in the context of QTL mapping? Why are markers such as RFLPs, SNPs, and microsatellites often used in QTL mapping?
Unlock Deck
Unlock for access to all 32 flashcards in this deck.
Unlock Deck
k this deck
24
A 3-inch plant was crossed with a 15-inch plant, and all F 1 plants were 9 inches. The F 2 plants exhibited a "normal distribution," with heights of 3, 4, 5, 6, 7, 8, 9, 10, 11, 12, 13, 14, and 15 inches.
(a) What ratio will constitute the "normal distribution" in the F 2 ?
(b) What will be the outcome if the F1 plants are testcrossed with plants that are homozygous for all nonadditive alleles?
(a) What ratio will constitute the "normal distribution" in the F 2 ?
(b) What will be the outcome if the F1 plants are testcrossed with plants that are homozygous for all nonadditive alleles?
Unlock Deck
Unlock for access to all 32 flashcards in this deck.
Unlock Deck
k this deck
25
In a cross between a strain of large guinea pigs and a strain of small guinea pigs, the F 1 are phenotypically uniform, with an average size about intermediate between that of the two parental strains. Among 1014 F 2 individuals, 3 are about the same size as the small parental strain and 5 are about the same size as the large parental strain. How many gene pairs are involved in the inheritance of size in these strains of guinea pigs?
Unlock Deck
Unlock for access to all 32 flashcards in this deck.
Unlock Deck
k this deck
26
Type A1B brachydactyly (short middle phalanges) is a genetically determined trait that maps to the short arm of chromosome 5 in humans. If you classify individuals as either having or not having brachydactyly, the trait appears to follow a single-locus, incompletely dominant pattern of inheritance. However, if one examines the fingers and toes of affected individuals, one sees a range of expression from extremely short to only slightly short. What might cause such variation in the expression of brachydactyly?
Unlock Deck
Unlock for access to all 32 flashcards in this deck.
Unlock Deck
k this deck
27
In a series of crosses between two true-breeding strains of peaches, the F 1 generation was uniform, producing 30-g peaches. The F 2 fruit mass ranges from 38 to 22 g at intervals of 2 g.
(a) Using these data, determine the number of polygenic loci involved in the inheritance of peach mass.
(b) Using gene symbols of your choice, give the genotypes of the parents and the F 1
.
(a) Using these data, determine the number of polygenic loci involved in the inheritance of peach mass.
(b) Using gene symbols of your choice, give the genotypes of the parents and the F 1
.
Unlock Deck
Unlock for access to all 32 flashcards in this deck.
Unlock Deck
k this deck
28
Students in a genetics laboratory began an experiment in an attempt to increase heat tolerance in two strains of Drosophila melanogaster. One strain was trapped from the wild six weeks before the experiment was to begin; the other was obtained from a Drosophila repository at a university laboratory. In which strain would you expect to see the most rapid and extensive response to heat-tolerance selection, and why?
Unlock Deck
Unlock for access to all 32 flashcards in this deck.
Unlock Deck
k this deck
29
Consider a true-breeding plant, AABBCC , crossed with another true-breeding plant, aabbcc , whose resulting offspring are AaBbCc. If you cross the F 1 generation, and independent assortment is operational, the expected fraction of offspring in each phenotypic class is given by the expression N!/M!(N - M)! where N is the total number of alleles (six in this example) and M is the number of uppercase alleles. In a cross of AaBbCc × AaBbCc , what proportion of the offspring would be expected to contain two uppercase alleles?
Unlock Deck
Unlock for access to all 32 flashcards in this deck.
Unlock Deck
k this deck
30
Canine hip dysplasia is a quantitative trait that continues to affect most large breeds of dogs in spite of approximately 40 years of effort to reduce the impact of this condition. Breeders and veterinarians rely on radiographic and universal registries to facilitate the development of breeding schemes for reducing its incidence. Data (Wood and Lakhani. 2003. Vet. Rec. 152: 69-72) indicate that there is a "month-of-birth" effect on hip dysplasia in Labrador retrievers and Gordon setters, whereby the frequency and extent of expression of this disorder vary depending on the time of year dogs are born. Speculate on how breeders attempt to "select" out this disorder and what the month-of-birth phenomenon indicates about the expression of polygenic traits.
Unlock Deck
Unlock for access to all 32 flashcards in this deck.
Unlock Deck
k this deck
31
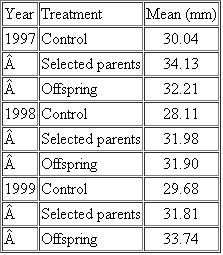
Floral traits in plants often play key roles in diversification, in that slight modifications of those traits, if genetically determined, may quickly lead to reproductive restrictions and evolution. Insight into genetic involvement in flower formation is often acquired through selection experiments that expose realized heritability. Lendvai and Levin (2003) conducted a series of artificial selection experiments on flower size (diameter) in Phlox drummondii. Data from their selection experiments are presented in the following table in modified form and content.
(a) Considering that differences in control values represent year-to-year differences in greenhouse conditions, calculate (in mm) the average response to selection over the three-year period.
(b) Calculate the realized heritability for each year and the overall realized heritability.
(c) Assuming that the realized heritability in phlox is relatively high, what factors might account for such a high response?
(d) In terms of evolutionary potential, is a population with high heritability likely to be favored compared to one with a low realized heritability?
(a) Considering that differences in control values represent year-to-year differences in greenhouse conditions, calculate (in mm) the average response to selection over the three-year period.(b) Calculate the realized heritability for each year and the overall realized heritability.
(c) Assuming that the realized heritability in phlox is relatively high, what factors might account for such a high response?
(d) In terms of evolutionary potential, is a population with high heritability likely to be favored compared to one with a low realized heritability?
Unlock Deck
Unlock for access to all 32 flashcards in this deck.
Unlock Deck
k this deck
32
In 1988, Horst Wilkens investigated blind cavefish, comparing them with members of a sibling species with normal vision that are found in a lake [Wilkens, H. (1988). Ecol. Biol. 23: 271-367]. We will call them cavefish and lakefish. Wilkens found that cavefish eyes are about seven times smaller than lakefish eyes. F 1 hybrids have eyes of intermediate size. These data, as well as the F 1 × F 1 cross and those from backcrosses (F 1 × cavefish and F 1 × lakefish), are depicted below. Examine Wilkens's results and respond to the following questions:
(a) Based strictly on the F 1 and F 2 results of Wilkens's initial crosses, what possible explanation concerning the inheritance of eye size seems most feasible?
(b) Based on the results of the F 1 backcross with cavefish, is your explanation supported? Explain.
(c) Based on the results of the F 1 backcross with lakefish, is your explanation supported? Explain.
(d) Wilkens examined about 1000 F 2 progeny and estimated that 6-7 genes are involved in determining eye size. Is the sample size adequate to justify this conclusion? Propose an experimental protocol to test the hypothesis.
(e) A comparison of the embryonic eye in cavefish and lake-fish revealed that both reach approximately 4 mm in diameter. However, lakefish eyes continue to grow, while cavefish eye size is greatly reduced. Speculate on the role of the genes involved in this problem.
Unlock Deck
Unlock for access to all 32 flashcards in this deck.
Unlock Deck
k this deck
Unlock Deck
Unlock for access to all 32 flashcards in this deck.


