Deck 14: Money, Banking, and Financial Institutions
Full screen (f)
Question
Question
Question
Question
Question
Question
Question
Question
Question
Question

Unlock Deck
Sign up to unlock the cards in this deck!
Unlock Deck
Unlock Deck
1/10
Play
Full screen (f)
Deck 14: Money, Banking, and Financial Institutions
1
What is the general relationship between a country's price level and the quantity of its domestic output (real GDP) demanded Who are the buyers of U.S. real GDP
In general, there is an inverse relationship between a country's price level and the quantity of its domestic output (real GDP).
In other words, as general price level in an economy rise, purchasing power declines leads to fall in aggregate demand leading to decline in real GDP and vice-versa.
US households, US businesses, and US government along with households, businesses, and governments of foreign countries are the buyers of U.S. real GDP.
2
What assumptions cause the immediate-short-run aggregate supply curve to be horizontal Why is the long-run aggregate supply curve vertical Explain the shape of the short-run aggregate supply curve. Why is the short-run curve relatively flat to the left of the full-employment output and relatively steep to the right
In the immediate short run, the aggregate supply curve is horizontal because price and wage are sticky.
In the short run, the aggregate supply curve is upward-sloping because only output price is flexible while input prices are fixed.
The short-run aggregate supply curve is relatively flat to the left of the full-employment output because the price reflects the per-unit cost which increases slower below the full-employment output. Below full-employment the per-unit cost increases slower because the productivity is increased by making full advantage of the idle machines; the short-run aggregate supply curve is relatively steep to the right because productivity is reduced with too many workers and constrained capital.
3
Suppose that the aggregate demand and supply schedules for a hypothetical economy are as shown below:
Aggregate demand is the total quantity demanded of all goods and services produced in an economy at different price level.
Aggregate supply is the total quantity supply of all goods and services at different level in an economy.
The equilibrium price level and real GDP output level gets determined with the intersection of AD and AS curves.
a.
The following graph shows the aggregate demand curve as AD and aggregate supply curve as AS.
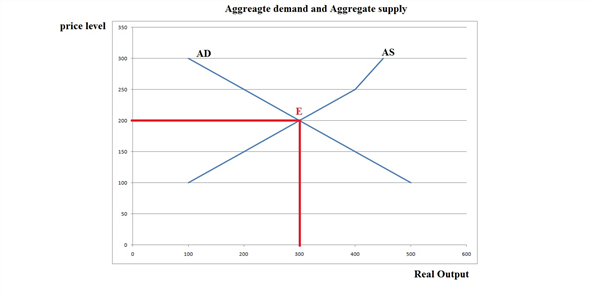 In the above graph E is the equilibrium point corresponding to which are equilibrium price and equilibrium output.
Thus the equilibrium price level is
 and equilibrium real output is
 billions.
No, the equilibrium level is not the full level employment as beyond full level of output the aggregate curve in short run gets steeper. As you can see in the graph the AS curve does not get steeper after price level of
 but it is getting steeper after
 . Hence it is not full employment level output.
b.
At price level of
 the aggregate supply is
 billion and aggregate demand is
 billion which are not equal. At equilibrium level the aggregate demand equals aggregate supply. Hence at
 equilibrium is not achieved.
Similarly at
 the aggregate supply is
 billion and aggregate demand is
 billion which are not equal. At equilibrium level the aggregate demand equals aggregate supply. Hence at
 also equilibrium is not achieved.
c.
When aggregate demand exceeds the current level by
 at each price level then the new AD curve will be upward to the previous one.
Represent the graph as follows:
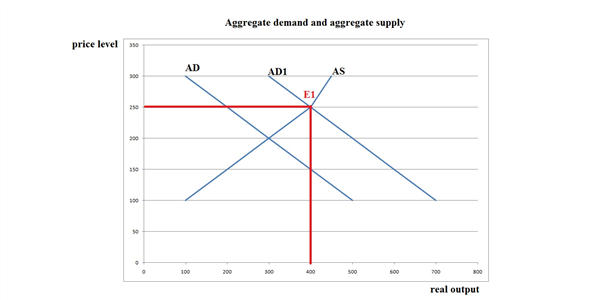 E1 is the new equilibrium level. Thus the new equilibrium price is
 and equilibrium output is
 billion.
Such increase in aggregate demand may have caused by increase in consumer wealth, reduction in personal taxes, improvement in technology, rise consumer expectations, reduction in business taxes, increase in government spending etc.
Aggregate supply is the total quantity supply of all goods and services at different level in an economy.
The equilibrium price level and real GDP output level gets determined with the intersection of AD and AS curves.
a.
The following graph shows the aggregate demand curve as AD and aggregate supply curve as AS.
In the above graph E is the equilibrium point corresponding to which are equilibrium price and equilibrium output.Thus the equilibrium price level is
and equilibrium real output is billions.No, the equilibrium level is not the full level employment as beyond full level of output the aggregate curve in short run gets steeper. As you can see in the graph the AS curve does not get steeper after price level of
but it is getting steeper after . Hence it is not full employment level output.b.
At price level of
the aggregate supply is billion and aggregate demand is billion which are not equal. At equilibrium level the aggregate demand equals aggregate supply. Hence at equilibrium is not achieved.Similarly at
the aggregate supply is billion and aggregate demand is billion which are not equal. At equilibrium level the aggregate demand equals aggregate supply. Hence at also equilibrium is not achieved.c.
When aggregate demand exceeds the current level by
at each price level then the new AD curve will be upward to the previous one.Represent the graph as follows:
E1 is the new equilibrium level. Thus the new equilibrium price is and equilibrium output is billion.Such increase in aggregate demand may have caused by increase in consumer wealth, reduction in personal taxes, improvement in technology, rise consumer expectations, reduction in business taxes, increase in government spending etc.
4
Suppose that a hypothetical economy has the following relationship between its real output and the input quantities necessary for producing that output:
Unlock Deck
Unlock for access to all 10 flashcards in this deck.
Unlock Deck
k this deck
5
Other things equal, what effects would each of the following have on aggregate demand or aggregate supply In each case use a diagram to show the expected effects on the equilibrium price level and the level of real output.LO2
a. A reduction in the economy's real interest rate.
b. A major increase in Federal spending for health care (with no increase in taxes).
c. The complete disintegration of OPEC, causing oil prices to fall by one-half.
d. A 10 percent reduction in personal income tax rates (with no change in government spending).
e. A sizable increase in labor productivity (with no change in nominal wages).
f. A 12 percent increase in nominal wages (with no change in productivity).
g. A sizable depreciation in the international value of the dollar.
Unlock Deck
Unlock for access to all 10 flashcards in this deck.
Unlock Deck
k this deck
6
Other things equal, what effect will each of the following have on the equilibrium price level and level of real output
a. An increase in aggregate demand in the steep portion of the aggregate supply curve.
b. An increase in aggregate supply, with no change in aggregate demand (assume that prices and wages are flexible upward and downward).
c. Equal increases in aggregate demand and aggregate supply.
d. A reduction in aggregate demand in the relatively flat portion of the aggregate supply curve.
e. An increase in aggregate demand and a decrease in aggregate supply.
Unlock Deck
Unlock for access to all 10 flashcards in this deck.
Unlock Deck
k this deck
7
Why does a reduction in aggregate demand tend to reduce real output, rather than the price level
Unlock Deck
Unlock for access to all 10 flashcards in this deck.
Unlock Deck
k this deck
8
Explain: "Unemployment can be caused by a decrease of aggregate demand or a decrease of aggregate supply." In each case, specify the price-level outcomes.
Unlock Deck
Unlock for access to all 10 flashcards in this deck.
Unlock Deck
k this deck
9
In early 2001 investment spending sharply declined in the United States. In the 2 months following the September 11, 2001, attacks on the United States, consumption also declined. Use AD-AS analysis to show the two impacts on real GDP.
Unlock Deck
Unlock for access to all 10 flashcards in this deck.
Unlock Deck
k this deck
10
Using the concept of the multiplier, explain why mass layoffs by large companies such as Boeing or General Motors are a concern to the citizens and leaders where those firms are located.
Unlock Deck
Unlock for access to all 10 flashcards in this deck.
Unlock Deck
k this deck
Unlock Deck
Unlock for access to all 10 flashcards in this deck.


