Deck 20: The Costs of Production
Full screen (f)
Question
Question
Question
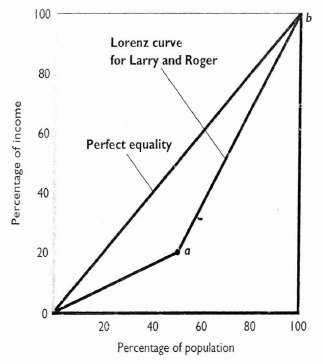
Imagine an economy with only two people, Larry earns $20,000 per year, while Roger earns $80,000 per year. As shown in the following figure, the Lorenz curve for this two-person economy consists of two line segments. The first runs from the origin to point a, while the second runs from point a to point b
a. Calculate the Gini ratio for this two-person economy using the geometric formulas for the area of a triangle (= ½ × base × height) and the area of a rectangle (= base × height). (Hint: The area under the line segment from point a to point b can be thought of as the sum of the area of a particular triangle and the area of a particular rectangle.)
b. What would the Gini ratio be if the government taxed $20,000 away from Roger and gave it to Larry? (Hint: The figure will change.)
c. Start again with Larry earning $20,000 per year and Roger earning $80,000 per year. What would the Gini ratio be if both their incomes doubled? How much has the Gini ratio changed from before the doubling in incomes to after the doubling in incomes?
Question
Question
Question
Question
Question
Question
Question
Question
Question
Question
Question
Question
Question
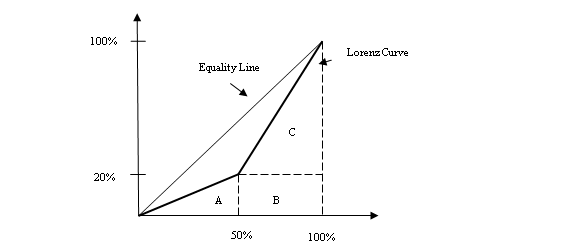
The labor demand and supply data in the following table relate to a single occupation. Use them to answer the
 questions that follow. Base your answers on the taste-for- discrimination modela. Plot the labor demand and supply curves for Hispanic workers in this occupation.
b. What are the equilibrium Hispanic wage rate and quantity of Hispanic employment?
c. Suppose the white wage rate in this occupation is $16. What is the Hispanic-to-white wage ratio?
d. Suppose a particular employer has a discrimination coefficient d of $5 per hour. Will that employer hire Hispapnic or white workers at the Hispanic-white wage ratio indicated in part c ? Explain.
e. Suppose employers as a group become less prejudiced against Hispanics and demand 14 more units of Hispanic labor at each Hispanic wage rate in the table. What are the new equilibrium Hispanic wage rate and level of Hispanic employment? Does the Hispanic-white wage ratio rise or fall? Explain.
f. Suppose Hispanics as a group increase their labor services in that occupation, collectively offering 14 mole units of labor at each Hispanic wage rate. Disregarding the changes indicated in part e, what are the new equilibrium Hispanic wage rate and level of Hispanic employment? Does the Hispanic-white wage ratio rise, or does it fall?
questions that follow. Base your answers on the taste-for- discrimination modela. Plot the labor demand and supply curves for Hispanic workers in this occupation.b. What are the equilibrium Hispanic wage rate and quantity of Hispanic employment?
c. Suppose the white wage rate in this occupation is $16. What is the Hispanic-to-white wage ratio?
d. Suppose a particular employer has a discrimination coefficient d of $5 per hour. Will that employer hire Hispapnic or white workers at the Hispanic-white wage ratio indicated in part c ? Explain.
e. Suppose employers as a group become less prejudiced against Hispanics and demand 14 more units of Hispanic labor at each Hispanic wage rate in the table. What are the new equilibrium Hispanic wage rate and level of Hispanic employment? Does the Hispanic-white wage ratio rise or fall? Explain.
f. Suppose Hispanics as a group increase their labor services in that occupation, collectively offering 14 mole units of labor at each Hispanic wage rate. Disregarding the changes indicated in part e, what are the new equilibrium Hispanic wage rate and level of Hispanic employment? Does the Hispanic-white wage ratio rise, or does it fall?
Question
Question
Question

Unlock Deck
Sign up to unlock the cards in this deck!
Unlock Deck
Unlock Deck
1/19
Play
Full screen (f)
Deck 20: The Costs of Production
1
In 2010 Forbes magazine listed Bill Gates, the founder of Microsoft, as the richest person in the United States. His personal wealth was estimated to be $53 billion. Given that there were about 309 million people living in the United States that year, how much could each person have received if Gates' wealth had been divided equally among the population of the United States? (Hint: A billion is a 1 followed by 9 zeros while a million is a 1 followed by six zeros.) LO1
If the entire wealth of Bill Gates is equally distributed among the population,
The average American wealth =
 =
=
 Therefore, an average American wealth is $171.5
The average American wealth =
= Therefore, an average American wealth is $171.5 2
Use quintiles to briefly summarize the degree of income inequality in the United States. How and to what extent does government reduce income inequality?
One way to measure, income inequality is to divide the total number of individuals, households, or families into five numerically equal groups known as quintiles and examine the percentage of total personal income received by each quintile. The income share received by the highest 20 percent was 50 percent in 2008, which is almost 15 times the 3.4 percent received by the lowest 20 percent. The middle three quintiles receive 46.6 percent in total of the total before-tax income.
The income data used is before-tax data and therefore do not take into account the effects of personal income and payroll taxes that are levied directly on income receivers. They do not include in-kind or noncash transfers, which provide specific goods or services rather than cash. However, through taxes and transfers Government significantly redistributes income from higher income households to lower income households. Without government redistribution, the lowest 20 percent of households in 2008 would have received only 0.9 percent of total income. With redistribution, they received 4.2 percent or 4.7 times as much.
The income data used is before-tax data and therefore do not take into account the effects of personal income and payroll taxes that are levied directly on income receivers. They do not include in-kind or noncash transfers, which provide specific goods or services rather than cash. However, through taxes and transfers Government significantly redistributes income from higher income households to lower income households. Without government redistribution, the lowest 20 percent of households in 2008 would have received only 0.9 percent of total income. With redistribution, they received 4.2 percent or 4.7 times as much.
3
Imagine an economy with only two people, Larry earns $20,000 per year, while Roger earns $80,000 per year. As shown in the following figure, the Lorenz curve for this two-person economy consists of two line segments. The first runs from the origin to point a, while the second runs from point a to point b
a. Calculate the Gini ratio for this two-person economy using the geometric formulas for the area of a triangle (= ½ × base × height) and the area of a rectangle (= base × height). (Hint: The area under the line segment from point a to point b can be thought of as the sum of the area of a particular triangle and the area of a particular rectangle.)
b. What would the Gini ratio be if the government taxed $20,000 away from Roger and gave it to Larry? (Hint: The figure will change.)
c. Start again with Larry earning $20,000 per year and Roger earning $80,000 per year. What would the Gini ratio be if both their incomes doubled? How much has the Gini ratio changed from before the doubling in incomes to after the doubling in incomes?
a. Calculate the Gini ratio for this two-person economy using the geometric formulas for the area of a triangle (= ½ × base × height) and the area of a rectangle (= base × height). (Hint: The area under the line segment from point a to point b can be thought of as the sum of the area of a particular triangle and the area of a particular rectangle.)
b. What would the Gini ratio be if the government taxed $20,000 away from Roger and gave it to Larry? (Hint: The figure will change.)
c. Start again with Larry earning $20,000 per year and Roger earning $80,000 per year. What would the Gini ratio be if both their incomes doubled? How much has the Gini ratio changed from before the doubling in incomes to after the doubling in incomes?
(a) The Gini ratio is 0.300.
(b) The Gini ratio here is 0.100.
(c) The Gini ratio will remain as it was in part (a) at 0.300; the ratio has not changed.
Feedback: Consider the following example. Imagine an economy with only two people. Larry earns $20,000 per year while Roger earns $80,000 per year. As shown in the following figure, the Lorenz curve for this two?person economy consists of two line segments. The first runs from the origin to point a while the second runs from point a to point b.
 Part a:
Calculate the Gini ratio for this two?person economy using the geometric formulas for the area of a triangle (= ½ x base x height) and the area of a rectangle (= base x height).
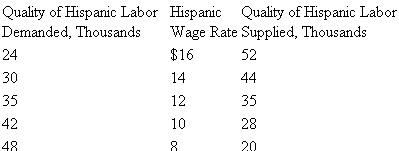
The Gini ratio is the area between the perfect equality line and the Lorenz curve divided by the area under the perfect equality line.
First, we find the area under the equality line. Using our formula for the area of a right triangle we have an area of 5000 (= (1/2) x 100 (base or x-axis) x 100 (height or y-axis).
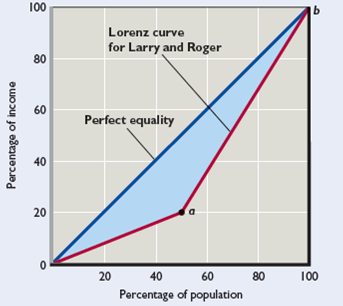
Second, we find the area between the two curves. To do this we start by finding the area UNDER the Lorenz curve (we have easy to use formulas for triangles and rectangles). See the graph below.
 The area of triangle A is 500 (= (1/2) x 50 (base) x 20 (height)). The base of the triangle is 50 (at 50%) because there are only two people in the economy. The height of the triangle is 20 (at 20%) because the lowest income is $20,000, which is 20% of the total income earned in society (= ($20,000 / $100,000) x 100).
The area of rectangle B is 1000 (= 50 (base) x 20 (height)).
The area of triangle C is 2000 (= (1/2) x 50 (base) x 80 (height).
The total area under the Lorenz Curve is 3500. We can now find the area between the two curves, which is 1500 (= 5000 (the area under the equality curve) - 3500 (the area under the Lorenz curve)).
The final step of this procedure is to take the ratio of the area between the two curves and the area under the equality curve, which gives us the Gini ratio. The Gini ratio for this example is 0.3 (=1500/5000).
Part b:
What would the Gini ratio be if the government taxed $20,000 away from Roger and gave it to Larry? (Hint: The figure will change.)
After the tax and redistribution program Larry's new income is $40,000 and Roger's new income is $60,000. This implies that Larry (50% of the population) now controls 40% of society's income rather than the 20% before the program.
To calculate the new Gini ratio we use the same procedure as above. However, we use 40% rather than the 20% shown in the diagram.
With this new value we have:
The area of triangle A is 1000 (= (1/2) x 50 (base) x 40 (height)).
The area of rectangle B is 2000 (= 50 (base) x 40 (height)).
The area of triangle C is 1500 (= (1/2) x 50 (base) x 60 (height).
The total area under the Lorenz Curve is 4500. We can now find the area between the two curves, which is 500 (= 5000 (the area under the equality curve, note this does not change) - 4500 (the area under the Lorenz curve)).
The Gini ratio for this income distribution is 0.1 (= 500 / 5000).
Part c:
Start again with Larry earning $20,000 per year and Roger earning $80,000 per year. What would the Gini ratio be if both their incomes doubled? How much has the Gini ratio changed from before the doubling in incomes to after the doubling in incomes?
If incomes double, Larry earns $40,000 and Roger earns $160,000. The total income in society is now $200,000. Larry still only controls 20% of the society's income ((=$40,000/$200,000) x 100). Since the doubling of incomes does not change the percentage of income controlled by Larry (or Roger) the Gini ratio will not change. The answer will be the same as in part a.
(b) The Gini ratio here is 0.100.
(c) The Gini ratio will remain as it was in part (a) at 0.300; the ratio has not changed.
Feedback: Consider the following example. Imagine an economy with only two people. Larry earns $20,000 per year while Roger earns $80,000 per year. As shown in the following figure, the Lorenz curve for this two?person economy consists of two line segments. The first runs from the origin to point a while the second runs from point a to point b.
Part a:Calculate the Gini ratio for this two?person economy using the geometric formulas for the area of a triangle (= ½ x base x height) and the area of a rectangle (= base x height).
The Gini ratio is the area between the perfect equality line and the Lorenz curve divided by the area under the perfect equality line.
First, we find the area under the equality line. Using our formula for the area of a right triangle we have an area of 5000 (= (1/2) x 100 (base or x-axis) x 100 (height or y-axis).
Second, we find the area between the two curves. To do this we start by finding the area UNDER the Lorenz curve (we have easy to use formulas for triangles and rectangles). See the graph below.
The area of triangle A is 500 (= (1/2) x 50 (base) x 20 (height)). The base of the triangle is 50 (at 50%) because there are only two people in the economy. The height of the triangle is 20 (at 20%) because the lowest income is $20,000, which is 20% of the total income earned in society (= ($20,000 / $100,000) x 100).The area of rectangle B is 1000 (= 50 (base) x 20 (height)).
The area of triangle C is 2000 (= (1/2) x 50 (base) x 80 (height).
The total area under the Lorenz Curve is 3500. We can now find the area between the two curves, which is 1500 (= 5000 (the area under the equality curve) - 3500 (the area under the Lorenz curve)).
The final step of this procedure is to take the ratio of the area between the two curves and the area under the equality curve, which gives us the Gini ratio. The Gini ratio for this example is 0.3 (=1500/5000).
Part b:
What would the Gini ratio be if the government taxed $20,000 away from Roger and gave it to Larry? (Hint: The figure will change.)
After the tax and redistribution program Larry's new income is $40,000 and Roger's new income is $60,000. This implies that Larry (50% of the population) now controls 40% of society's income rather than the 20% before the program.
To calculate the new Gini ratio we use the same procedure as above. However, we use 40% rather than the 20% shown in the diagram.
With this new value we have:
The area of triangle A is 1000 (= (1/2) x 50 (base) x 40 (height)).
The area of rectangle B is 2000 (= 50 (base) x 40 (height)).
The area of triangle C is 1500 (= (1/2) x 50 (base) x 60 (height).
The total area under the Lorenz Curve is 4500. We can now find the area between the two curves, which is 500 (= 5000 (the area under the equality curve, note this does not change) - 4500 (the area under the Lorenz curve)).
The Gini ratio for this income distribution is 0.1 (= 500 / 5000).
Part c:
Start again with Larry earning $20,000 per year and Roger earning $80,000 per year. What would the Gini ratio be if both their incomes doubled? How much has the Gini ratio changed from before the doubling in incomes to after the doubling in incomes?
If incomes double, Larry earns $40,000 and Roger earns $160,000. The total income in society is now $200,000. Larry still only controls 20% of the society's income ((=$40,000/$200,000) x 100). Since the doubling of incomes does not change the percentage of income controlled by Larry (or Roger) the Gini ratio will not change. The answer will be the same as in part a.
4
Assume that Al, Beth, Carol, David, and Ed receive incomes of $500, $250, $125, $75, and $50, respectively. Construct and interpret a Lorenz curve for this five-person economy. What percentage of total income is received by the richest quintile and by the poorest quintile?
Unlock Deck
Unlock for access to all 19 flashcards in this deck.
Unlock Deck
k this deck
5
In 2010, many unskilled workers in the United States earned the Federal minimum wage of $7.25 per hour. By contrast, average earnings in 2010 were about $22 per hour, and certain highly skilled professionals, such as doctors and lawyers, earned $100 or more per houra. If we assume that wage differences are caused solely by differences in productivity, how many times more productive was the average worker than a worker being paid the Federal minimum wage? How many times more productive was a $100-per-hour lawyer compared to a worker earning minimum wage?
b. Assume that there are 20 minimum-wage workers in the economy for each $100-per-hour lawyer. Also assume that both lawyers and minimum-wage workers work the same number of hours per week. If everyone works 40 hours per week, how much does a $100-per-hour lawyer earn a week? How much does a minimum-wage worker earn a week?
c. Suppose that the government pairs each $100-per-hour lawyer with 20 nearby minimum-wage workers. If the government taxes 25 percent of each lawyer's income each week and distributes it equally among the 20 minimumwage workers with whom each lawyer is paired, how much will each of those minimum-wage workers receive each week? If we divide by the number of hours worked each week, how much does each minimum-wage worker's weekly transfer amount to on an hourly basis?
d. What if instead the government taxed each lawyer 100 percent before dividing the money equally among the 20 minimum-wage workers with whom each lawyer is paired-how much per week will each minimum-wage worker receive? And how much is that on an hourly basis?
Unlock Deck
Unlock for access to all 19 flashcards in this deck.
Unlock Deck
k this deck
6
How does the Gini ratio relate to the Lorenz curve? Why can't the Gini ratio exceed 1? What is implied about the direction of income inequality if the Gini ratio declines from 0.42 to 0.35? How would one show that change of inequality in the Lorenz diagram?
Unlock Deck
Unlock for access to all 19 flashcards in this deck.
Unlock Deck
k this deck
7
The desire to maximize profits can work against racial and other types of discrimination. To see this, consider two equally productive accountants named Ted and Jared. Ted is black, and Jared is white. Both can complete 10 audits per montha. Suppose that for any accounting firm that hires either Ted or Jared, all the other costs of performing an audit (besides paying either Ted or Jared) come to $1000 per audit. If the going rate that must be paid to hire an accountant is $7000 per month, how much will it cost an accounting firm to produce one audit if it hires either Ted or Jared to do the work?
b. If the market price that accounting firms charge their clients for an audit is $1800, what would the accounting profit per audit be for a firm that hired either Ted or Jared? What is the profit rate as a percentage?
c. Suppose that firm A dislikes hiring black accountants, while firm B is happy to hire them. So Ted ends up working at firm B rather than firm A. If Ted works 11 months per year, how many audits will he complete for firm B each year? How much in accounting profits will firm B earn each year from those audits?
d. Because firm A passed on hiring Ted because he was black, firm A is forgoing the profits it could have earned if it had hired Ted. If the firm is willing to forgo up to $5,000 per year in profit to avoid hiring blacks, by how many dollars will firm A regret its decision not to hire Ted?
Unlock Deck
Unlock for access to all 19 flashcards in this deck.
Unlock Deck
k this deck
8
Why is the lifetime distribution of income more equal than the distribution in any specific year?
Unlock Deck
Unlock for access to all 19 flashcards in this deck.
Unlock Deck
k this deck
9
Briefly discuss the major causes of income inequality. With respect to income inequality, is there any difference between inheriting property and inheriting a high IQ? Explain.
Unlock Deck
Unlock for access to all 19 flashcards in this deck.
Unlock Deck
k this deck
10
What factors have contributed to increased income inequality since 1970?
Unlock Deck
Unlock for access to all 19 flashcards in this deck.
Unlock Deck
k this deck
11
Should a nation's income be distributed to its members according to their contributions to the production of that total income or according to the members' needs? Should society attempt to equalize income or economic opportunities? Are the issues of equity and equality in the distribution of income synonymous? To what degree, if any, is income inequality equitable?
Unlock Deck
Unlock for access to all 19 flashcards in this deck.
Unlock Deck
k this deck
12
Do you agree or disagree? Explain your reasoning. "There need be no trade-off between equality and efficiency. An 'efficient' economy that yields an income distribution that many regard as unfair may cause those with meager incomes to become discouraged and stop trying. So efficiency may be undermined. A fairer distribution of rewards may generate a higher average productive effort on the part of the population, thereby enhancing efficiency. If people think they are playing a fair economic game and this belief causes them to try harder, an economy with an equitable income distribution may be efficient as well" 6 LO4
Unlock Deck
Unlock for access to all 19 flashcards in this deck.
Unlock Deck
k this deck
13
Comment on or explain: LO4
a. Endowing everyone with equal income will make for very unequal enjoyment and satisfaction.
b. Equality is a "superior good"; the richer we become, the more of it we can afford.
c. The mob goes in search of bread, and the means it employs is generally to wreck the bakeries.
d. Some freedoms may be more important in the long run than freedom from want on the part of every individual.
e. Capitalism and democracy are really a most improbable mixture. Maybe that is why they need each other-to put some rationality into equality and some humanity into efficiency.
f. The incentives created by the attempt to bring about a more equal distribution of income are in conflict with the incentives needed to generate increased income
Unlock Deck
Unlock for access to all 19 flashcards in this deck.
Unlock Deck
k this deck
14
How do government statisticians determine the poverty rate? How could the poverty rate fall while the number of people in poverty rises? Which group in each of the following pairs has the higher poverty rate: ( a ) children or people age 65 or over? ( b ) African Americans or foreign-bora noncitizens? ( c ) Asians or Hispanics?
Unlock Deck
Unlock for access to all 19 flashcards in this deck.
Unlock Deck
k this deck
15
What are the essential differences between social insurance and public assistance programs? Why is Medicare a social insurance program, whereas Medicaid is a public assistance program? Why is the earned-income tax credit considered to be a public assistance program?
Unlock Deck
Unlock for access to all 19 flashcards in this deck.
Unlock Deck
k this deck
16
The labor demand and supply data in the following table relate to a single occupation. Use them to answer the
questions that follow. Base your answers on the taste-for- discrimination modela. Plot the labor demand and supply curves for Hispanic workers in this occupation.
b. What are the equilibrium Hispanic wage rate and quantity of Hispanic employment?
c. Suppose the white wage rate in this occupation is $16. What is the Hispanic-to-white wage ratio?
d. Suppose a particular employer has a discrimination coefficient d of $5 per hour. Will that employer hire Hispapnic or white workers at the Hispanic-white wage ratio indicated in part c ? Explain.
e. Suppose employers as a group become less prejudiced against Hispanics and demand 14 more units of Hispanic labor at each Hispanic wage rate in the table. What are the new equilibrium Hispanic wage rate and level of Hispanic employment? Does the Hispanic-white wage ratio rise or fall? Explain.
f. Suppose Hispanics as a group increase their labor services in that occupation, collectively offering 14 mole units of labor at each Hispanic wage rate. Disregarding the changes indicated in part e, what are the new equilibrium Hispanic wage rate and level of Hispanic employment? Does the Hispanic-white wage ratio rise, or does it fall?
questions that follow. Base your answers on the taste-for- discrimination modela. Plot the labor demand and supply curves for Hispanic workers in this occupation.b. What are the equilibrium Hispanic wage rate and quantity of Hispanic employment?
c. Suppose the white wage rate in this occupation is $16. What is the Hispanic-to-white wage ratio?
d. Suppose a particular employer has a discrimination coefficient d of $5 per hour. Will that employer hire Hispapnic or white workers at the Hispanic-white wage ratio indicated in part c ? Explain.
e. Suppose employers as a group become less prejudiced against Hispanics and demand 14 more units of Hispanic labor at each Hispanic wage rate in the table. What are the new equilibrium Hispanic wage rate and level of Hispanic employment? Does the Hispanic-white wage ratio rise or fall? Explain.
f. Suppose Hispanics as a group increase their labor services in that occupation, collectively offering 14 mole units of labor at each Hispanic wage rate. Disregarding the changes indicated in part e, what are the new equilibrium Hispanic wage rate and level of Hispanic employment? Does the Hispanic-white wage ratio rise, or does it fall?
Unlock Deck
Unlock for access to all 19 flashcards in this deck.
Unlock Deck
k this deck
17
Males under the age of 25 must pay far higher auto insurance premiums than females in this age group. How does this fact relate to statistical discrimination? Statistical di: crimination implies that discrimination can persist indefinitely, while the taste-for-discrimination model suggest that competition might reduce discrimination in the long run. Explain the difference
Unlock Deck
Unlock for access to all 19 flashcards in this deck.
Unlock Deck
k this deck
18
Use a demand-and-supply model to explain the impact of occupational segregation or "crowding" on the relative wage rates and earnings of men and women. Who gains and which loses from the elimination of occupational segregation? Is there a net gain or a net loss to society? Explain
Unlock Deck
Unlock for access to all 19 flashcards in this deck.
Unlock Deck
k this deck
19
LAST WORD Go to Table 1 in the Last Word and compute, the ratio of average wealth to median wealth for each of the 5 years. What trend do you find? What is your explanation; for the trend? The Federal estate tax redistributes wealth in two ways: by encouraging charitable giving, which reduces the taxable estate, and by heavily taxing extraordinarily large estates and using the proceeds to fund government programs. Do you favor repealing the estate tax? Explain
Unlock Deck
Unlock for access to all 19 flashcards in this deck.
Unlock Deck
k this deck
Unlock Deck
Unlock for access to all 19 flashcards in this deck.


