Deck 2: Labor Supply
Full screen (f)
Question
Question
Question
Question
Question
Question
Question
Question
Question
In 1999, 4,860 TANF recipients were asked how many hours they worked in the previous week. In 2000, 4,392 of these recipients were again subject to the same TANF rules and were again asked their hours of work during the previous week. The remaining 468 individuals were randomly assigned to a "Negative Income Tax" (NIT) experiment that gave out financial incentives for welfare recipients to work and were subject to its rules. Like the other group, they were asked about their hours of work during the previous week. The data from the experiment are contained in the table below.
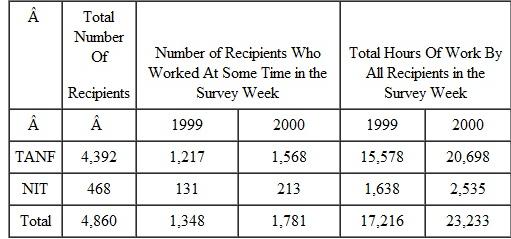 (a) What effect did the NIT experiment have on the employment rate of public assistance recipients Develop a standard difference-in-differences table to support your answer.
(b) What effect did the NIT experiment have on the weekly hours worked of public assistance recipients who worked positive hours during the survey week Develop a standard difference-in-differences table to support your answer.
(a) What effect did the NIT experiment have on the employment rate of public assistance recipients Develop a standard difference-in-differences table to support your answer. (b) What effect did the NIT experiment have on the weekly hours worked of public assistance recipients who worked positive hours during the survey week Develop a standard difference-in-differences table to support your answer.
Question
Question
Question
Question
Question
Question
Question
Question
Question
Question
Question
Question
Question
Question
Question
Question
Question
Question
Question

Unlock Deck
Sign up to unlock the cards in this deck!
Unlock Deck
Unlock Deck
1/28
Play
Full screen (f)
Deck 2: Labor Supply
1
What happens to hours of work when the wage rate falls Decompose the change in hours of work into income and substitution effects.
When the wage rate falls it can have two effects namely the income effect and the substitution effect.
When a decrease in wage rate decreases the opportunity cost of enjoying one more hour of leisure and hence increasing the demand for leisure is known as substitution effect.
On the other hand, when a decrease in wage rate will cause the demand for leisure to fall because now less money is earned is known as income effect.
Suppose that a worker has non-labor income V and the initial budget line is EG. The reduction in wages will rotate the budget line around the endowment point. The budget line will rotate from EF to EG. The following two figures illustrate the effect of a decrease in wage rate on hours of work and leisure.
In the following figures, the decrease in wage shift the optimal bundle from P to Q in the first stage because with fall in the wage, a worker will have smaller opportunity set and income effect leads to decrease in leisure and increase in work hours. As the wage falls, the leisure becomes less expensive for workers and due to the substitution effect worker increase leisure to consume fewer goods with the shift to lower indifference curve U 1. In this figure, the leisure increases from L 1 to L 2 and working hours decreases.
Following graph shows the dominant substitution effect: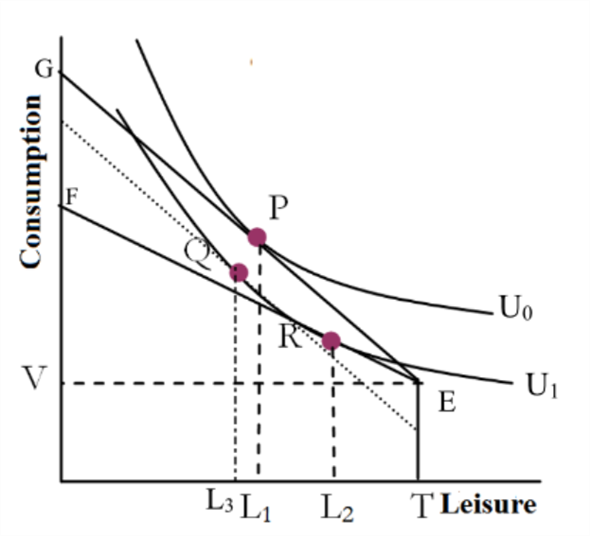 In the graph drawn above, the movement from point P to Q shows the income effect which occurs due to a change in the income of worker keeping wages constant. In the second stage, the shift from Q to R signifies substitution effect which occurs when consumption bundle changes due to change in wage keeping utility constant.
In this case, substitution effect dominates income effect and hence the end result is a greater number of leisure hours (or less number of work hours).
Thus as substitution effect dominates income effect, the leisure hours rises from L 1 to L 2.
Following graph shows the dominant income effect: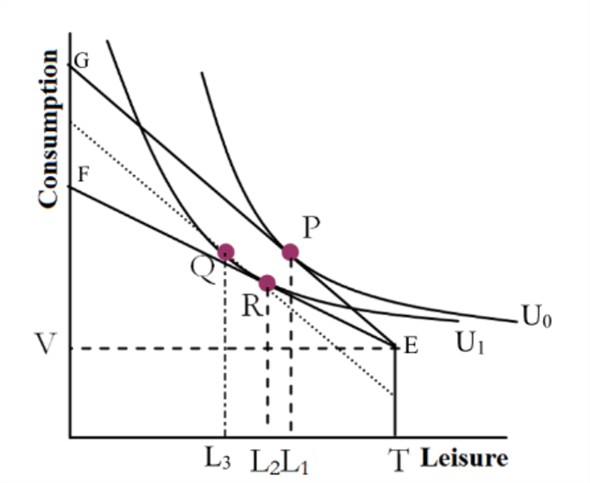 In the graph drawn above, the movement from point P to Q shows the income effect which occurs due to a change in the income of worker keeping wages constant. In the second stage, the shift from Q to R signifies substitution effect which occurs when consumption bundle changes due to change in wage keeping utility constant.
In this case, income effect dominates substitution effect and hence the end result is a lesser number of leisure hours (or a greater number of work hours).
Thus as income effect dominates substitution effect, the leisure hours fall from L 1 to L 2.
When a decrease in wage rate decreases the opportunity cost of enjoying one more hour of leisure and hence increasing the demand for leisure is known as substitution effect.
On the other hand, when a decrease in wage rate will cause the demand for leisure to fall because now less money is earned is known as income effect.
Suppose that a worker has non-labor income V and the initial budget line is EG. The reduction in wages will rotate the budget line around the endowment point. The budget line will rotate from EF to EG. The following two figures illustrate the effect of a decrease in wage rate on hours of work and leisure.
In the following figures, the decrease in wage shift the optimal bundle from P to Q in the first stage because with fall in the wage, a worker will have smaller opportunity set and income effect leads to decrease in leisure and increase in work hours. As the wage falls, the leisure becomes less expensive for workers and due to the substitution effect worker increase leisure to consume fewer goods with the shift to lower indifference curve U 1. In this figure, the leisure increases from L 1 to L 2 and working hours decreases.
Following graph shows the dominant substitution effect:
In the graph drawn above, the movement from point P to Q shows the income effect which occurs due to a change in the income of worker keeping wages constant. In the second stage, the shift from Q to R signifies substitution effect which occurs when consumption bundle changes due to change in wage keeping utility constant. In this case, substitution effect dominates income effect and hence the end result is a greater number of leisure hours (or less number of work hours).
Thus as substitution effect dominates income effect, the leisure hours rises from L 1 to L 2.
Following graph shows the dominant income effect:
In the graph drawn above, the movement from point P to Q shows the income effect which occurs due to a change in the income of worker keeping wages constant. In the second stage, the shift from Q to R signifies substitution effect which occurs when consumption bundle changes due to change in wage keeping utility constant. In this case, income effect dominates substitution effect and hence the end result is a lesser number of leisure hours (or a greater number of work hours).
Thus as income effect dominates substitution effect, the leisure hours fall from L 1 to L 2.
2
What factors account for the secular decline in labor force participation rates among older workers in the United States
In US disabled workers are eligible to receive disability payments from the government till the disability lasts. The disability benefits are equal to the retirement benefits. The disability benefit does not need the worker to be working till the retirement age which is necessary to claim the retirement benefits. Thus many workers claim that they are disabled, in order to enjoy leisure activities with early retirement.
This makes most of the old labours to claim early retirement.
This makes most of the old labours to claim early retirement.
3
Shelly's preferences for consumption and leisure can be expressed as
U(C,L) = ( C - 200 ) × ( L - 80 ).
This utility function implies that Shelly's marginal utility of leisure is C - 200 and her marginal utility of consumption is L - 80. There are 168 hours in the week available to split between work and leisure. Shelly earns $5 per hour after taxes. She also receives $320 worth of welfare benefits each week regardless of how much she works.
a) Graph Shelly's budget line.
(b) What is Shelly's marginal rate of substitution when L = 100 and she is on her budget line
(c) What is Shelly's reservation wage
(d) Find Shelly's optimal amount of consumption and leisure.
Given information:
• Preference of consumption and leisure is .
.
• Marginal utility of leisure is .
.
• Marginal utility of consumption is .
.
• A total working hour is 168.
• Earning is $5 per hour after tax.
• Welfare benefit is worth of $320.
Budget constraint (line):
Budget line refers to the possible combination of goods and services that is purchased at a given price level with the entire income.
a. Budget line:
Figure -1 show the consumption of leisure hour and the income earn by the person.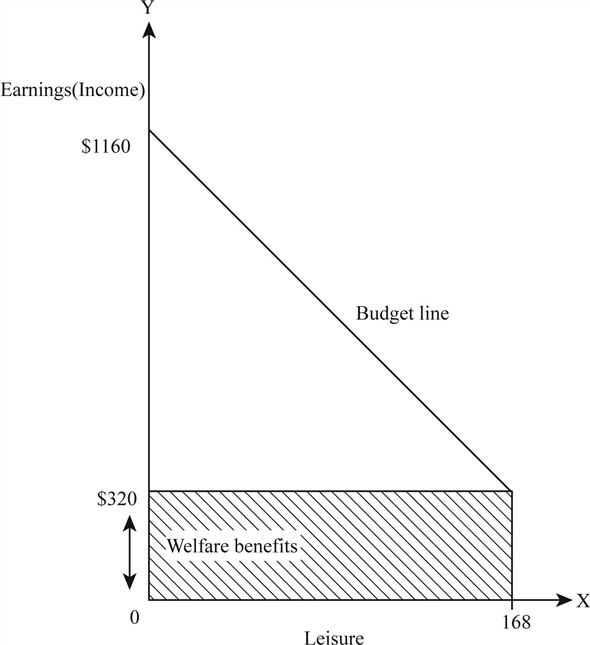 Figure -1
In figure -1, X axis measures the purchase of 'leisure and Y axis measures the earnings of the person. If the person consumes only leisure, then he can get 168 hours of leisure and $320 worth of welfare benefit. This is shown by the shaded area. On the other hand, if the person uses 168 hours to work then he can earn $1,160 .
.
b. Marginal rate of substitution with l is equal to 100:
Marginal rate of substitution can be calculated as follows:
 Thus the marginal rate of substitution is
  .
.
c. Reservation wage:
Reservation wage can be calculated as follows: Thus, reservation wage is
  .
.
d. Optimum amount of leisure:
Optimum amount of leisure can be calculated as follows:
 Thus, optimum level of leisure is
  .
.
• Preference of consumption and leisure is
.• Marginal utility of leisure is
.• Marginal utility of consumption is
.• A total working hour is 168.
• Earning is $5 per hour after tax.
• Welfare benefit is worth of $320.
Budget constraint (line):
Budget line refers to the possible combination of goods and services that is purchased at a given price level with the entire income.
a. Budget line:
Figure -1 show the consumption of leisure hour and the income earn by the person.
Figure -1In figure -1, X axis measures the purchase of 'leisure and Y axis measures the earnings of the person. If the person consumes only leisure, then he can get 168 hours of leisure and $320 worth of welfare benefit. This is shown by the shaded area. On the other hand, if the person uses 168 hours to work then he can earn $1,160
.b. Marginal rate of substitution with l is equal to 100:
Marginal rate of substitution can be calculated as follows:
Thus the marginal rate of substitution is .c. Reservation wage:
Reservation wage can be calculated as follows:
Thus, reservation wage is .d. Optimum amount of leisure:
Optimum amount of leisure can be calculated as follows:
Thus, optimum level of leisure is . 4
Consider a person who can work up to 80 hours each week at a pretax wage of $20 per hour but faces a constant 20 percent payroll tax. Under these conditions, the worker maximizes her utility by choosing to work 50 hours each week. The government proposes a negative income tax whereby everyone is given $300 each week and anyone can supplement her income further by working. To pay for the negative income tax, the payroll tax rate will be increased to 50 percent.
(a) On a single graph, draw the worker's original budget line and her budget line under the negative income tax.
(b) Show that the worker will choose to work fewer hours if the negative income tax is adopted.
(c) Will the worker's utility be greater under the negative income tax
(a) On a single graph, draw the worker's original budget line and her budget line under the negative income tax.
(b) Show that the worker will choose to work fewer hours if the negative income tax is adopted.
(c) Will the worker's utility be greater under the negative income tax
Unlock Deck
Unlock for access to all 28 flashcards in this deck.
Unlock Deck
k this deck
5
What happens to the probability that a particular person works when the wage rises Does such a wage increase generate an income effect
Unlock Deck
Unlock for access to all 28 flashcards in this deck.
Unlock Deck
k this deck
6
Why did Malthus err in predicting that families would have more children as incomes increased
Unlock Deck
Unlock for access to all 28 flashcards in this deck.
Unlock Deck
k this deck
7
Explain why a lump sum government transfer can entice some workers to stop working (and entices no one to start working) while the earned income tax credit can entice some people who otherwise would not work to start working (and entices no one to stop working).
Unlock Deck
Unlock for access to all 28 flashcards in this deck.
Unlock Deck
k this deck
8
Why do welfare programs create work disincentives
Unlock Deck
Unlock for access to all 28 flashcards in this deck.
Unlock Deck
k this deck
9
In 1999, 4,860 TANF recipients were asked how many hours they worked in the previous week. In 2000, 4,392 of these recipients were again subject to the same TANF rules and were again asked their hours of work during the previous week. The remaining 468 individuals were randomly assigned to a "Negative Income Tax" (NIT) experiment that gave out financial incentives for welfare recipients to work and were subject to its rules. Like the other group, they were asked about their hours of work during the previous week. The data from the experiment are contained in the table below.
(a) What effect did the NIT experiment have on the employment rate of public assistance recipients Develop a standard difference-in-differences table to support your answer.
(b) What effect did the NIT experiment have on the weekly hours worked of public assistance recipients who worked positive hours during the survey week Develop a standard difference-in-differences table to support your answer.
(a) What effect did the NIT experiment have on the employment rate of public assistance recipients Develop a standard difference-in-differences table to support your answer. (b) What effect did the NIT experiment have on the weekly hours worked of public assistance recipients who worked positive hours during the survey week Develop a standard difference-in-differences table to support your answer.
Unlock Deck
Unlock for access to all 28 flashcards in this deck.
Unlock Deck
k this deck
10
Why does the earned income tax credit increase the labor force participation rate of targeted groups
Unlock Deck
Unlock for access to all 28 flashcards in this deck.
Unlock Deck
k this deck
11
How many hours will a person allocate to leisure activities if her indifference curves between consumption and goods are concave to the origin
Unlock Deck
Unlock for access to all 28 flashcards in this deck.
Unlock Deck
k this deck
12
Consider two workers with identical preferences, Phil and Bill. Both workers have the same life cycle wage path in that they face the same wage at every age, and they know what their future wages will be. Leisure and consumption are both normal goods.
(a) Compare the life cycle path of hours of work between the two workers if Bill receives a one-time, unexpected inheritance at the age of 35.
(b) Compare the life cycle path of hours of work between the two workers if Bill had always known he would receive (and, in fact, does receive) a one-time inheritance at the age of 35.
Unlock Deck
Unlock for access to all 28 flashcards in this deck.
Unlock Deck
k this deck
13
What happens to the reservation wage if nonlabor income increases, and why
Unlock Deck
Unlock for access to all 28 flashcards in this deck.
Unlock Deck
k this deck
14
Why have average hours worked per week declined
Unlock Deck
Unlock for access to all 28 flashcards in this deck.
Unlock Deck
k this deck
15
What is the effect of an increase in the price of market goods on a worker's reservation wage, probability of entering the labor force, and hours of work
Unlock Deck
Unlock for access to all 28 flashcards in this deck.
Unlock Deck
k this deck
16
Under current law, most Social Security recipients do not pay federal or state income taxes on their Social Security benefits. Suppose the government proposes to tax these benefits at the same rate as other types of income. What is the impact of the proposed tax on the optimal retirement age
Unlock Deck
Unlock for access to all 28 flashcards in this deck.
Unlock Deck
k this deck
17
What economic factors determine whether a person participates in the labor force
Unlock Deck
Unlock for access to all 28 flashcards in this deck.
Unlock Deck
k this deck
18
Why did the labor force participation rate of women increase so much in the past century
Unlock Deck
Unlock for access to all 28 flashcards in this deck.
Unlock Deck
k this deck
19
Tom earns $15 per hour for up to 40 hours of work each week. He is paid $30 per hour for every hour in excess of 40. Tom faces a 20 percent tax rate and pays $4 per hour in child care expenses for each hour he works. Tom receives $80 in child support payments each week. There are 168 hours in the week. Graph Tom's weekly budget line.
Unlock Deck
Unlock for access to all 28 flashcards in this deck.
Unlock Deck
k this deck
20
A worker plans to retire at the age of 65, at which time he will start collecting his retirement benefits. Then there is a sudden change in the forecast of inflation when the worker is 63 years old. In particular, inflation is now predicted to be higher than it had been expected so that the average price level of market goods and wages is now expected to be higher. What effect does this announcement have on the person's preferred retirement age:
(a) If retirement benefits are fully adjusted for inflation
(b) If retirement benefits are not fully adjusted for inflation
(a) If retirement benefits are fully adjusted for inflation
(b) If retirement benefits are not fully adjusted for inflation
Unlock Deck
Unlock for access to all 28 flashcards in this deck.
Unlock Deck
k this deck
21
How does a typical worker decide how many hours to allocate to the labor market
Unlock Deck
Unlock for access to all 28 flashcards in this deck.
Unlock Deck
k this deck
22
Why does a worker allocate his or her time over the life cycle so as to work more hours in those periods when the wage is highest Why does the worker not experience an income effect during those periods
Unlock Deck
Unlock for access to all 28 flashcards in this deck.
Unlock Deck
k this deck
23
Cindy gains utility from consumption C and leisure L. The most leisure she can consume in any given week is 168 hours. Her utility function is U(C,L) = C × L. This functional form implies that Cindy's marginal rate of substitution is C / L. Cindy receives $630 each week from her great-grandmother regardless of how much Cindy works. What is Cindy's reservation wage
Unlock Deck
Unlock for access to all 28 flashcards in this deck.
Unlock Deck
k this deck
24
Presently, there is a minimum and maximum social security benefit paid to retirees. Between these two bounds, a retiree's benefit level depends on how much she contributed to the system over her work life. Suppose Social Security was changed so that everyone aged 65 or older was paid $12,000 per year regardless of how much she earned over her working life or whether she continued to work after the age of 65. How would this likely affect hours worked of retirees
Unlock Deck
Unlock for access to all 28 flashcards in this deck.
Unlock Deck
k this deck
25
What happens to hours of work when nonlabor income decreases
Unlock Deck
Unlock for access to all 28 flashcards in this deck.
Unlock Deck
k this deck
26
What is the added worker effect What is the discouraged worker effect
Unlock Deck
Unlock for access to all 28 flashcards in this deck.
Unlock Deck
k this deck
27
You can either take a bus or drive your car to work. A bus pass costs $5 per week, whereas driving your car to work costs $60 weekly (parking, tolls, gas, etc.). You spend half-an-hour less on a one-way trip in your car than on a bus. How would you prefer to travel to work if your wage rate is $10 per hour Will you change your preferred mode of transportation if your wage rate rises to $20 per hour Assume you work five days a week and time spent riding on a bus or driving a car does not directly enter your utility.
Unlock Deck
Unlock for access to all 28 flashcards in this deck.
Unlock Deck
k this deck
28
Over the last 100 years, real household income and standards of living have increased substantially in the United States. At the same time, the total fertility rate, the average number of children born to a woman during her lifetime, has fallen in the United States from about three children per woman in the early twentieth century to about two children per woman in the early twenty-first century. Does this suggest that children are inferior goods
Unlock Deck
Unlock for access to all 28 flashcards in this deck.
Unlock Deck
k this deck
Unlock Deck
Unlock for access to all 28 flashcards in this deck.


