Deck 7: Measuring the Wealth of Nations
Full screen (f)
Question
Question
Question
Question
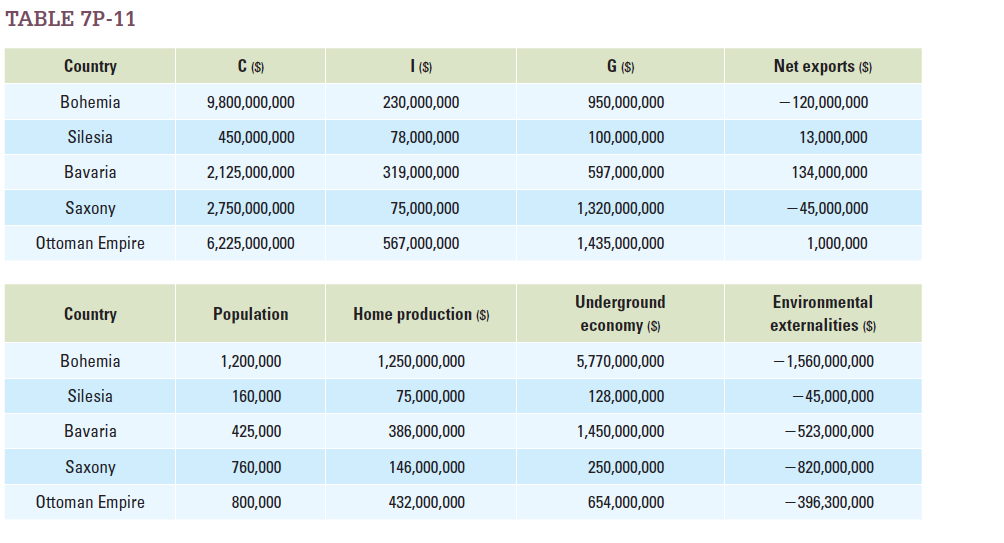
Table 7P-11 shows data on population and expenditures in five countries, as well as the value of home production, the underground economy, and environmental externalities in each.
a. Calculate GDP and GDP per capita in each country.
b. Calculate the size of home production, the underground economy, and environmental externalities in each country as a percentage of GDP.
c. Calculate total and per capita "GDP-plus" in each country by including the value of home production, the underground economy, and environmental externalities.
d. Rank countries by total and per capita GDP, and again by total and per capita "GDPplus." Compare the two lists. Are the biggest and the smallest economies the same or different?
Question
Question
Question
Question
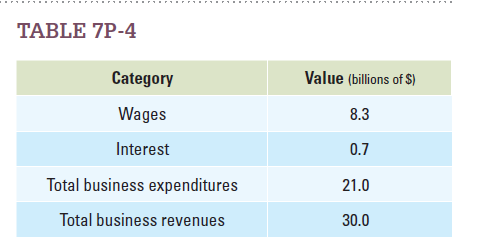
Assume Table 7P-4 summarizes the income of Paraguay.
a. Calculate profits.
b. Calculate the GDP of Paraguay using the income approach.
c. What would GDP be if you were to use the value-added approach?
d. What would GDP be if you were to use the expenditure approach?
a. Calculate profits.
b. Calculate the GDP of Paraguay using the income approach.
c. What would GDP be if you were to use the value-added approach?
d. What would GDP be if you were to use the expenditure approach?
Question
Question
Question
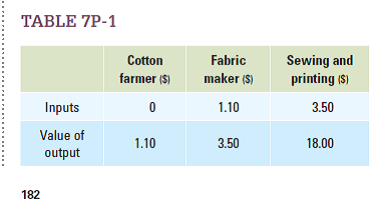
Table 7P-1 shows the price of inputs and the price of outputs at each step in the production process of making a shirt. Assume that each of these steps takes place within the country.
a. What is the total contribution of this shirt to GDP, using the standard expenditure method?
b. If we use a value-added method (i.e., summing the value added by producers at each step of the production process, equal to the price of inputs minus the price of outputs), what is the contribution of this shirt to GDP?
c. If we mistakenly added the price of both intermediate and final outputs without adjusting for value added, what would we find that this shirt contributes to GDP? By how much does this overestimate the true contribution?
Question
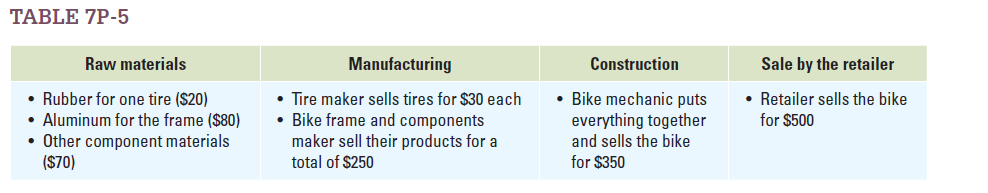
Table 7P-5 shows the prices of the inputs and outputs for the production of a road bike.
a. What value is added by the supplier of the raw materials?
b. What value is added by the tire maker?
c. What value is added by the maker of the frame and components?
d. What value is added by the bike mechanic?
e. What value is added by the bike store?
f. What is the total contribution of the bike to GDP?
Question
Question
Question
Question
Imagine that the U.S. produces only three goods: apples, bananas, and carrots. The quantities produced and the prices of the three goods are listed in Table 7P-6.
a. Calculate the GDP of the United States in this three-goods version of its economy.
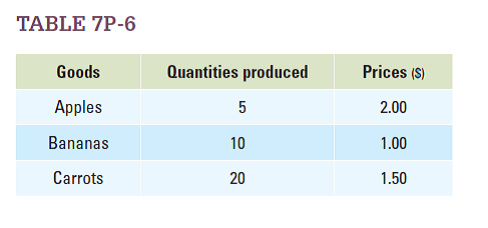
b. Suppose that a drought hits the state of Washington. This drought causes the quantity of apples produced to fall to 2. Assuming that all prices remain constant, calculate the new U.S. GDP.
c. Assume, once again, that the quantities produced and the prices of the three goods are as listed in Table 7P-6. Now, given this situation, carrot sellers decide that the price of carrots is too low, so they agree to raise the price. What must be the new price of carrots if the U.S. GDP is $60?
a. Calculate the GDP of the United States in this three-goods version of its economy.
b. Suppose that a drought hits the state of Washington. This drought causes the quantity of apples produced to fall to 2. Assuming that all prices remain constant, calculate the new U.S. GDP.
c. Assume, once again, that the quantities produced and the prices of the three goods are as listed in Table 7P-6. Now, given this situation, carrot sellers decide that the price of carrots is too low, so they agree to raise the price. What must be the new price of carrots if the U.S. GDP is $60?
Question
Question
Question
Question
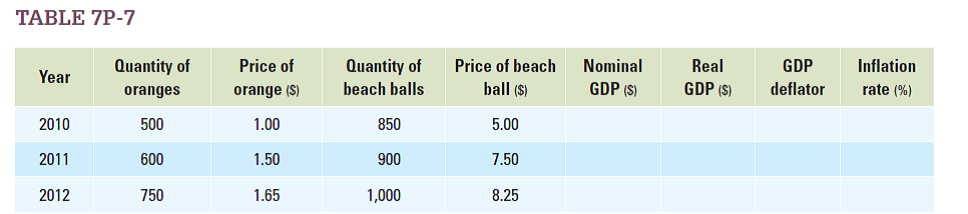
Based on Table 7P-7 , calculate nominal GDP, real GDP, the GDP deflator, and the inflation rate in each year, and fill in the missing parts of the table. Use 2010 as the base year.
Question
Question
Question
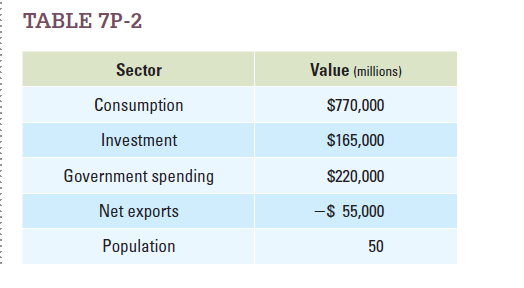
Using Table 7P-2 , calculate the following.
a. Total gross domestic product and GDP per person.
b. Consumption, investment, government purchases, and net exports, each as a percentage of total GDP.
c. Consumption, investment, government purchases, and net exports per person.
a. Total gross domestic product and GDP per person.
b. Consumption, investment, government purchases, and net exports, each as a percentage of total GDP.
c. Consumption, investment, government purchases, and net exports per person.
Question
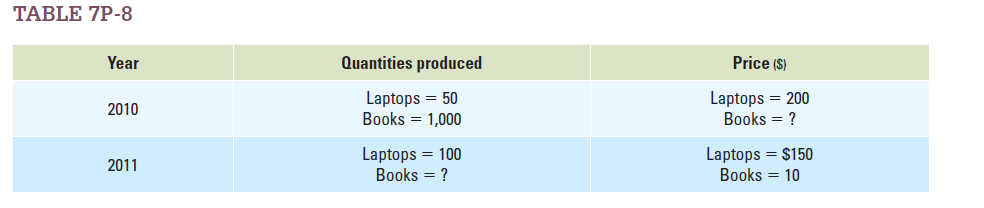
Suppose that the British economy produces two goods: laptops and books. The quantity produced and the prices of these items for 2010 and 2011 are shown in Table 7P-8.
a. Let's assume that the base year was 2010, so that real GDP in 2010 equals nominal GDP in 2010. If the real GDP in Britain was $15,000 in 2010, what was the price of books?
b. Using your answer from part a, if the growth rate in nominal GDP was 10 percent, how many books must have been produced in 2011?
c. Using your answers from parts a and b, what is the real GDP in 2011? What was the growth rate in real GDP between 2010 and 2011?
Question
Question
Question
Question
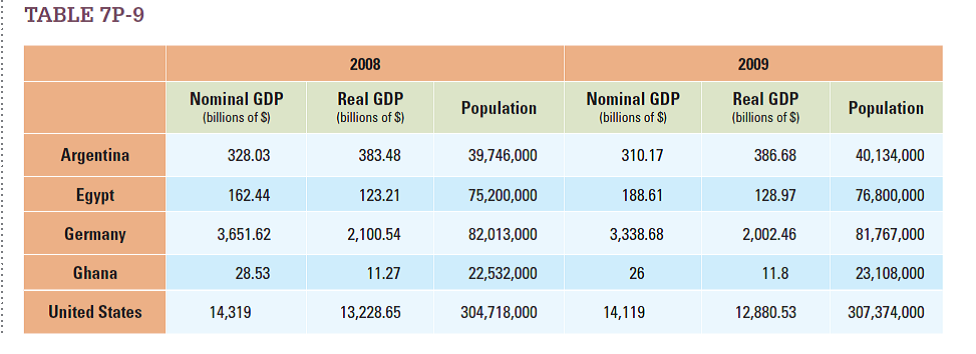
Based on Table 7P-9 , calculate nominal GDP per capita in 2008 and 2009, and the real GDP growth rate between the two years. Which countries look like they experienced recession in 2008-2009?
Question
Question
Question
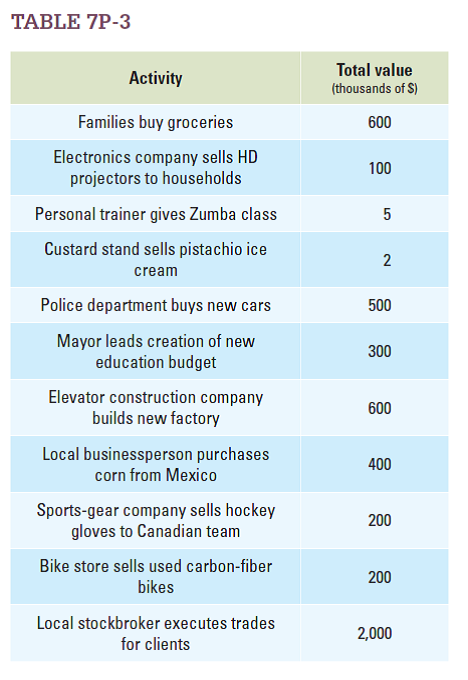
Table 7P-3 shows economic activity for a very tiny country. Using the expenditure approach determine the following.
a. Consumption.
b. Investment.
c. Government purchases.
d. Net exports.
e. GDP.
a. Consumption.
b. Investment.
c. Government purchases.
d. Net exports.
e. GDP.
Question
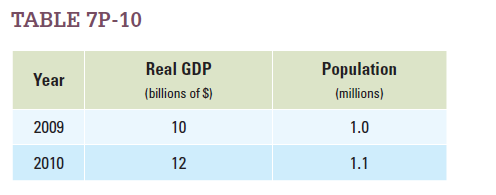
Table 7P-10 describes the real GDP and population of a fictional country in 2009 and 2010.
a. What is the real GDP per capita in 2009 and 2010?
b. What is the growth rate in real GDP?
c. What is the growth rate in population?
d. What is the growth rate in real GDP per capita?
a. What is the real GDP per capita in 2009 and 2010?
b. What is the growth rate in real GDP?
c. What is the growth rate in population?
d. What is the growth rate in real GDP per capita?

Unlock Deck
Sign up to unlock the cards in this deck!
Unlock Deck
Unlock Deck
1/32
Play
Full screen (f)
Deck 7: Measuring the Wealth of Nations
1
If car companies produce a lot of cars this year but hold the new models back in warehouses until they release them in the new-model year, will this year's GDP be higher, lower, or the same as it would have been if the cars had been sold right away? Why? Does the choice to reserve the cars for a year change which category of expenditures they fall under?
Gross domestic product (GDP):
GDP refers to the market value of all final goods and services produced in a domestic territory during a given period of time. There are four basic components of GDP, including consumption, gross investment, government purchases of goods and services and net export. GDP can be calculated by using expenditure approach, income approach and output approach. This can be written as follows: …… (1) Where,
Y = real gross domestic product or aggregate demand.C = consumption.
I = investment.
G = government expenditure.X = exports.
I = Imports.
Car sales:
When the car is produced in the current year, then it included in the current GDP calculation regardless of the time period that car being sold. If the car sold in the current year to the government, firm and individual person, then it come under Government expenditure, investment and consumption respectively in the GDP calculation. IF the firm stocks the car to sell this in future year, then the production is counted as investment.
GDP refers to the market value of all final goods and services produced in a domestic territory during a given period of time. There are four basic components of GDP, including consumption, gross investment, government purchases of goods and services and net export. GDP can be calculated by using expenditure approach, income approach and output approach. This can be written as follows:
…… (1) Where,Y = real gross domestic product or aggregate demand.C = consumption.
I = investment.
G = government expenditure.X = exports.
I = Imports.
Car sales:
When the car is produced in the current year, then it included in the current GDP calculation regardless of the time period that car being sold. If the car sold in the current year to the government, firm and individual person, then it come under Government expenditure, investment and consumption respectively in the GDP calculation. IF the firm stocks the car to sell this in future year, then the production is counted as investment.
2
Suppose a college student is texting while driving and gets into a car accident causing $2,000 worth of damage to her car. Assuming the student repairs her car, does GDP rise, fall, or stay constant with this accident? What does your answer suggest about using GDP as a measure of well-being?
Gross domestic product (GDP):
GDP refers to the market value of all final goods and services produced in a domestic territory during a given period of time. There are four basic components of GDP, including consumption, gross investment, government purchases of goods and services and net export. GDP can be calculated by using expenditure approach, income approach and output approach.
Estimation of GDP:
During the repair of the car, some of the spare parts were replaced and it involves the service of the repair shop. The $2,000 fee indicates that the value of spare parts and the provision of services equal to $2,000. Thus, it is included in the GDP calculation. Thus, GDP is increases by $2,000.
The GDP is includes the replacement whereas does not consider the value of destruction occurred due to the accident. Thus, it is the example for imperfect measure of well being.
3
During the recent recession sparked by financial crisis, the U.S. economy suffered tremendously. Suppose that, due to the recession, the U.S. GDP dropped from $14 trillion to $12.5 trillion. This decline in GDP was due to a drop in consumption of $1 trillion and a drop in investment of $500 billion. The U.S. government, under the current president, responded to this recession by increasing government purchases.
a. Suppose that government spending had no impact on consumption, investment, or net exports. If the current presidential administration wanted to bring GDP back up to $14 trillion, how much would government spending have to rise?
b. Many economists believe that an increase in government spending doesn't just directly increase GDP, but that it also leads to an increase in consumption. If government spending rises by $1 trillion, how much would consumption have to rise in order to bring GDP back to $14 trillion?
Gross domestic product (GDP):
GDP refers to the market value of all final goods and services produced in a domestic territory during a given period of time. There are four basic components of GDP, including consumption, gross investment, government purchases of goods and services and net export. GDP can be calculated by using expenditure approach, income approach and output approach. …… (1) Where,
Y = real gross domestic product or aggregate demand.C = consumption.
I = investment.
G = government expenditure.X = exports.
I = Imports.
a.Unchanged GDP:
Consumption is decreases by $1 trillion and investment decreases by $0.5 trillion. Thus, in order to maintain the same amount of GDP, it is required to increase the Government expenditure by $1.5 trillion (Need to compensate the decrease amount).
b.Maintain the same level of GDP:
Consumption is decreases by $1 trillion and investment decreases by $0.5 trillion. Since government expenditure increase $1 trillion it offsets the decreasing value of consumption. To maintain the same amount of GDP, it is required to increase the 0.5 trillion (Need to offset the decreasing investment), consumption.
GDP refers to the market value of all final goods and services produced in a domestic territory during a given period of time. There are four basic components of GDP, including consumption, gross investment, government purchases of goods and services and net export. GDP can be calculated by using expenditure approach, income approach and output approach.
…… (1) Where,Y = real gross domestic product or aggregate demand.C = consumption.
I = investment.
G = government expenditure.X = exports.
I = Imports.
a.Unchanged GDP:
Consumption is decreases by $1 trillion and investment decreases by $0.5 trillion. Thus, in order to maintain the same amount of GDP, it is required to increase the Government expenditure by $1.5 trillion (Need to compensate the decrease amount).
b.Maintain the same level of GDP:
Consumption is decreases by $1 trillion and investment decreases by $0.5 trillion. Since government expenditure increase $1 trillion it offsets the decreasing value of consumption. To maintain the same amount of GDP, it is required to increase the 0.5 trillion (Need to offset the decreasing investment), consumption.
4
Table 7P-11 shows data on population and expenditures in five countries, as well as the value of home production, the underground economy, and environmental externalities in each.
a. Calculate GDP and GDP per capita in each country.
b. Calculate the size of home production, the underground economy, and environmental externalities in each country as a percentage of GDP.
c. Calculate total and per capita "GDP-plus" in each country by including the value of home production, the underground economy, and environmental externalities.
d. Rank countries by total and per capita GDP, and again by total and per capita "GDPplus." Compare the two lists. Are the biggest and the smallest economies the same or different?
a. Calculate GDP and GDP per capita in each country.
b. Calculate the size of home production, the underground economy, and environmental externalities in each country as a percentage of GDP.
c. Calculate total and per capita "GDP-plus" in each country by including the value of home production, the underground economy, and environmental externalities.
d. Rank countries by total and per capita GDP, and again by total and per capita "GDPplus." Compare the two lists. Are the biggest and the smallest economies the same or different?
Unlock Deck
Unlock for access to all 32 flashcards in this deck.
Unlock Deck
k this deck
5
The value-added method involves taking the price of intermediate outputs (i.e., outputs that will in turn be used in the production of another good) and subtracting the cost of producing each one. In this way, only the value that is added at each step (the sale value minus the value that went into producing it) is summed up. producing it) is summed up. Explain why this method gives us the same result as the standard method of counting only the value of final goods and services.
Unlock Deck
Unlock for access to all 32 flashcards in this deck.
Unlock Deck
k this deck
6
Suppose a parent was earning $20,000 per year working at a local firm. The parent then decides to quit his job in order to care for his child, who was being watched by a babysitter for $10,000 per year. Does GDP rise, fall, or stay constant with this action, and how much does GDP change (if at all)?
Unlock Deck
Unlock for access to all 32 flashcards in this deck.
Unlock Deck
k this deck
7
Suppose a gold miner finds a gold nugget and sells the nugget to a mining company for $500. The mining company melts down the gold, purifies it, and sells it to a jewelry maker for $1,000. The jewelry maker fashions the gold into a necklace which it sells to a department store for $1,500. Finally, the department store sells the necklace to a customer for $2,000. How much has GDP increased as a result of these transactions?
Unlock Deck
Unlock for access to all 32 flashcards in this deck.
Unlock Deck
k this deck
8
Assume Table 7P-4 summarizes the income of Paraguay.
a. Calculate profits.
b. Calculate the GDP of Paraguay using the income approach.
c. What would GDP be if you were to use the value-added approach?
d. What would GDP be if you were to use the expenditure approach?
a. Calculate profits.
b. Calculate the GDP of Paraguay using the income approach.
c. What would GDP be if you were to use the value-added approach?
d. What would GDP be if you were to use the expenditure approach?
Unlock Deck
Unlock for access to all 32 flashcards in this deck.
Unlock Deck
k this deck
9
S. car dealers sell both used cars and new cars each year. However, only the sales of the new cars count toward GDP. Why does the sale of used cars not count?
Unlock Deck
Unlock for access to all 32 flashcards in this deck.
Unlock Deck
k this deck
10
Imagine a painter is trying to determine the value she adds when she paints a picture. Assume that after spending $200 on materials, she sells one copy of her painting for $500. She then spends $50 to make 10 copies of her painting, each of which sells for $100. What is the value added of her painting? What if a company then spends $10 per copy to sell 100 more copies, each for $50? What is the value the painter adds then? If it's unknown how many copies the painting will sell in the future, can we today determine the value added? Why or why not?
Unlock Deck
Unlock for access to all 32 flashcards in this deck.
Unlock Deck
k this deck
11
Table 7P-1 shows the price of inputs and the price of outputs at each step in the production process of making a shirt. Assume that each of these steps takes place within the country.
a. What is the total contribution of this shirt to GDP, using the standard expenditure method?
b. If we use a value-added method (i.e., summing the value added by producers at each step of the production process, equal to the price of inputs minus the price of outputs), what is the contribution of this shirt to GDP?
c. If we mistakenly added the price of both intermediate and final outputs without adjusting for value added, what would we find that this shirt contributes to GDP? By how much does this overestimate the true contribution?
a. What is the total contribution of this shirt to GDP, using the standard expenditure method?
b. If we use a value-added method (i.e., summing the value added by producers at each step of the production process, equal to the price of inputs minus the price of outputs), what is the contribution of this shirt to GDP?
c. If we mistakenly added the price of both intermediate and final outputs without adjusting for value added, what would we find that this shirt contributes to GDP? By how much does this overestimate the true contribution?
Unlock Deck
Unlock for access to all 32 flashcards in this deck.
Unlock Deck
k this deck
12
Table 7P-5 shows the prices of the inputs and outputs for the production of a road bike.
a. What value is added by the supplier of the raw materials?
b. What value is added by the tire maker?
c. What value is added by the maker of the frame and components?
d. What value is added by the bike mechanic?
e. What value is added by the bike store?
f. What is the total contribution of the bike to GDP?
a. What value is added by the supplier of the raw materials?
b. What value is added by the tire maker?
c. What value is added by the maker of the frame and components?
d. What value is added by the bike mechanic?
e. What value is added by the bike store?
f. What is the total contribution of the bike to GDP?
Unlock Deck
Unlock for access to all 32 flashcards in this deck.
Unlock Deck
k this deck
13
There is an old saying, "You can't compare apples and oranges." When economists calculate GDP, are they able to compare apples and oranges? Explain.
Unlock Deck
Unlock for access to all 32 flashcards in this deck.
Unlock Deck
k this deck
14
In a press conference, the president of a small country displays a chart showing that GDP has risen by 10 percent every year for five years. He argues that this growth shows the brilliance of his economic policy. However, his chart uses nominal GDP numbers. What might be wrong with this chart? If you were a reporter at the press conference, what questions could you ask to get a more accurate picture of the country's economic growth?
Unlock Deck
Unlock for access to all 32 flashcards in this deck.
Unlock Deck
k this deck
15
The U.S. government gives income support to many families living in poverty. How does each of the following aspects of this policy contribute to GDP?
a. Does this government's expenditure on income support count as part of GDP? If so, in which category of expenditure does it fall?
b. When the families buy groceries with the money they've received, does this expenditure count as part of GDP? If so, in which category does it fall?
c. If the families buy new houses with the money they've received, does this count as part of GDP? If so, in which category does it fall?
Unlock Deck
Unlock for access to all 32 flashcards in this deck.
Unlock Deck
k this deck
16
Imagine that the U.S. produces only three goods: apples, bananas, and carrots. The quantities produced and the prices of the three goods are listed in Table 7P-6.
a. Calculate the GDP of the United States in this three-goods version of its economy.
b. Suppose that a drought hits the state of Washington. This drought causes the quantity of apples produced to fall to 2. Assuming that all prices remain constant, calculate the new U.S. GDP.
c. Assume, once again, that the quantities produced and the prices of the three goods are as listed in Table 7P-6. Now, given this situation, carrot sellers decide that the price of carrots is too low, so they agree to raise the price. What must be the new price of carrots if the U.S. GDP is $60?
Unlock Deck
Unlock for access to all 32 flashcards in this deck.
Unlock Deck
k this deck
17
When Americans buy goods produced in Canada, Canadians earn income from American expenditures. Does the value of this Canadian output and American expenditure get counted under the GDP of Canada or the United States? Why?
Unlock Deck
Unlock for access to all 32 flashcards in this deck.
Unlock Deck
k this deck
18
Suppose that the GDP deflator grew by 10 percent from last year to this year. That is, the inflation rate this year was 10 percent. In words, what does this mean happened in the economy? What does this inflation rate imply about the growth rate in real GDP?
Unlock Deck
Unlock for access to all 32 flashcards in this deck.
Unlock Deck
k this deck
19
Given the following information about each economy, either calculate the missing variable or determine that it cannot be calculated.
a. If C = $20.1 billion, I = $3.5 billion, G = $5.2 billion, and NX = - $1 billion, what is total income?
b. If total income is $1 trillion, G 5 $0.3 trillion, and C 5 $0.5 trillion, what is I?
c. If total expenditure is $675 billion, C = $433 billion, I = 105 billion, and G = $75 billion, what is NX? How much are exports? How much are imports?
Unlock Deck
Unlock for access to all 32 flashcards in this deck.
Unlock Deck
k this deck
20
Based on Table 7P-7 , calculate nominal GDP, real GDP, the GDP deflator, and the inflation rate in each year, and fill in the missing parts of the table. Use 2010 as the base year.
Unlock Deck
Unlock for access to all 32 flashcards in this deck.
Unlock Deck
k this deck
21
Economists sometimes describe the economy as having a "circular flow." In the most basic form of the circular flow model, companies hire workers and pay them wages. Workers then use these wages to buy goods and services from companies. How does the circular flow model explain the equivalence of the expenditure and income methods of valuing an economy?
Unlock Deck
Unlock for access to all 32 flashcards in this deck.
Unlock Deck
k this deck
22
An inexperienced researcher wants to examine the average standard of living in two countries. In order to do so, he compares the GDPs in those two countries. What are two reasons why this comparison does not lead to an accurate measure of the countries' average standards of living?
Unlock Deck
Unlock for access to all 32 flashcards in this deck.
Unlock Deck
k this deck
23
Using Table 7P-2 , calculate the following.
a. Total gross domestic product and GDP per person.
b. Consumption, investment, government purchases, and net exports, each as a percentage of total GDP.
c. Consumption, investment, government purchases, and net exports per person.
a. Total gross domestic product and GDP per person.
b. Consumption, investment, government purchases, and net exports, each as a percentage of total GDP.
c. Consumption, investment, government purchases, and net exports per person.
Unlock Deck
Unlock for access to all 32 flashcards in this deck.
Unlock Deck
k this deck
24
Suppose that the British economy produces two goods: laptops and books. The quantity produced and the prices of these items for 2010 and 2011 are shown in Table 7P-8.
a. Let's assume that the base year was 2010, so that real GDP in 2010 equals nominal GDP in 2010. If the real GDP in Britain was $15,000 in 2010, what was the price of books?
b. Using your answer from part a, if the growth rate in nominal GDP was 10 percent, how many books must have been produced in 2011?
c. Using your answers from parts a and b, what is the real GDP in 2011? What was the growth rate in real GDP between 2010 and 2011?
a. Let's assume that the base year was 2010, so that real GDP in 2010 equals nominal GDP in 2010. If the real GDP in Britain was $15,000 in 2010, what was the price of books?
b. Using your answer from part a, if the growth rate in nominal GDP was 10 percent, how many books must have been produced in 2011?
c. Using your answers from parts a and b, what is the real GDP in 2011? What was the growth rate in real GDP between 2010 and 2011?
Unlock Deck
Unlock for access to all 32 flashcards in this deck.
Unlock Deck
k this deck
25
In 2011, the average baseball player earned $3 million per year. Suppose that these baseball players spend all of their income on goods and services each year, and they save nothing. Argue why the sum of the incomes of all baseball players must equal the sum of expenditures made by the baseball players.
Unlock Deck
Unlock for access to all 32 flashcards in this deck.
Unlock Deck
k this deck
26
In 2010, according to the International Monetary Fund, India had the world's 10th-highest nominal GDP, the 135th-highest nominal GDP per capita, and the 5th-highest real GDP growth rate. What does each of these indicators tell us about the Indian economy and how life in India compares to life in other countries
Unlock Deck
Unlock for access to all 32 flashcards in this deck.
Unlock Deck
k this deck
27
Determine which category each of the following economic activities falls under: consumption (C), investment (I), government purchases (G), net exports (NX), or not included in GDP.
a. The mayor of Chicago authorizes the construction of a new stadium using public funds.
b. A student pays rent on her apartment.
c. Parents pay college tuition for their son.
d. Someone buys a new Toyota car produced in Japan.
e. Someone buys a used Toyota car.
f. Someone buys a new General Motors car produced in the United States.
g. A family buys a house in a newly constructed housing development.
h. The U.S. Army pays its soldiers.
i. A Brazilian driver buys a Ford car produced in the United States.
j. The Department of Motor Vehicles buys a new machine for printing driver's licenses.
k. An apple picked in Washington State in October is bought at a grocery store in Mississippi in December.
l. Hewlett-Packard produces a computer and sends it to a warehouse in another state for sale next year.
Unlock Deck
Unlock for access to all 32 flashcards in this deck.
Unlock Deck
k this deck
28
Based on Table 7P-9 , calculate nominal GDP per capita in 2008 and 2009, and the real GDP growth rate between the two years. Which countries look like they experienced recession in 2008-2009?
Unlock Deck
Unlock for access to all 32 flashcards in this deck.
Unlock Deck
k this deck
29
Determine whether each of the following counts as consumption, investment, government purchases, net exports, or none of these, under the expenditure approach to calculating GDP. Explain your answer.
a. The construction of a court house.
b. A taxicab ride.
c. The purchase of a taxicab by a taxicab company.
d. A student buying a textbook.
e. The trading of municipal bonds (a type of financial investment offered by city or state governments).
f. A company's purchase of foreign minerals.
a. The construction of a court house.
b. A taxicab ride.
c. The purchase of a taxicab by a taxicab company.
d. A student buying a textbook.
e. The trading of municipal bonds (a type of financial investment offered by city or state governments).
f. A company's purchase of foreign minerals.
Unlock Deck
Unlock for access to all 32 flashcards in this deck.
Unlock Deck
k this deck
30
China is a rapidly growing country. It has high levels of bureaucracy and business regulation, low levels of environmental regulation, and a strong tradition of entrepreneurship. Discuss several reasons why official GDP estimates in China might miss significant portions of the country's economic activity.
Unlock Deck
Unlock for access to all 32 flashcards in this deck.
Unlock Deck
k this deck
31
Table 7P-3 shows economic activity for a very tiny country. Using the expenditure approach determine the following.
a. Consumption.
b. Investment.
c. Government purchases.
d. Net exports.
e. GDP.
a. Consumption.
b. Investment.
c. Government purchases.
d. Net exports.
e. GDP.
Unlock Deck
Unlock for access to all 32 flashcards in this deck.
Unlock Deck
k this deck
32
Table 7P-10 describes the real GDP and population of a fictional country in 2009 and 2010.
a. What is the real GDP per capita in 2009 and 2010?
b. What is the growth rate in real GDP?
c. What is the growth rate in population?
d. What is the growth rate in real GDP per capita?
a. What is the real GDP per capita in 2009 and 2010?
b. What is the growth rate in real GDP?
c. What is the growth rate in population?
d. What is the growth rate in real GDP per capita?
Unlock Deck
Unlock for access to all 32 flashcards in this deck.
Unlock Deck
k this deck
Unlock Deck
Unlock for access to all 32 flashcards in this deck.


