Deck 1: Introduction
Full screen (f)
Question
Question
Question
Question
Question
Question
Question
Question
Question

Unlock Deck
Sign up to unlock the cards in this deck!
Unlock Deck
Unlock Deck
1/9
Play
Full screen (f)
Deck 1: Introduction
1
In your own words, describe the role of statistics in the research process. Using the wheel of science as a framework, explain how statistics link theory with research.
In the research process, statistics is an indispensable tool. And scientist can evaluate their research ideas and hypothesis using the statistical tools and techniques.
The "wheel of science" shows how statistics helps the researcher in research process. According to the "wheel of science", there is a circular flow in different scientific phenomenon. It consists of four components, such as, Theory, Hypothesis, Observations, and Empirical generalizations.
Theory gives an explanation about the relationship between the phenomena whereas the hypothesis give a logical statement, that is derived from the theory, about the relationship of the variables. Based on the available observations or data, the hypotheses are tested using the statistical tools and significance of the statement is verified. Finally, the wheel leads to 'Empirical generalizations' which is drawing inferences from the result of observations.
Based on the "wheel of science", it can be said that in any research process, the Statistics give scientists the power to form quantitative analysis out of theories and to use statistical tools and techniques to scientifically manipulate and organize the data to draw meaningful conclusions that are relevant to the current as well as future studies.
2
Find a research article in any social science journal. Choose an article on a subject of interest to you, and do not worry about being able to understand all the statistics that are reported.
a. How much of the article is devoted to statistics?
b. Is the research based on a sample from some population? How large is the sample? How were subjects or cases selected? Can the findings be generalized to some population?
c. What variables are used? Which are independent and which are dependent? For each variable, determine the level of measurement.
d. What statistical techniques are used? Try to follow the statistical analysis and see how much you can understand. Save the article and read it again after you finish this course and see if you understand it any better.
(a)The article chosen is 'A study to find awareness regarding green building among builders in Kolkata' and the concerned article is based fully on statistical analysis.
(b)The research is based on sample of green builders from a population of green builders. The sample consisted 28 builders. The cases were selected randomly. Though the findings were generalized in the article concerned, but it would be better to consider more samples for generalized inference.
(c)The variables and their level of measurement are listed below: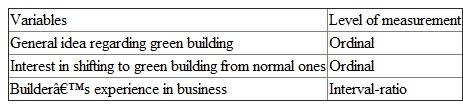 (d)Descriptive statistics is used.
(b)The research is based on sample of green builders from a population of green builders. The sample consisted 28 builders. The cases were selected randomly. Though the findings were generalized in the article concerned, but it would be better to consider more samples for generalized inference.
(c)The variables and their level of measurement are listed below:
(d)Descriptive statistics is used. 3
Distinguish between descriptive and inferential statistics. Describe a research situation that would use both types.
Descriptive statistics:
This is used to describe the numerical data that has been gathered. It makes sense that the first step in any statistical analysis is to describe the data has been obtained.
There are different types of descriptive statistics and these include frequency distribution; measures of central tendency and measures of dispersion.
Inferential statistics:
This makes inferences about population using data drawn from the population instead of using the entire population to gather the data; the researcher will collect samples from the millions of residents and make inferences about the entire population by using the sample.
4
Following are some items from a public-opinion survey. For each item, indicate the level of measurement.
a. What is your occupation? __________
b. How many years of school have you completed? _________
c. If you were asked to use one of these four names for your social class, which would you say you belonged to?
___________ Upper ___________ Middle
___________ Working ___________ Lower
d. What is your age? _____
e. In what country were you born? _____
f. What is your grade-point average? _____
g. What is your major? _____
h. The only way to deal with the drug problem is to legalize all drugs.
________ Strongly agree
________Agree
________ Undecided
________ Disagree
________ Strongly disagree
i. What is your astrological sign? ___________
j. How many brothers and sisters do you have? ___________
Unlock Deck
Unlock for access to all 9 flashcards in this deck.
Unlock Deck
k this deck
5
Following are brief descriptions of how researchers measured a variable. For each situation, determine the level of measurement of the variable.
a. Race or ethnicity. Respondents were asked to check all that apply:
________ Black
________ White
________ Hispanic
________ Asian or Pacific Islander
________ Native American
________ Other (Please specify: ______________)
b. Honesty. Subjects were observed as they passed by a spot where an apparently lost wallet was lying. The wallet contained money and complete identification. Subjects were classified into one of the following categories:
_____ Returned the wallet with money
_____ Returned the wallet but kept the money
_____ Did not return wallet
c. Social class. Subjects were asked about their family situation when they were 16 years old. Was their family:
_____ Very well off compared to other families?
_____ About average?
_____ Not so well off?
d. Education. Subjects were asked how many years of schooling they had completed.
e. Racial integration on campus. Students were observed during lunchtime at the cafeteria for a month. The number of students sitting with students of other races was counted for each meal period.
f. Number of children. Subjects were asked: "How many children have you ever had? Please include any that may have passed away."
g. Student seating patterns in classrooms. On the first day of class, instructors noted where each student sat. Seating patterns were remeasured every two weeks until the end of the semester. Each student was classified as
____ same seat as last measurement;
____ adjacent seat;
____ different seat, not adjacent;
____ absent.
h. Physicians per capita. The number of physicians was counted in each of 50 cities. The researchers used population data to compute the number of physicians per capita.
i. Physical attractiveness. A panel of 10 judges rated each of 50 photos of a mixed-race sample of males and females for physical attractiveness on a scale from 0 to 20, with 20 being the highest score.
j. Number of accidents. The number of traffic accidents for each of 20 intersections was recorded. Also, each accident was rated as
_____ minor damage, no injuries;
_____ moderate damage, personal injury requiring hospitalization;
_____ severe damage and injury.
Unlock Deck
Unlock for access to all 9 flashcards in this deck.
Unlock Deck
k this deck
6
Classify each of the first 20 items in the General Social Survey (see Appendix G) in terms of level of measurement.
Unlock Deck
Unlock for access to all 9 flashcards in this deck.
Unlock Deck
k this deck
7
For each of the following research situations, identify the level of measurement of all variables. Also, decide which statistical applications are used: descriptive statistics (single variable), descriptive statistics (two or more variables), or inferential statistics. Remember that it is quite common for a given situation to require more than one type of application.
a. The administration of your university is proposing a change in parking policy. You select a random sample of students and ask each one if he or she favors or opposes the change.
b. You ask everyone in your social research class for their highest grade in any math course and the grade on a recent statistics test. You compare the two sets of scores to see if there is any relationship.
c. Your aunt is running for mayor and hires you to question a sample of voters about their concerns. Specifically, she wants a profile of voters that will tell her what percentage belong to each political party, what percentage are male or female, and what percentage favor or oppose the widening of the main street in town.
d. Several years ago, a state reinstituted the death penalty for first-degree homicide. Did this reduce the homicide rate? A researcher has gathered information on the number of homicides in the state for the two-year periods before and after the change.
e. A local automobile dealer is concerned about customer satisfaction. He wants to mail a survey form to all customers for the past year and ask them if they are satisfied, very satisfied, or not satisfied with their purchases.
Unlock Deck
Unlock for access to all 9 flashcards in this deck.
Unlock Deck
k this deck
8
Identify all variables in these research projects and classify them by their level of measurement. Which variables are independent and which are dependent?
a. A graduate student asks 500 female students if they have experienced any sexual harassment on campus. Each student is asked to estimate the frequency of these incidents as either "often," "sometimes," "rarely," or "never." The researcher also gathers data on age and major to see if there is any connection between these variables and the frequency of sexual harassment.
b. A supervisor in the Solid Waste Management Division of city government is assessing two different methods of trash collection. One area of the city is served by trucks with two-man crews who do "backyard" pickups, and the rest of the city is served by "high-tech" single-person trucks with curbside pickup. The assessment measures include the number of complaints received from the two different areas over a six-month period, the amount of time per day required to service each area, and the cost per ton of trash collected.
c. The adult bookstore near campus has been raided and closed by the police. Your social research class has decided to poll a sample of students to find out if he or she supports or opposes the closing of the store, how many times each has visited the store, and if he or she agrees or disagrees that "pornography causes sexual assaults on women." The class also collects information on the sex, age, religion, political philosophy, and major to see if opinions are related to these characteristics.
d. For a research project in a political science course, a student has collected information about the quality of life and the degree of political democracy in 50 nations. Specifically, she used infant mortality rates to measure quality of life and the percentage of all adults who are permitted to vote in national elections as a measure of democratization. Her hypothesis is that quality of life is higher in more democratic nations.
e. A highway engineer wonders if a planned increase in the speed limit on a heavily traveled local avenue will result in any change in the number of accidents. He plans to collect information on traffic volume, the number of accidents, and the number of fatalities for the six-month periods before and after the change.
f. Students are planning a program to promote safe sex and awareness of other health concerns for college students. To measure the effectiveness of the program, they plan to give a survey measuring knowledge to a random sample of students before and after the program.
g. States have drastically cut their budgets for mental health care. Will this increase the number of homeless people? A researcher contacts a number of agencies serving the homeless in each state and develops an estimate of the size of the population before and after the cuts.
h. Does tolerance for diversity vary by race or ethnicity? Samples of white, black, Asian, Hispanic, and Native Americans have been given a survey that measures their interest in and appreciation of cultures and groups other than their own.
Unlock Deck
Unlock for access to all 9 flashcards in this deck.
Unlock Deck
k this deck
9
Identify all variables in these research situations and classify them by their level of measurement. Which variables are independent and which are dependent?
a. A researcher is wondering about racial preferences in dating among college students and asks a large sample of undergraduates about their own racial self-identification, gender, and age, and to rank some racial-ethnic categories (stated as: white, black, Latino, Asian) in terms of desirability as potential dates.
b. For adolescents, is one's level of sexual activity related to academic success in high school? A sample of teenagers was interviewed about the number of different romantic relationships they have had, the number of times they have had sexual intercourse, and their high school GPA.
c. Several hundred voting precincts across the nation have been classified in terms of the percentage of minority voters and voting turnout as well as percentage of local elected officials who are members of minority groups. Do precincts with higher percentages of minority voters have lower turnout? Do precincts with higher percentages of minority representation among local elected officials have higher turnout?
d. As nations become more affluent (as measured by per capita income), does the percentage of children enrolled in school increase? Is this relationship different for boys and girls?
e. Does the level of support for gun control vary by level of education? Does this relationship vary by gender, region of the country, or political party preference? Support for gun control was measured by a five-point scale that ranged from "strongly in favor" to "strongly opposed."
Unlock Deck
Unlock for access to all 9 flashcards in this deck.
Unlock Deck
k this deck
Unlock Deck
Unlock for access to all 9 flashcards in this deck.


