Deck 11: Aggregate Supply and Demand
Full screen (f)
Question
Question
Question
Question
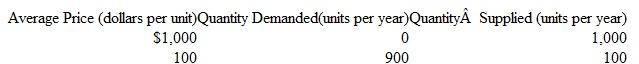
The following schedule provides information with which to draw both an aggregate demand curve and an aggregate supply curve. Both curves are assumed to be straight lines.
 ( a )At what price level does equilibrium occur?
( b )What curve would have shifted if a new equilibrium were to occur at an output level of 700 and a price level of $700?
( c )What curve would have shifted if a new equilibrium were to occur at an output level of 700 and a price level of $500?
( d )What curve would have shifted if a new equilibrium were to occur at an output level of 700 and a price level of $300?
( e )Compared to the initial equilibrium ( a ), how have the outcomes in ( b ), ( c ), and ( d ) changed price levels or output?
( a )At what price level does equilibrium occur?( b )What curve would have shifted if a new equilibrium were to occur at an output level of 700 and a price level of $700?
( c )What curve would have shifted if a new equilibrium were to occur at an output level of 700 and a price level of $500?
( d )What curve would have shifted if a new equilibrium were to occur at an output level of 700 and a price level of $300?
( e )Compared to the initial equilibrium ( a ), how have the outcomes in ( b ), ( c ), and ( d ) changed price levels or output?
Question
Question
Question
Question
Question
Question
Question
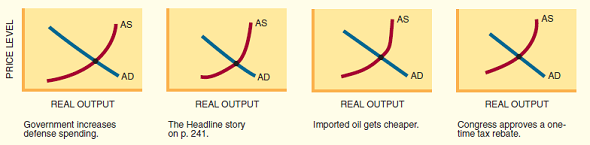
Illustrate these events with AS or AD shifts:
Question
Question
Question
Question
Graph the following aggregate supply and demand curves (be sure to draw to scale).
 ( a )What is the equilibrium price level?
( b )What is the equilibrium output?
( c )If the quantity of output demanded at every price level increases by $2 trillion, what happens to equilibrium output and prices? Graph your answer.
( a )What is the equilibrium price level?( b )What is the equilibrium output?
( c )If the quantity of output demanded at every price level increases by $2 trillion, what happens to equilibrium output and prices? Graph your answer.

Unlock Deck
Sign up to unlock the cards in this deck!
Unlock Deck
Unlock Deck
1/15
Play
Full screen (f)
Deck 11: Aggregate Supply and Demand
1
What kind of external shock would benefit an economy?
The kinds of shocks that can be beneficial for the economy depends on the nature of the situation prevalent in the economy. If the macro equilibrium leads to an undesirable outcome, where for instance the equilibrium price level is higher than the desired price level leading to the current inflation rate being more than what is desired, or the equilibrium output is less than the full employment level, then macroeconomic shocks to aggregate supply or demand can lead to adjustments that lead to the desired outcome.
The above situation can be described by the graph shown below:
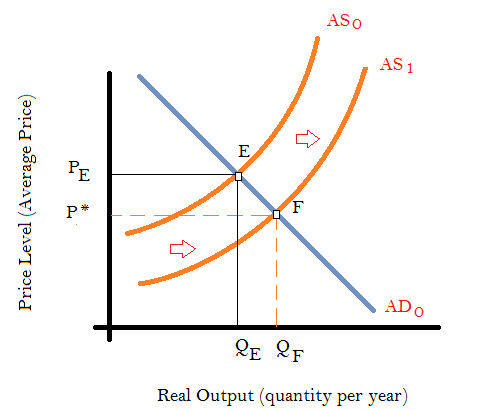
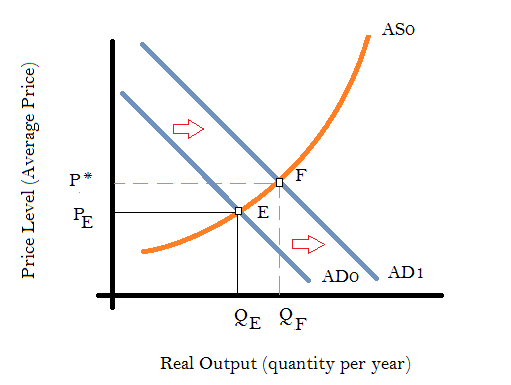 Shift in Demand Curve due to Aggregate Demand Shock
Suppose, AD 0 and AS 0 are the initial aggregate demand and aggregate supply curves that depict the current situation of the economy. Point E represents the current equilibrium point. P E is the equilibrium price level and Q E is the equilibrium output level. Q F is the full employment output level and P* is the corresponding desired price level.
So, initially, the economy is stuck in an undesirable equilibrium where aggregate output is lower than the full employment level and the equilibrium price is lower than the desired price level. Now, as shown in the diagram, if there is a positive shock to aggregate demand so that it shifts to AD 1 , given the aggregate supply remains AS 0 , the new equilibrium point will be F, the full employment equilibrium. So, the corresponding equilibrium aggregate output now will be Q F and the price level shall rise to P*. This is an instance where a positive demand shock benefitted the economy.
Similarly, there can be supply shocks that can also get the economy out of an undesirable equilibrium. This is shown in the graph below.
 Shift in Supply Curve due to Aggregate Supply Shock
AD 0 and AS 0 are the initial aggregate demand and aggregate supply curves. Initially the economy is in equilibrium at point E. Q E is the equilibrium output which is lower than the full employment output level Q F and the price level is P E which is higher than the desired price level P*.
Now, if there is a positive supply shock resulting from some technological innovation that enhances productivity, or there is a sudden decline in oil prices so that all production costs fall then the supply curve shifts outward to AS1 . Provided the aggregate demand remains unchanged, this leads to the price level falling down towards P* and the output level rising up towards the full employment output. Thus, as a consequence of the productivity shock the economy moves towards the desired outcome. This is another instance of shocks being beneficial to the economy.
The above situation can be described by the graph shown below:
Shift in Demand Curve due to Aggregate Demand Shock Suppose, AD 0 and AS 0 are the initial aggregate demand and aggregate supply curves that depict the current situation of the economy. Point E represents the current equilibrium point. P E is the equilibrium price level and Q E is the equilibrium output level. Q F is the full employment output level and P* is the corresponding desired price level.
So, initially, the economy is stuck in an undesirable equilibrium where aggregate output is lower than the full employment level and the equilibrium price is lower than the desired price level. Now, as shown in the diagram, if there is a positive shock to aggregate demand so that it shifts to AD 1 , given the aggregate supply remains AS 0 , the new equilibrium point will be F, the full employment equilibrium. So, the corresponding equilibrium aggregate output now will be Q F and the price level shall rise to P*. This is an instance where a positive demand shock benefitted the economy.
Similarly, there can be supply shocks that can also get the economy out of an undesirable equilibrium. This is shown in the graph below.
Shift in Supply Curve due to Aggregate Supply Shock AD 0 and AS 0 are the initial aggregate demand and aggregate supply curves. Initially the economy is in equilibrium at point E. Q E is the equilibrium output which is lower than the full employment output level Q F and the price level is P E which is higher than the desired price level P*.
Now, if there is a positive supply shock resulting from some technological innovation that enhances productivity, or there is a sudden decline in oil prices so that all production costs fall then the supply curve shifts outward to AS1 . Provided the aggregate demand remains unchanged, this leads to the price level falling down towards P* and the output level rising up towards the full employment output. Thus, as a consequence of the productivity shock the economy moves towards the desired outcome. This is another instance of shocks being beneficial to the economy.
2
Draw a conventional aggregate demand curve on a graph. Then add three different aggregate supply
curves, labeled
S1 : Horizontal curve
S2 : Upward-sloping curve
S 3 : Vertical curve
all intersecting the AD curve at the same point. If AD were to increase (shift to the right), which AS curve would lead to
( a )The biggest increase in output?
( b )The largest jump in prices?
( c )The least inflation?
In the diagram below, D 1 is the conventional aggregate demand curve. S1 is the horizontal AS curve, S2 is the upward sloping AS curve and S 3 is the vertical AS curve.
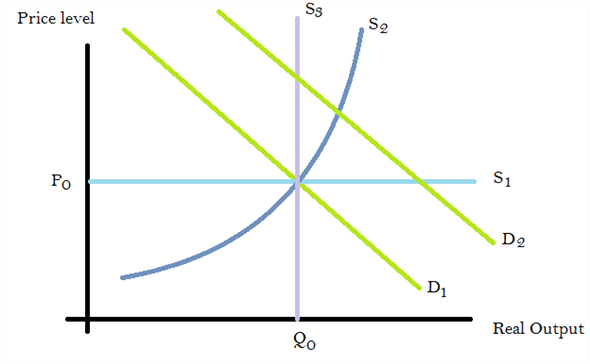 Conventional Demand Curve
The initial equilibrium price is P 0 and the initial equilibrium output is Q 0.
(a) If the AD curve shifts to the right to D 2 then the output changes in output, which is shown in the diagram below:
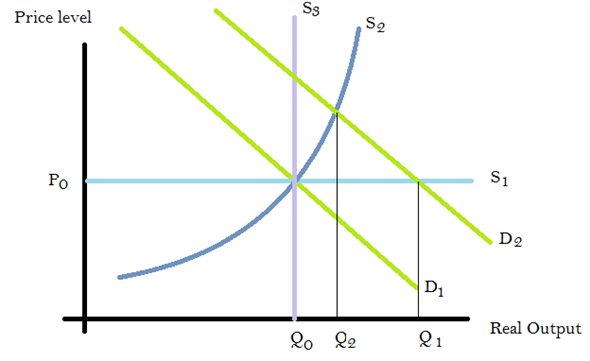 Increase in output due to the shift of AD curve
In the diagram, if S1 was the AS curve, then the increase in output would be Q 0 Q1 . If S2 was the AS curve, the increase in output would be Q 0 Q 2. Finally if S 3 was the AS curve, then there would be no change in output. So, among these Q 0 Q1 is the largest amounts. Therefore, the biggest increase in output occurs for the horizontal AS curve.
(b) If there is a shift in AD to the right to D 2 from D 1 , the resulting equilibrium price will be determined by whether S1 or S2 or S 3 is the aggregate supply curve.
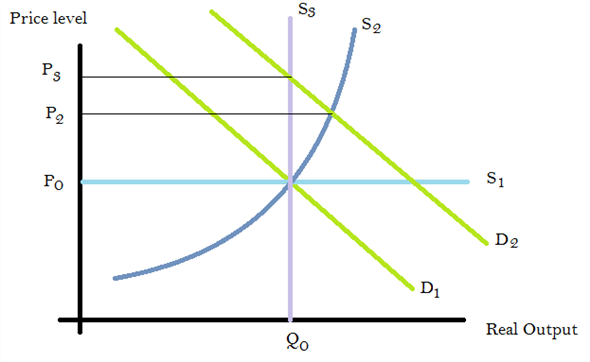
 Increase in Prices due to the shift of AD curve
In the diagram, if S1 is the AS curve, then there is no change in prices. If S2 is the AS curve, then the magnitude of the rise in price is given by the distance P 0 P 2. Finally, if S 3 is the AS curve, then the price rises to P 3 and the magnitude of the jump in prices is P 0 P 3. The distance P 0 P 3 is the largest among these. Therefore, the largest jump in prices occurs if S 3 is the aggregate supply curve. In other words, a vertical AS curve leads to the largest jump in prices.
Thus, when the AS curve is horizontal, i.e., S1 , then a shift in AS results in no change in prices. But in the other two cases price rises.
(c) When AD curve shifts to right, then the change in inflation is reflected by the following diagram:
 Least Inflation due to the shift of AD curve
In the graph above, if S1 is the AS curve, after the AD curve shifts from D 1 to D 2 , then the equilibrium price still remains at P 0. Therefore, the least inflation occurs when the AS curve is horizontal.
Conventional Demand Curve The initial equilibrium price is P 0 and the initial equilibrium output is Q 0.
(a) If the AD curve shifts to the right to D 2 then the output changes in output, which is shown in the diagram below:
Increase in output due to the shift of AD curve In the diagram, if S1 was the AS curve, then the increase in output would be Q 0 Q1 . If S2 was the AS curve, the increase in output would be Q 0 Q 2. Finally if S 3 was the AS curve, then there would be no change in output. So, among these Q 0 Q1 is the largest amounts. Therefore, the biggest increase in output occurs for the horizontal AS curve.
(b) If there is a shift in AD to the right to D 2 from D 1 , the resulting equilibrium price will be determined by whether S1 or S2 or S 3 is the aggregate supply curve.
Increase in Prices due to the shift of AD curve In the diagram, if S1 is the AS curve, then there is no change in prices. If S2 is the AS curve, then the magnitude of the rise in price is given by the distance P 0 P 2. Finally, if S 3 is the AS curve, then the price rises to P 3 and the magnitude of the jump in prices is P 0 P 3. The distance P 0 P 3 is the largest among these. Therefore, the largest jump in prices occurs if S 3 is the aggregate supply curve. In other words, a vertical AS curve leads to the largest jump in prices.
Thus, when the AS curve is horizontal, i.e., S1 , then a shift in AS results in no change in prices. But in the other two cases price rises.
(c) When AD curve shifts to right, then the change in inflation is reflected by the following diagram:
Least Inflation due to the shift of AD curve In the graph above, if S1 is the AS curve, after the AD curve shifts from D 1 to D 2 , then the equilibrium price still remains at P 0. Therefore, the least inflation occurs when the AS curve is horizontal.
3
If all wages and prices fell by 20 percent, would you be better or worse off? Could you buy more goods?
If all wages fell by 20 percent, then the purchasing power of wage earners goes down by 20 percent. On the other hand, if prices fell by 20 percent, purchasing power increases by that amount. Therefore, overall there is no change. Thus, an individual would neither be better off neither worse off. They would be able to buy exactly the same bundle of goods as before. Their situation would essentially be unchanged.
4
The following schedule provides information with which to draw both an aggregate demand curve and an aggregate supply curve. Both curves are assumed to be straight lines.
( a )At what price level does equilibrium occur?
( b )What curve would have shifted if a new equilibrium were to occur at an output level of 700 and a price level of $700?
( c )What curve would have shifted if a new equilibrium were to occur at an output level of 700 and a price level of $500?
( d )What curve would have shifted if a new equilibrium were to occur at an output level of 700 and a price level of $300?
( e )Compared to the initial equilibrium ( a ), how have the outcomes in ( b ), ( c ), and ( d ) changed price levels or output?
( a )At what price level does equilibrium occur?( b )What curve would have shifted if a new equilibrium were to occur at an output level of 700 and a price level of $700?
( c )What curve would have shifted if a new equilibrium were to occur at an output level of 700 and a price level of $500?
( d )What curve would have shifted if a new equilibrium were to occur at an output level of 700 and a price level of $300?
( e )Compared to the initial equilibrium ( a ), how have the outcomes in ( b ), ( c ), and ( d ) changed price levels or output?
Unlock Deck
Unlock for access to all 15 flashcards in this deck.
Unlock Deck
k this deck
5
What would a horizontal aggregate supply curve imply about producer behavior? How about a vertical AS curve?
Unlock Deck
Unlock for access to all 15 flashcards in this deck.
Unlock Deck
k this deck
6
Graph the situation described in the Headline on p. 241.
Unlock Deck
Unlock for access to all 15 flashcards in this deck.
Unlock Deck
k this deck
7
If equilibrium is compatible with both buyer s' and sellers ' intentions, how can it be undesirable?
Unlock Deck
Unlock for access to all 15 flashcards in this deck.
Unlock Deck
k this deck
8
From 1996 tO2 000, the U.S. stock market more than doubled in value. How might this have affected aggregate demand? What happens to aggregate demand when the stock market plunges?
Unlock Deck
Unlock for access to all 15 flashcards in this deck.
Unlock Deck
k this deck
9
President George H. Bush maintained a handsoff policy during the 1990-91 recession. How did he expect the economy to recover on its own?
Unlock Deck
Unlock for access to all 15 flashcards in this deck.
Unlock Deck
k this deck
10
Why did President Obama assert that government intervenion was needed to get the economy out of the 2008-09 recession? Could the economy have recovered on its own?
Unlock Deck
Unlock for access to all 15 flashcards in this deck.
Unlock Deck
k this deck
11
Illustrate these events with AS or AD shifts:
Unlock Deck
Unlock for access to all 15 flashcards in this deck.
Unlock Deck
k this deck
12
If the price level were below P E in Figure 11.5, what macro problems would we observe? Why is P E considered an equilibrium?
Unlock Deck
Unlock for access to all 15 flashcards in this deck.
Unlock Deck
k this deck
13
Based on the Headline on p. 241,
( a )Illustrate the AS shift that occurs.
( b )Identify the old ( E 0 ) and new ( E 1 ) macro equilibrium.
( c )What macro ailments result?
( d )How can the economy stay healthy in this case?
( a )Illustrate the AS shift that occurs.
( b )Identify the old ( E 0 ) and new ( E 1 ) macro equilibrium.
( c )What macro ailments result?
( d )How can the economy stay healthy in this case?
Unlock Deck
Unlock for access to all 15 flashcards in this deck.
Unlock Deck
k this deck
14
What factors might cause a rightward shift of the aggregate demand curve? What might induce a rightward shift of aggregate supply?
Unlock Deck
Unlock for access to all 15 flashcards in this deck.
Unlock Deck
k this deck
15
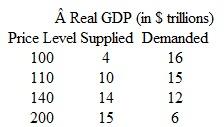
Graph the following aggregate supply and demand curves (be sure to draw to scale).
( a )What is the equilibrium price level?
( b )What is the equilibrium output?
( c )If the quantity of output demanded at every price level increases by $2 trillion, what happens to equilibrium output and prices? Graph your answer.
( a )What is the equilibrium price level?( b )What is the equilibrium output?
( c )If the quantity of output demanded at every price level increases by $2 trillion, what happens to equilibrium output and prices? Graph your answer.
Unlock Deck
Unlock for access to all 15 flashcards in this deck.
Unlock Deck
k this deck
Unlock Deck
Unlock for access to all 15 flashcards in this deck.


