Deck 15: The Genetic Basics of Complex Inheritance
Full screen (f)
Question
Question
Question
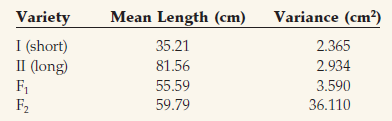
The mean stem length and variance of stem length in two highly homozygous varieties of roses (I and II) and their
 progeny are shown below. Calculate the broad-sense heritability.
progeny are shown below. Calculate the broad-sense heritability. Question
Question
Question
Question
Question
Question
Two highly inbred strains of mice are crossed. The
 generation has a mean tail length of 4.3 cm and a standard deviation of 1.3 cm. The
 generation has a mean tail length of 4.3 cm and a standard deviation of 3.5 cm. What are the environmental variance, the genetic variance, and the broadsense heritability of tail length in this population?
generation has a mean tail length of 4.3 cm and a standard deviation of 1.3 cm. The generation has a mean tail length of 4.3 cm and a standard deviation of 3.5 cm. What are the environmental variance, the genetic variance, and the broadsense heritability of tail length in this population? Question
Question
Question
Question
Question
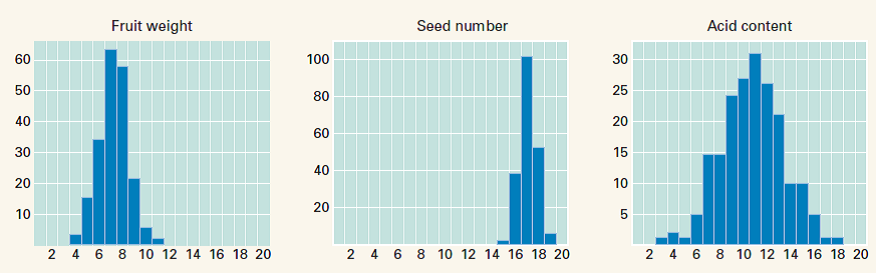
You are studying fruit weight, seed number, and acid content in tomatoes. From 100 greenhouse plants, you sample a single fruit and measure it for the three traits, obtaining the following data:
(a) Can you infer which of these traits likely has the greatest genetic variance? Explain your reasoning.
(b) Can you infer which of these traits has the greatest heritability? Explain your reasoning.
(a) Can you infer which of these traits likely has the greatest genetic variance? Explain your reasoning.
(b) Can you infer which of these traits has the greatest heritability? Explain your reasoning.
Question
Question
Estimate the minimum number of genes affecting fruit weight in a population of the domestic tomato produced by crossing two inbred strains. Measured as the logarithm of fruit weight in grams, the inbred lines have average fruit weights of 0.137 and 1.689. The F1 generation has a variance of 0.0144, and the
 generation has a variance of 0.0570.
generation has a variance of 0.0570. Question
Question
Question
Question
In humans, the estimated values of broad-sense heritability for some traits are: maximum heart rate
 systolic blood pressure
 . For which of these traits is the phenotypic variance most affected by genetic differences among individuals?
systolic blood pressure . For which of these traits is the phenotypic variance most affected by genetic differences among individuals? Question
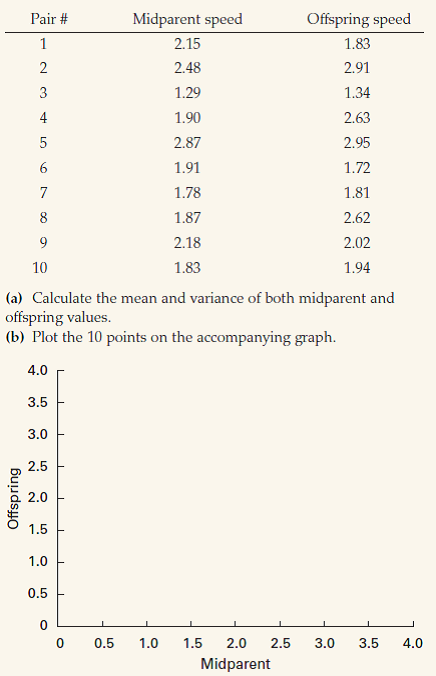
You are studying sprint speed in lizards. You raise two generations of lizards in the laboratory, measuring speed on a track at age 1 year in both parents and offspring. The resulting data consist of 10 pairs of midparent-offspring values. The midparent speed is the average of the parental speeds.
(c) From the scatterplot, would you guess that the trait of sprint speed has high or low heritability in these lizards?
(c) From the scatterplot, would you guess that the trait of sprint speed has high or low heritability in these lizards?

Unlock Deck
Sign up to unlock the cards in this deck!
Unlock Deck
Unlock Deck
1/21
Play
Full screen (f)
Deck 15: The Genetic Basics of Complex Inheritance
1
The following questions pertain to a normal distribution.
(a) What term applies to the value along the x -axis that corresponds to the peak of the distribution?
(b) If two normal distributions have the same mean but different variances, which is the broader?
(c) What proportion of the population is expected to lie within one standard deviation of the mean?
(d) What proportion of the population is expected to lie within two standard deviations of the mean?
Normal distribution is part of the set statistical methods that are used in genetics.
(a)The peak of a distribution graphed on a x -axis is referred to as the mean.
(b)If one has two different normal distributions that share the same mean but have differing variances have different widths. The distribution with the larger variance will be broader.
(c)One standard deviation of the mean is expected to contain a proportion of the population. The percentage of the proportion stands at about 68%.
(d)Two standard deviations of the mean are expected to contain a proportion of the population. Two standard deviations would contain 95% of the population.
2
A mouse population has an average weight gain between ages 3 and 6 weeks of 12 g, and the narrow-sense heritability of the weight gain between 3 and 6 weeks is 20 percent.
(a) What average weight gain would be expected among the offspring of parents whose average weight gain was 16 g?
(b) What average weight gain would be expected among the offspring of parents whose average weight gain was 8 g?
(a) What average weight gain would be expected among the offspring of parents whose average weight gain was 16 g?
(b) What average weight gain would be expected among the offspring of parents whose average weight gain was 8 g?
A sample population of mice saw their average weight gain increase by 12 grams between the ages of 3 to 6 weeks. The mice have a narrow-sense heritability in the time interval of 20 percent.
(a)To find the average weight gain for mice between 3 and 6 weeks if there parents had a 16 gram average weight gain is found by adding 12 grams to the difference of the parent average and the population average multiplied by the narrow-sense heritability.
 The expected weight gain average would be 12.8 grams.
(b)To find the average weight gain for mice between 3 and 6 weeks if there parents had a 8 gram average weight gain is found by adding 12 grams to the difference of the parent average and the population average multiplied by the narrow-sense heritability.
 The expected weight gain average would be 11.2 grams.
(a)To find the average weight gain for mice between 3 and 6 weeks if there parents had a 16 gram average weight gain is found by adding 12 grams to the difference of the parent average and the population average multiplied by the narrow-sense heritability.
The expected weight gain average would be 12.8 grams.(b)To find the average weight gain for mice between 3 and 6 weeks if there parents had a 8 gram average weight gain is found by adding 12 grams to the difference of the parent average and the population average multiplied by the narrow-sense heritability.
The expected weight gain average would be 11.2 grams. 3
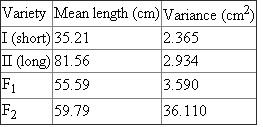
The mean stem length and variance of stem length in two highly homozygous varieties of roses (I and II) and their
progeny are shown below. Calculate the broad-sense heritability.
progeny are shown below. Calculate the broad-sense heritability.Observe the chart below showing the mean stem length of roses and their progeny.
 Broad sense heritability is found using the equation below.
 Where
Where
 is the genotype and
 is the environmental affects. The parents are highly homozygous, so are going to produce offspring that are heterozygous, since they are different. The F 1 is the first generation and F 2 is the second. For the first generation, the genotype is the same with the only variance being environment
 . The second generation there is a difference in the genotypes that is additive with the environmental phenotype. First to find
 subtract
 from
from
 .
.
 is the variance for the second generation and
 is the variation for the first generation.
 Solve,
 The
The
 is 32.520. Now solve the broad-sense heritability by substituting 32.520 for
 and
and
 is 3.590.
 Solve,
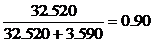 The broad sense heritability is 0.90, which shows that stem length is highly aligned in the genotype and less with the environment.
Broad sense heritability is found using the equation below. Where is the genotype and is the environmental affects. The parents are highly homozygous, so are going to produce offspring that are heterozygous, since they are different. The F 1 is the first generation and F 2 is the second. For the first generation, the genotype is the same with the only variance being environment . The second generation there is a difference in the genotypes that is additive with the environmental phenotype. First to find subtract from . is the variance for the second generation and is the variation for the first generation. Solve, The is 32.520. Now solve the broad-sense heritability by substituting 32.520 for and is 3.590. Solve, The broad sense heritability is 0.90, which shows that stem length is highly aligned in the genotype and less with the environment. 4
To estimate the heritability of maze-learning ability in rats, a selection experiment was carried out. From a population in which the average number of trials necessary to learn the maze was 10.8, with a variance of 4.0, animals were selected that managed to learn the maze in an average of 5.8 trials. Their offspring required an average of 8.8 trials to learn the maze. What is the estimated narrow-sense heritability of maze-learning ability in this population?
Unlock Deck
Unlock for access to all 21 flashcards in this deck.
Unlock Deck
k this deck
5
Two varieties of corn, A and B, are field-tested in Indiana and North Carolina. Strain A is more productive in Indiana, but strain B is more productive in North Carolina. What phenomenon in quantitative genetics does this example illustrate?
Unlock Deck
Unlock for access to all 21 flashcards in this deck.
Unlock Deck
k this deck
6
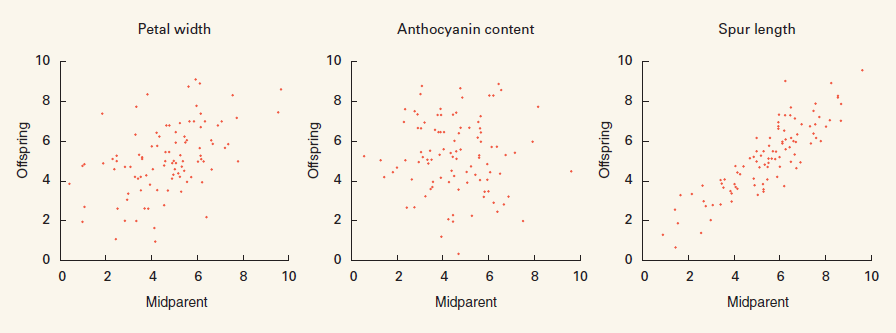
Below are three graphs showing scatterplots of offspring on midparent values for three different traits in the Colorado Blue Columbine ( Aquilegia caerulea ), the official state flower of Colorado. The midparent value is the average of the parental values. A horticulturalist wishes to increase the value of all these traits because she believes that the resulting flowers would be very successful commercially. However, she needs to produce some impressive flowers quickly if her greenhouse business is not going to fail. As a geneticist, which of these traits would you advise her to concentrate on, and why?
Unlock Deck
Unlock for access to all 21 flashcards in this deck.
Unlock Deck
k this deck
7
Some estimates of broad-sense heritabilities of human traits are 0.85 for adult height, 0.62 for body weight, 0.57 for systolic blood pressure, 0.44 for diastolic blood pressure, 0.50 for twinning, and 0.1 to 0.2 for overall fertility. Which of these characteristics is most likely to "run in families"? If one of your parents and one of your grandparents has high blood pressure, should you be concerned about the likelihood of you having the same problem?
Unlock Deck
Unlock for access to all 21 flashcards in this deck.
Unlock Deck
k this deck
8
For a phenotype determined by a single, completely penetrant recessive allele at frequency q in a random-mating population, it can be shown that the narrow-sense heritability is2 q /(1 + q ).
(a) Calculate the narrow-sense heritability for q= 1.0, 0.5, 0.1, 0.05, 0.01, 0.005, and 0.001.
(b) Note that the narrow-sense heritability goes to 0 as q goes to 0, yet the phenotype is completely determined by heredity. How can this be explained?
(c) From the scatterplot, would you guess that the trait of sprint speed has high or low heritability in these lizards?
Unlock Deck
Unlock for access to all 21 flashcards in this deck.
Unlock Deck
k this deck
9
Two highly inbred strains of mice are crossed. The
generation has a mean tail length of 4.3 cm and a standard deviation of 1.3 cm. The
generation has a mean tail length of 4.3 cm and a standard deviation of 3.5 cm. What are the environmental variance, the genetic variance, and the broadsense heritability of tail length in this population?
generation has a mean tail length of 4.3 cm and a standard deviation of 1.3 cm. The generation has a mean tail length of 4.3 cm and a standard deviation of 3.5 cm. What are the environmental variance, the genetic variance, and the broadsense heritability of tail length in this population? Unlock Deck
Unlock for access to all 21 flashcards in this deck.
Unlock Deck
k this deck
10
For the difference between the domestic tomato, Solanum esculentum , and its wild South American relative, Solanum chmielewskii , the environmental variance accounts for 13 percent of the total phenotypic variance of fruit weight, for 9 percent of the total variance of soluble-solid content, and for 11 percent of the total variance in acidity. What are the broad-sense heritabilities of these traits?
Unlock Deck
Unlock for access to all 21 flashcards in this deck.
Unlock Deck
k this deck
11
Two homozygous genotypes of Drosophila differ in the number of abdominal bristles. In genotype AA , the mean bristle number is 20 with a standard deviation of 2. In genotype aa , the mean bristle number is 23 with a standard deviation of 3. Both distributions conform to the normal distribution, in which the proportions of the population with a phenotype within an interval defined by the mean ± 1, ± 1.5, ±2, and ± 3 standard deviations are 68, 87, 95, and 99.7 percent, respectively.
(a) In genotype AA , what is the proportion of flies with a bristle number between 20 and 23?
(b) In genotype aa , what is the proportion of flies with a bristle number between 20 and 23?
(c) What proportion of AA flies have a bristle number greater than the mean of aa flies?
(d) What proportion of aa flies have a bristle number greater than the mean of AA flies?
Unlock Deck
Unlock for access to all 21 flashcards in this deck.
Unlock Deck
k this deck
12
The narrow-sense heritability of withers height in a population of quarterhorses is 35 percent. (Withers height is the height at the highest point of the back, between the shoulder blades.) The average withers height in the population is 19 hands. (A "hand" is a traditional measure equal to the breadth of the human hand, now taken to equal 4 inches.) From this population, studs and mares with an average withers height of 16 hands are selected and mated at random. What is the expected withers height of the progeny? How does the value of the narrow-sense heritability change if withers height is measured in meters rather than hands?
Unlock Deck
Unlock for access to all 21 flashcards in this deck.
Unlock Deck
k this deck
13
Consider a complex trait in which the phenotypic values in a large population are distributed approximately according to a normal distribution with mean 100 and standard deviation 15. What proportion of the population has a phenotypic value above 130? Below 85? Above 85?
Unlock Deck
Unlock for access to all 21 flashcards in this deck.
Unlock Deck
k this deck
14
You are studying fruit weight, seed number, and acid content in tomatoes. From 100 greenhouse plants, you sample a single fruit and measure it for the three traits, obtaining the following data:
(a) Can you infer which of these traits likely has the greatest genetic variance? Explain your reasoning.
(b) Can you infer which of these traits has the greatest heritability? Explain your reasoning.
(a) Can you infer which of these traits likely has the greatest genetic variance? Explain your reasoning.
(b) Can you infer which of these traits has the greatest heritability? Explain your reasoning.
Unlock Deck
Unlock for access to all 21 flashcards in this deck.
Unlock Deck
k this deck
15
In an experimental population of the flour beetle Tribolium castaneum , the pupal weight is distributed normally with a mean of 2.0 mg and a standard deviation of 0.2 mg. What proportion of the population is expected to have a pupal weight between 1.8 and 2.2 mg? Between 1.6 and 2.4 mg? Would you expect to find an occasional pupa weighing 3.0 mg or more? Explain your answer.
Unlock Deck
Unlock for access to all 21 flashcards in this deck.
Unlock Deck
k this deck
16
Estimate the minimum number of genes affecting fruit weight in a population of the domestic tomato produced by crossing two inbred strains. Measured as the logarithm of fruit weight in grams, the inbred lines have average fruit weights of 0.137 and 1.689. The F1 generation has a variance of 0.0144, and the
generation has a variance of 0.0570.
generation has a variance of 0.0570. Unlock Deck
Unlock for access to all 21 flashcards in this deck.
Unlock Deck
k this deck
17
In human beings, the narrow-sense heritability of the total fingerprint ridge count is 90 percent. On the basis of this value, what is the estimated correlation coefficient between first cousins in the total fingerprint ridge count?
Unlock Deck
Unlock for access to all 21 flashcards in this deck.
Unlock Deck
k this deck
18
Maternal effects are nongenetic influences on offspring phenotype that derive from the phenotype of the mother. For example, in many mammals, larger mothers have larger offspring, in part because of a maternal effect on birth weight. What result would a maternal effect have on the correlation in birth weight between mothers and their offspring compared with that between fathers and their offspring? How would such a maternal effect influence the estimate of narrow-sense heritability?
Unlock Deck
Unlock for access to all 21 flashcards in this deck.
Unlock Deck
k this deck
19
If the correlation coefficient of a trait between first cousins is 0.09, what is the estimated narrow-sense heritability of the trait?
Unlock Deck
Unlock for access to all 21 flashcards in this deck.
Unlock Deck
k this deck
20
In humans, the estimated values of broad-sense heritability for some traits are: maximum heart rate
systolic blood pressure
. For which of these traits is the phenotypic variance most affected by genetic differences among individuals?
systolic blood pressure . For which of these traits is the phenotypic variance most affected by genetic differences among individuals? Unlock Deck
Unlock for access to all 21 flashcards in this deck.
Unlock Deck
k this deck
21
You are studying sprint speed in lizards. You raise two generations of lizards in the laboratory, measuring speed on a track at age 1 year in both parents and offspring. The resulting data consist of 10 pairs of midparent-offspring values. The midparent speed is the average of the parental speeds.
(c) From the scatterplot, would you guess that the trait of sprint speed has high or low heritability in these lizards?
(c) From the scatterplot, would you guess that the trait of sprint speed has high or low heritability in these lizards?
Unlock Deck
Unlock for access to all 21 flashcards in this deck.
Unlock Deck
k this deck
Unlock Deck
Unlock for access to all 21 flashcards in this deck.


