Deck 26: Monetary Policy
Full screen (f)
Question
Question
Question
Question
MONETARY POLICY DURING THE GREAT DEPRESSION
Applicable Concept: Keynesians versus monetarists
Monetarists and Keynesians still debate the causes of the Great Depression. Monetarists Milton Friedman and Anna Schwartz, in their book A Monetary History of the United States , argued that the Great Depression was caused by the decline in the money supply, as shown in Exhibit 9(a).
During the 1920s, the money supply expanded steadily, and prices were generally stable. In response to the great stock market crash of 1929, bank failures, falling real GDP, and rising unemployment, the Fed changed its monetary policy. Through the Great Depression years from 1929 to 1933, M1 declined by 27 percent. Assuming velocity is relatively constant, how will a sharp reduction in the quantity of money in circulation affect the economy? Monetarists predict a reduction in prices, output, and employment. Between 1929 and 1933, the price level declined by 24 percent. In addition to deflation, real GDP was 27 percent lower in 1933 than in 1929. Unemployment rose from 3.2 percent in 1929 to 24.9 percent in 1933. Friedman and Schwartz argued that the ineptness of the Fed's monetary policy during the Great Depression caused the trough in the business cycle to be more severe and sustained.
The Great Depression was indeed not the Fed's finest hour. What should the Fed have done? Friedman and Schwartz argued that the Fed should have used open market operations to increase the money supply. Thus, they concluded that the Fed was to blame for not pursuing an expansionary policy, which would have reduced the severity and duration of the contraction. As shown in part (b), this was not the case for the Great Recession of 2007-2009. From the beginning, the Fed followed an expansionary policy and sharply increased the money supply.
Finally, although the emphasis here is monetary policy, parts (c) and (d) contrast fiscal policy during the two periods using the federal deficit as a percentage of GDP. During the Great Depression, there was a slight budget surplus until 1931 when the budget turned into a slight budget deficit before reaching a deficit of 5.9 percent of GDP in 1934. In contrast, fiscal policy was more expansionary by running deficits from the beginning of the recession in 2007 to 10 percent of GDP in 2009.
Explain why monetarists believe the Fed should have expanded the money supply during the Great Depression.
Question
Question
Question
Question
MONETARY POLICY DURING THE GREAT DEPRESSION
Applicable Concept: Keynesians versus monetarists
Monetarists and Keynesians still debate the causes of the Great Depression. Monetarists Milton Friedman and Anna Schwartz, in their book A Monetary History of the United States , argued that the Great Depression was caused by the decline in the money supply, as shown in Exhibit 9(a).
During the 1920s, the money supply expanded steadily, and prices were generally stable. In response to the great stock market crash of 1929, bank failures, falling real GDP, and rising unemployment, the Fed changed its monetary policy. Through the Great Depression years from 1929 to 1933, M1 declined by 27 percent. Assuming velocity is relatively constant, how will a sharp reduction in the quantity of money in circulation affect the economy? Monetarists predict a reduction in prices, output, and employment. Between 1929 and 1933, the price level declined by 24 percent. In addition to deflation, real GDP was 27 percent lower in 1933 than in 1929. Unemployment rose from 3.2 percent in 1929 to 24.9 percent in 1933. Friedman and Schwartz argued that the ineptness of the Fed's monetary policy during the Great Depression caused the trough in the business cycle to be more severe and sustained.
The Great Depression was indeed not the Fed's finest hour. What should the Fed have done? Friedman and Schwartz argued that the Fed should have used open market operations to increase the money supply. Thus, they concluded that the Fed was to blame for not pursuing an expansionary policy, which would have reduced the severity and duration of the contraction. As shown in part (b), this was not the case for the Great Recession of 2007-2009. From the beginning, the Fed followed an expansionary policy and sharply increased the money supply.
Finally, although the emphasis here is monetary policy, parts (c) and (d) contrast fiscal policy during the two periods using the federal deficit as a percentage of GDP. During the Great Depression, there was a slight budget surplus until 1931 when the budget turned into a slight budget deficit before reaching a deficit of 5.9 percent of GDP in 1934. In contrast, fiscal policy was more expansionary by running deficits from the beginning of the recession in 2007 to 10 percent of GDP in 2009.
The Keynesians challenge the Friedman-Schwartz monetarists' monetary policy cure for the Great Depression. Use the AD-AS model to explain the Keynesian view. (Hint: Your answer must include the investment demand curve.)
Question
Question
Question
Question
Question
Question
Question
Question
Starting from an equilibrium at E 1 in Exhibit 12, a rightward shift of the money supply curve from MS 1 to MS 2 would cause an excess
A) demand for money, leading people to sell bonds.
B) supply of money, leading people to buy bonds.
C) supply of money, leading people to sell bonds.
D) demand for money, leading people to buy bonds.
EXHIBIT 12 Money Market Demand and Supply Curves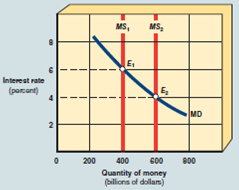
A) demand for money, leading people to sell bonds.
B) supply of money, leading people to buy bonds.
C) supply of money, leading people to sell bonds.
D) demand for money, leading people to buy bonds.
EXHIBIT 12 Money Market Demand and Supply Curves
Question
Question
Question
Question
As shown in Part (a) of Exhibit A-3, assume classical nonintervention policy is adopted. Which of the following would cause the economy to self-correct?
A) Competition among firms for workers increases the nominal wage and SRAS shifts rightward.
B) Long-run equilibrium will be established at Y 1 and P 2.
C) Long-run equilibrium will be established at Y 1 and P 3.
D) Competition among unemployed workers decreases nominal wages and SRAS shifts rightward.
EXHIBIT A-3 Macro AD/AS Models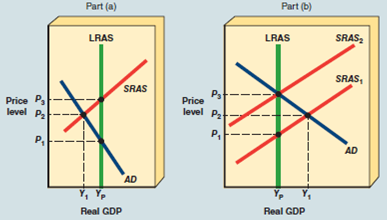
Question
Question
Question
Question
Using the demand and supply schedule for money shown in Exhibit 10, do the following:
a. Graph the demand for money and the supply of money curves.
b. Determine the equilibrium interest rate.
c. Suppose the Fed increases the money supply by $100 billion. Show the effect in your graph, and describe the money market adjustment process to a new equilibrium rate. What is the new equilibrium rate of interest?
EXHIBIT 10 Money Market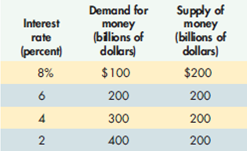
Question
Question
Question
Question
In Exhibit 13, a move from MS 1 to MS 2
A) increases the money supply, causing the interest rate to rise from i 2 to i 1.
EXHIBIT 13 Money, Investment, and Product Markets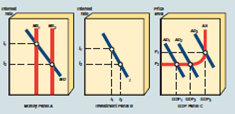
B) increases the money supply, causing the interest rate to fall from i 1 to i 2.
C) decreases the money supply, causing the interest rate to rise from i 2 to i 1.
D) decreases the money supply, causing the interest rate to fall from i 1 to i 2.
E) has no effect on the money supply or the interest rate.
Question
Question
Question
Question
Question
Question
Question
Question
Question
Question
In Part (a) of Exhibit A-4, the economy is initially in short-run equilibrium at real GDP level Y 1 and price level P 2. If the government decides to intervene, it would most likely
EXHIBIT A-4 Macro AD/AS Models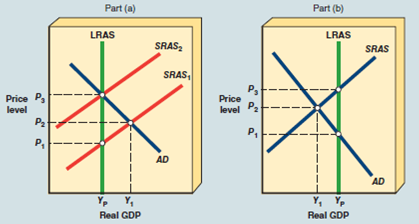
A) decrease taxes.
B) increase transfer payments.
C) increase the level of government spending for goods and services.
D) decrease the level of government spending for goods and services.
EXHIBIT A-4 Macro AD/AS Models
A) decrease taxes.
B) increase transfer payments.
C) increase the level of government spending for goods and services.
D) decrease the level of government spending for goods and services.
Question
Question
Question
Question
Question
Question
Question
Question
Question
Question
Question
Question
DID THE FED CAUSE THE GREAT RECESSION?
Applicable Concept: monetarism
The story of the worst collapse of the housing market and the most serious financial crisis since the Great Depression is filled with villains and no action hero to sweep down from the sky and save the day. It is an Alice in Wonderland story with plenty of blame to go around: homeowners who bought a Trojan horse, rampant speculation, predatory lenders, slick Wall Street operators, greedy CEOs, lax regulators, and debatable Fed policy. Perhaps a phrase by Alan Greenspan, former Fed chairman, called "The Maestro," best described the bust of the housing market bubble when he said, "How do we know when irrational exuberance has unduly escalated asset values?"
The stage was set for the housing crisis by the Fed's response to the recession of 2001. The annual change in the money supply jumped sharply upward from -3.1 percent in 2000 to an 8.7 percent increase in 2001. And, as shown in the above exhibit, the Fed decreased interest rates sharply after 2001 and kept them historically low in order to boost aggregate demand and prevent another recession. Then in 2004, Greenspan addressed the Credit Union Association and said, "American consumers might benefit if lenders provided greater mortgage product alternatives to the traditional fixed rate mortgage." And as if following the Fed chairman's advice, adjustable-rate mortgages (ARMs) became the loan of choice for subprime mortgage loan borrowers who had poor or less than ideal credit scores. Mailboxes were stuffed with offers to borrow 100 percent or more of a home's value with zero down. Television shows advertised the idea that anyone could make it rich in real estate, and housing became a speculative game. Payments and "teaser" interest rates were held artificially low for the first few years of the loan and then would jump sharply upward. Forget worrying about not affording the home, your income would not be checked, following a "no document" lending practice. In fact, some loans were made to people who were no longer living. Thus, using risky ARMs, banks lent billions of dollars to home buyers who could not pay the bank when the payments and interest rates rose.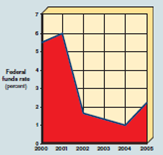
SOURCE : FRB Federal Open Market Committee, http://www.federalreserve.gov/fomc/fundsrate.htm.
Faced with accumulating portfolios of risky debt, banks and mortgage companies sold these risky mortgages to New York investment firms such as Bear Stearns (acquired by JPMorgan Chase with financial backing from the Fed) and Merrill Lynch, who pooled them with other securities. These packages, often called collateralized debt obligations, or CDOs, were sold to customers around the world-a process called "securitization." And this securitization occurred with the blessing of ratings agencies such as Standard Poor's, which actually did not know how to evaluate the risk of these securities. With each of these transactions, large fees were collected, and in short, consummation of the deal was the criterion and not validity of the assessment of risk.
Expansion of the housing market bubble was based on an assumption by all the players that the party would never end and real estate prices would always go up. However, beginning in the summer of 2005, subprime foreclosures rose and home prices dropped as people's payments rose under their ARMs. Also, once the value of homes fell below the loan value, people could not refinance loans to get lower payments. When people walked away from their mortgages, Wall Street and foreign investors were stuck with bad loans in their CDOs to write off, CEOs were fired, and many real estate executives were indicted for mortgage fraud. As a result, lenders greatly tightened their lending standards to avoid further risky loans, and a credit crunch made home financing difficult to obtain.
In 2008, the Fed announced that it would allow Wall Street investment firms to receive emergency loans and exchange risky investments for Treasury securities. Also, the Housing and Economic Recovery Act of 2008 was passed that allowed some borrowers to refinance their mortgages with new fixed-rate loans backed by a federal guarantee, and it provided grants for state and local governments in the hardest-hit communities to buy foreclosed property. It also included a tax credit for first-time home buyers who buy housing that is unoccupied. And the Treasury Department was given authority to bail out or take over Fannie Mae and Freddie Mac, the troubled government-created firms that fund the vast majority of mortgage loans in the United States.
In addition, a massive $700 billion bailout plan was enacted in 2008 that gave the Treasury the authority TARP (Troubled Assets Recovery Program) to buy and resell bad mortgage debt from financial institutions. But TARP changed its original purpose because it was very difficult to determine the price that the government should pay for the risky assets. Consequently, TARP changed its plan and spent over half of its funds to invest government capital into banks by buying preferred stock with a 5 percent rate of return, which is the equivalent of a loan to the bank. In 2010 Congress passed Dodd-Frank, which is a controversial and extensive act intended to increase accountability and regulation of financial institutions. This act gives more oversight authority to the Fed over products that financial institutions provide. In 2013 the Volcker Rule, named after the former Federal Reserve chairman, was approved. This rule limits banks investment in complex financial instruments. And in 2014, Bank of America admitted that it took part in faulty mortgage-backed securities practices and agreed to a $16.5 billion settlement with the U.S. government.
In support of the Fed's monetary policy prior to the deflation of the home prices bubble, one can argue that the reality is that increasing the money supply and low-interest rates were required to sustain expansion. Based on the monetarist school of thought, criticize the Fed's policy.

Unlock Deck
Sign up to unlock the cards in this deck!
Unlock Deck
Unlock Deck
1/50
Play
Full screen (f)
Deck 26: Monetary Policy
1
Keynes gave which of the following as a motive for people holding money?
A) Transactions demand.
B) Speculative demand.
C) Precautionary demand.
D) All of the answers above are correct.
A) Transactions demand.
B) Speculative demand.
C) Precautionary demand.
D) All of the answers above are correct.
Keynesian was an economist who defined a new school of thought known as Keynesian school of thought of macroeconomics. According to this school of thought, prices and wages are not fully flexible as thought by the classical economists.
The Keynesian put more weight on the role of fiscal policy during the time of depression to ratify the situation. The demand for money can be defined as the money demand which is a negative function of prevailing interest rate.
The Keynesian economists believed that money is demanded for the three purposes which are as follows:
Transaction demand: Money is demanded by people because people needed it for day to day transaction purposes.
Speculative demand: Money is also demanded for the speculative motives as money can be used in future to buy bonds and stocks.
Precautionary motive: Money is demanded for the situations of emergency. There can be need of money for precautionary motives.
As the money demand under Keynes depends on all the factors defined under options (a), (b) and (c) that are incorrect.
According to classical money is demanded only for transactions therefore, the money demand curve was horizontal in such cases. But in Keynes money is demanded for three purposes. So, due to speculative motive of money it is negatively related to interest rate.
Therefore, option is the correct option.
The Keynesian put more weight on the role of fiscal policy during the time of depression to ratify the situation. The demand for money can be defined as the money demand which is a negative function of prevailing interest rate.
The Keynesian economists believed that money is demanded for the three purposes which are as follows:
Transaction demand: Money is demanded by people because people needed it for day to day transaction purposes.
Speculative demand: Money is also demanded for the speculative motives as money can be used in future to buy bonds and stocks.
Precautionary motive: Money is demanded for the situations of emergency. There can be need of money for precautionary motives.
As the money demand under Keynes depends on all the factors defined under options (a), (b) and (c) that are incorrect.
According to classical money is demanded only for transactions therefore, the money demand curve was horizontal in such cases. But in Keynes money is demanded for three purposes. So, due to speculative motive of money it is negatively related to interest rate.
Therefore, option
is the correct option. 2
Which of the following is not an issue in the Keynesian-monetarist debate?
A) The importance of monetary vs. fiscal policy.
B) The importance of a change in the money supply.
C) The importance of a crowding-out effect.
D) All of the issues above are part of the debate.
A) The importance of monetary vs. fiscal policy.
B) The importance of a change in the money supply.
C) The importance of a crowding-out effect.
D) All of the issues above are part of the debate.
A decrease in the money supply causes money shortage in the market. This makes the people to sell the bonds for getting extra cash.
So, there will be an excess quantity of money demanded.
Hence the correct answer is 'A'.
So, there will be an excess quantity of money demanded.
Hence the correct answer is 'A'.
3
Assume the economy is experiencing a recessionary gap. Classical economists would support which of the following policies?
A) Contractionary
B) Expansionary
C) Noninterventionist
D) Fixed wage
A) Contractionary
B) Expansionary
C) Noninterventionist
D) Fixed wage
According to classical economists, they assume that the economy comes back to equilibrium or full employment automatically by automatic price and interest adjustments without government intervention.
Therefore, the correct answer is (c) Noninterventionist
Therefore, the correct answer is (c) Noninterventionist
4
MONETARY POLICY DURING THE GREAT DEPRESSION
Applicable Concept: Keynesians versus monetarists
Monetarists and Keynesians still debate the causes of the Great Depression. Monetarists Milton Friedman and Anna Schwartz, in their book A Monetary History of the United States , argued that the Great Depression was caused by the decline in the money supply, as shown in Exhibit 9(a).
During the 1920s, the money supply expanded steadily, and prices were generally stable. In response to the great stock market crash of 1929, bank failures, falling real GDP, and rising unemployment, the Fed changed its monetary policy. Through the Great Depression years from 1929 to 1933, M1 declined by 27 percent. Assuming velocity is relatively constant, how will a sharp reduction in the quantity of money in circulation affect the economy? Monetarists predict a reduction in prices, output, and employment. Between 1929 and 1933, the price level declined by 24 percent. In addition to deflation, real GDP was 27 percent lower in 1933 than in 1929. Unemployment rose from 3.2 percent in 1929 to 24.9 percent in 1933. Friedman and Schwartz argued that the ineptness of the Fed's monetary policy during the Great Depression caused the trough in the business cycle to be more severe and sustained.
The Great Depression was indeed not the Fed's finest hour. What should the Fed have done? Friedman and Schwartz argued that the Fed should have used open market operations to increase the money supply. Thus, they concluded that the Fed was to blame for not pursuing an expansionary policy, which would have reduced the severity and duration of the contraction. As shown in part (b), this was not the case for the Great Recession of 2007-2009. From the beginning, the Fed followed an expansionary policy and sharply increased the money supply.
Finally, although the emphasis here is monetary policy, parts (c) and (d) contrast fiscal policy during the two periods using the federal deficit as a percentage of GDP. During the Great Depression, there was a slight budget surplus until 1931 when the budget turned into a slight budget deficit before reaching a deficit of 5.9 percent of GDP in 1934. In contrast, fiscal policy was more expansionary by running deficits from the beginning of the recession in 2007 to 10 percent of GDP in 2009.
Explain why monetarists believe the Fed should have expanded the money supply during the Great Depression.
Unlock Deck
Unlock for access to all 50 flashcards in this deck.
Unlock Deck
k this deck
5
How much money do you keep in cash or checkable deposits on a typical day? Under the following conditions, would you increase or decrease your demand for money? Also identify whether the condition affects your transactions demand, precautionary demand, or speculative demand.
A) Your salary doubles.
B) The rate of interest on bonds and other assets falls.
C) An automated teller machine (ATM) is installed next door, and you have an ATM card.
D) Bond prices are expected to rise.
E) You are paid each week instead of monthly.
A) Your salary doubles.
B) The rate of interest on bonds and other assets falls.
C) An automated teller machine (ATM) is installed next door, and you have an ATM card.
D) Bond prices are expected to rise.
E) You are paid each week instead of monthly.
Unlock Deck
Unlock for access to all 50 flashcards in this deck.
Unlock Deck
k this deck
6
Explain the difference between the Keynesian and the monetarist views on how an increase in the money supply causes inflation.
Unlock Deck
Unlock for access to all 50 flashcards in this deck.
Unlock Deck
k this deck
7
Assume the economy is in short-run equilibrium at a real GDP. According to classical self-correction theory, which of the following policies should be followed?
A) The Federal Reserve should increase the money supply.
B) The federal government should increase spending.
C) The federal government should cut taxes.
D) None of the answers above are correct.
A) The Federal Reserve should increase the money supply.
B) The federal government should increase spending.
C) The federal government should cut taxes.
D) None of the answers above are correct.
Unlock Deck
Unlock for access to all 50 flashcards in this deck.
Unlock Deck
k this deck
8
MONETARY POLICY DURING THE GREAT DEPRESSION
Applicable Concept: Keynesians versus monetarists
Monetarists and Keynesians still debate the causes of the Great Depression. Monetarists Milton Friedman and Anna Schwartz, in their book A Monetary History of the United States , argued that the Great Depression was caused by the decline in the money supply, as shown in Exhibit 9(a).
During the 1920s, the money supply expanded steadily, and prices were generally stable. In response to the great stock market crash of 1929, bank failures, falling real GDP, and rising unemployment, the Fed changed its monetary policy. Through the Great Depression years from 1929 to 1933, M1 declined by 27 percent. Assuming velocity is relatively constant, how will a sharp reduction in the quantity of money in circulation affect the economy? Monetarists predict a reduction in prices, output, and employment. Between 1929 and 1933, the price level declined by 24 percent. In addition to deflation, real GDP was 27 percent lower in 1933 than in 1929. Unemployment rose from 3.2 percent in 1929 to 24.9 percent in 1933. Friedman and Schwartz argued that the ineptness of the Fed's monetary policy during the Great Depression caused the trough in the business cycle to be more severe and sustained.
The Great Depression was indeed not the Fed's finest hour. What should the Fed have done? Friedman and Schwartz argued that the Fed should have used open market operations to increase the money supply. Thus, they concluded that the Fed was to blame for not pursuing an expansionary policy, which would have reduced the severity and duration of the contraction. As shown in part (b), this was not the case for the Great Recession of 2007-2009. From the beginning, the Fed followed an expansionary policy and sharply increased the money supply.
Finally, although the emphasis here is monetary policy, parts (c) and (d) contrast fiscal policy during the two periods using the federal deficit as a percentage of GDP. During the Great Depression, there was a slight budget surplus until 1931 when the budget turned into a slight budget deficit before reaching a deficit of 5.9 percent of GDP in 1934. In contrast, fiscal policy was more expansionary by running deficits from the beginning of the recession in 2007 to 10 percent of GDP in 2009.
The Keynesians challenge the Friedman-Schwartz monetarists' monetary policy cure for the Great Depression. Use the AD-AS model to explain the Keynesian view. (Hint: Your answer must include the investment demand curve.)
Unlock Deck
Unlock for access to all 50 flashcards in this deck.
Unlock Deck
k this deck
9
A decrease in the interest rate, other things being equal, causes a (an)
A) upward movement along the demand curve for money.
B) downward movement along the demand curve for money.
C) rightward shift of the demand curve for money.
D) leftward shift of the demand curve for money.
A) upward movement along the demand curve for money.
B) downward movement along the demand curve for money.
C) rightward shift of the demand curve for money.
D) leftward shift of the demand curve for money.
Unlock Deck
Unlock for access to all 50 flashcards in this deck.
Unlock Deck
k this deck
10
Keynesians reject the influence of monetary policy on the economy. One argument supporting this Keynesian view is that the
A) money demand curve is horizontal at any interest rate.
B) aggregate demand curve is nearly flat.
C) investment demand curve is nearly vertical.
D) money demand curve is vertical.
A) money demand curve is horizontal at any interest rate.
B) aggregate demand curve is nearly flat.
C) investment demand curve is nearly vertical.
D) money demand curve is vertical.
Unlock Deck
Unlock for access to all 50 flashcards in this deck.
Unlock Deck
k this deck
11
Assuming the economy is in a recession, classical economists predict that
A) wages will remain fixed.
B) monetary policy will sell government securities.
C) higher wages will shift the short-run aggregate supply curve leftward.
D) lower wages will shift the short-run aggregate supply curve rightward.
A) wages will remain fixed.
B) monetary policy will sell government securities.
C) higher wages will shift the short-run aggregate supply curve leftward.
D) lower wages will shift the short-run aggregate supply curve rightward.
Unlock Deck
Unlock for access to all 50 flashcards in this deck.
Unlock Deck
k this deck
12
What are the basic motives for the transactions demand, precautionary demand, and speculative demand? Explain how these three demands are combined in a graph to show the total demand for money.
Unlock Deck
Unlock for access to all 50 flashcards in this deck.
Unlock Deck
k this deck
13
Based on the quantity theory of money, what would be the impact of increasing the money supply by 25 percent?
Unlock Deck
Unlock for access to all 50 flashcards in this deck.
Unlock Deck
k this deck
14
Assume the economy is operating at a real GDP below full-employment real GDP. Keynesian economists would prescribe which of the following policies
A) Noninterventionist
B) Fixed rule
C) Contractionary
D) Expansionary
A) Noninterventionist
B) Fixed rule
C) Contractionary
D) Expansionary
Unlock Deck
Unlock for access to all 50 flashcards in this deck.
Unlock Deck
k this deck
15
Assume the demand for money curve is stationary and the Fed increases the money supply. The result is that people
A) increase the supply of bonds, thus driving up the interest rate.
B) increase the supply of bonds, thus driving down the interest rate.
C) increase the demand for bonds, thus driving up the interest rate.
D) increase the demand for bonds, thus driving down the interest rate.
A) increase the supply of bonds, thus driving up the interest rate.
B) increase the supply of bonds, thus driving down the interest rate.
C) increase the demand for bonds, thus driving up the interest rate.
D) increase the demand for bonds, thus driving down the interest rate.
Unlock Deck
Unlock for access to all 50 flashcards in this deck.
Unlock Deck
k this deck
16
Starting from an equilibrium at E 1 in Exhibit 12, a rightward shift of the money supply curve from MS 1 to MS 2 would cause an excess
A) demand for money, leading people to sell bonds.
B) supply of money, leading people to buy bonds.
C) supply of money, leading people to sell bonds.
D) demand for money, leading people to buy bonds.
EXHIBIT 12 Money Market Demand and Supply Curves
A) demand for money, leading people to sell bonds.
B) supply of money, leading people to buy bonds.
C) supply of money, leading people to sell bonds.
D) demand for money, leading people to buy bonds.
EXHIBIT 12 Money Market Demand and Supply Curves
Unlock Deck
Unlock for access to all 50 flashcards in this deck.
Unlock Deck
k this deck
17
Assume the economy is in short-run equilibrium at a real GDP above its potential real GDP. According to Keynesian theory, which of the following policies should be followed?
A) The Federal Reserve should use open market operations and buy U.S. government securities.
B) The Federal Reserve should follow a fixed rule.
C) The federal government should cut taxes.
D) Fiscal policy and monetary policy should be contractionary.
A) The Federal Reserve should use open market operations and buy U.S. government securities.
B) The Federal Reserve should follow a fixed rule.
C) The federal government should cut taxes.
D) Fiscal policy and monetary policy should be contractionary.
Unlock Deck
Unlock for access to all 50 flashcards in this deck.
Unlock Deck
k this deck
18
Suppose a bond pays annual interest of $80. Compute the interest rate per year that a bondholder can earn if the bond has a face value of $800, $1,000, and $2,000. State the conclusion drawn from your calculations.
Unlock Deck
Unlock for access to all 50 flashcards in this deck.
Unlock Deck
k this deck
19
Suppose the investment demand curve is a vertical line. Would the Keynesian or the monetarist view of the impact of monetary policy on investment spending be correct?
Unlock Deck
Unlock for access to all 50 flashcards in this deck.
Unlock Deck
k this deck
20
As shown in Part (a) of Exhibit A-3, assume classical nonintervention policy is adopted. Which of the following would cause the economy to self-correct?
A) Competition among firms for workers increases the nominal wage and SRAS shifts rightward.
B) Long-run equilibrium will be established at Y 1 and P 2.
C) Long-run equilibrium will be established at Y 1 and P 3.
D) Competition among unemployed workers decreases nominal wages and SRAS shifts rightward.
EXHIBIT A-3 Macro AD/AS Models
A) Competition among firms for workers increases the nominal wage and SRAS shifts rightward.
B) Long-run equilibrium will be established at Y 1 and P 2.
C) Long-run equilibrium will be established at Y 1 and P 3.
D) Competition among unemployed workers decreases nominal wages and SRAS shifts rightward.
EXHIBIT A-3 Macro AD/AS Models
Unlock Deck
Unlock for access to all 50 flashcards in this deck.
Unlock Deck
k this deck
21
Assume the demand for money curve is fixed and the Fed decreases the money supply. The result is a temporary
A) excess quantity of money demanded.
B) excess quantity of money supplied.
C) increase in the price of bonds.
D) increase in the demand for bonds.
A) excess quantity of money demanded.
B) excess quantity of money supplied.
C) increase in the price of bonds.
D) increase in the demand for bonds.
Unlock Deck
Unlock for access to all 50 flashcards in this deck.
Unlock Deck
k this deck
22
Beginning from an equilibrium at E 2 in Exhibit 12, a decrease in the money supply from $600 billion to $400 billion causes people to
A) sell bonds and drive the price of bonds down.
B) buy bonds and drive the price of bonds up.
C) buy bonds and drive the price of bonds down.
D) sell bonds and drive the price of bonds up.
A) sell bonds and drive the price of bonds down.
B) buy bonds and drive the price of bonds up.
C) buy bonds and drive the price of bonds down.
D) sell bonds and drive the price of bonds up.
Unlock Deck
Unlock for access to all 50 flashcards in this deck.
Unlock Deck
k this deck
23
In Part (a) of Exhibit A-3, an expansionary stabilization policy designed to move the economy from Y 1 and Y P would shift the
A) aggregate demand curve (AD) to the left.
B) aggregate demand curve (AD) to the right.
C) SRAS rightward.
D) LRAS rightward.
A) aggregate demand curve (AD) to the left.
B) aggregate demand curve (AD) to the right.
C) SRAS rightward.
D) LRAS rightward.
Unlock Deck
Unlock for access to all 50 flashcards in this deck.
Unlock Deck
k this deck
24
Using the demand and supply schedule for money shown in Exhibit 10, do the following:
a. Graph the demand for money and the supply of money curves.
b. Determine the equilibrium interest rate.
c. Suppose the Fed increases the money supply by $100 billion. Show the effect in your graph, and describe the money market adjustment process to a new equilibrium rate. What is the new equilibrium rate of interest?
EXHIBIT 10 Money Market
a. Graph the demand for money and the supply of money curves.
b. Determine the equilibrium interest rate.
c. Suppose the Fed increases the money supply by $100 billion. Show the effect in your graph, and describe the money market adjustment process to a new equilibrium rate. What is the new equilibrium rate of interest?
EXHIBIT 10 Money Market
Unlock Deck
Unlock for access to all 50 flashcards in this deck.
Unlock Deck
k this deck
25
Why is the shape of the aggregate supply curve important to the Keynesian-monetarist controversy? (Hint: Review Exhibit 6 in the chapter on aggregate demand and supply.)
Unlock Deck
Unlock for access to all 50 flashcards in this deck.
Unlock Deck
k this deck
26
In Part (b) of Exhibit A-3, the economy is initially in short-run equilibrium at real GDP level Y 1 and price level P 2. If the federal government decides to intervene, it would
A) decrease taxes.
B) increase taxes and government spending by equal amounts.
C) increase the level of government spending for goods and services.
D) decrease the level of government spending for goods and services.
A) decrease taxes.
B) increase taxes and government spending by equal amounts.
C) increase the level of government spending for goods and services.
D) decrease the level of government spending for goods and services.
Unlock Deck
Unlock for access to all 50 flashcards in this deck.
Unlock Deck
k this deck
27
Assume the demand for money curve is fixed and the Fed increases the money supply. The result is that the price of bonds
A) rises.
B) remains unchanged.
C) falls.
D) does none of the above.
A) rises.
B) remains unchanged.
C) falls.
D) does none of the above.
Unlock Deck
Unlock for access to all 50 flashcards in this deck.
Unlock Deck
k this deck
28
In Exhibit 13, a move from MS 1 to MS 2
A) increases the money supply, causing the interest rate to rise from i 2 to i 1.
EXHIBIT 13 Money, Investment, and Product Markets
B) increases the money supply, causing the interest rate to fall from i 1 to i 2.
C) decreases the money supply, causing the interest rate to rise from i 2 to i 1.
D) decreases the money supply, causing the interest rate to fall from i 1 to i 2.
E) has no effect on the money supply or the interest rate.
A) increases the money supply, causing the interest rate to rise from i 2 to i 1.
EXHIBIT 13 Money, Investment, and Product Markets
B) increases the money supply, causing the interest rate to fall from i 1 to i 2.
C) decreases the money supply, causing the interest rate to rise from i 2 to i 1.
D) decreases the money supply, causing the interest rate to fall from i 1 to i 2.
E) has no effect on the money supply or the interest rate.
Unlock Deck
Unlock for access to all 50 flashcards in this deck.
Unlock Deck
k this deck
29
In Part (b) of Exhibit A-3, the economy is initially in short-run equilibrium at real GDP level Y 1 and price P 2. Classical theory argues that
A) SRAS 1 will shift to SRAS 2 without government intervention.
B) lower wages will result in a shift from SRAS 1 to SRAS 2.
C) long-run equilibrium will be established at Y P and P 3.
D) all of above will take place.
A) SRAS 1 will shift to SRAS 2 without government intervention.
B) lower wages will result in a shift from SRAS 1 to SRAS 2.
C) long-run equilibrium will be established at Y P and P 3.
D) all of above will take place.
Unlock Deck
Unlock for access to all 50 flashcards in this deck.
Unlock Deck
k this deck
30
Assume you are the chair of the Federal Reserve Board of Governors and the condition of the economy is shown in Exhibit 5. Assume you are a Keynesian, and start at point E 1 in the money market and the product market. State the likely direction of change in the price level, real GDP, and employment caused by each of the following monetary policies:
a. The Fed makes an open market sale of government bonds.
b. The Fed reduces the required reserve ratio.
c. The Fed increases the discount rate.
a. The Fed makes an open market sale of government bonds.
b. The Fed reduces the required reserve ratio.
c. The Fed increases the discount rate.
Unlock Deck
Unlock for access to all 50 flashcards in this deck.
Unlock Deck
k this deck
31
In Exhibit 13, the Fed believes the economy is atAD 3 , how might it engineer a decline in the price level?
A) By decreasing the money supply, the interest rate falls, investment rises, and aggregate demand falls, causing the price level to fall.
B) By decreasing the money supply, the interest rate rises, investment rises, and aggregate demand rises, causing the price level to fall.
C) By decreasing the money supply, the interest rate rises, investment falls, and aggregate demand falls, causing the price level to fall.
D) By increasing the money supply, the interest rate rises, investment rises, and aggregate demand falls, causing the price level to fall.
E) By increasing the money supply, the interest rate rises, investment falls, and aggregate demand rises, causing the price level to fall.
Unlock Deck
Unlock for access to all 50 flashcards in this deck.
Unlock Deck
k this deck
32
In Part (b) of Exhibit A-3, assume the economy is in equilibrium at Y 1. Classical policy would predict that competition
A) from unemployed workers results in lower wages and SRAS shifts rightward until Y P , P 1.
B) among firms for workers results in higher wages and SRAS shifts leftward until Y P , P 2.
C) among firms for workers results in higher wages and SRAS shifts rightward until Y P , P 1.
D) among firms for workers results in higher wages and SRAS shifts leftward until Y P , P 3.
Unlock Deck
Unlock for access to all 50 flashcards in this deck.
Unlock Deck
k this deck
33
Using the aggregate supply and demand model, assume the economy is in equilibrium on the intermediate portion of the aggregate supply curve. A decrease in the money supply will decrease the price level and
A) lower both the interest rate and the real GDP.
B) raise both the interest rate and real GDP.
C) lower the interest rate and raise real GDP.
D) raise the interest rate and lower real GDP.
A) lower both the interest rate and the real GDP.
B) raise both the interest rate and real GDP.
C) lower the interest rate and raise real GDP.
D) raise the interest rate and lower real GDP.
Unlock Deck
Unlock for access to all 50 flashcards in this deck.
Unlock Deck
k this deck
34
The Monetarist transmission mechanism through which monetary policy affects the price level, real GDP, and employment depends on the
A) indirect impact of changes on the interest rate.
B) indirect impact of changes on profit expectations.
C) indirect impact of changes in fiscal policy on aggregate demand.
D) indirect impact of changes in the money supply on aggregate demand.
A) indirect impact of changes on the interest rate.
B) indirect impact of changes on profit expectations.
C) indirect impact of changes in fiscal policy on aggregate demand.
D) indirect impact of changes in the money supply on aggregate demand.
Unlock Deck
Unlock for access to all 50 flashcards in this deck.
Unlock Deck
k this deck
35
In Part (a) of Exhibit A-4, suppose that the initial equilibrium is at real GDP level Y 1 and price level P 2. At real GDP level Y 1 there is
A) an inflationary gap.
B) a recessionary gap.
C) full employment.
D) long-run equilibrium.
A) an inflationary gap.
B) a recessionary gap.
C) full employment.
D) long-run equilibrium.
Unlock Deck
Unlock for access to all 50 flashcards in this deck.
Unlock Deck
k this deck
36
"A monetarist investigator might say that the sewer flow of 6,000 gallons an hour consisted of an average of 200 gallons in the sewer at any one time with a complete turnover of the water 30 times every hour." 1 Interpret this statement using the equation of exchange.
Unlock Deck
Unlock for access to all 50 flashcards in this deck.
Unlock Deck
k this deck
37
Suppose that the Fed makes a $100 billion open-market sale of Treasury bonds, and the money multiplier is 6. Which of the following impacts are most likely to result?
A) The money supply shifts inward, and the equilibrium interest rate rises in the money market.
B) The money supply shifts outward, and the equilibrium interest rate falls in the money market.
C) Investment declines, causing the aggregate demand curve to shift leftward, reducing equilibrium real GDP and thus slowing the economy.
D) Both answers a. and c. are correct.
E) Both answers b. and c. above are correct.
Unlock Deck
Unlock for access to all 50 flashcards in this deck.
Unlock Deck
k this deck
38
In Part (a) of Exhibit A-4, the economy is initially in short-run equilibrium at real GDP level Y 1 and price level P 2. If the government decides to intervene, it would most likely
EXHIBIT A-4 Macro AD/AS Models
A) decrease taxes.
B) increase transfer payments.
C) increase the level of government spending for goods and services.
D) decrease the level of government spending for goods and services.
EXHIBIT A-4 Macro AD/AS Models
A) decrease taxes.
B) increase transfer payments.
C) increase the level of government spending for goods and services.
D) decrease the level of government spending for goods and services.
Unlock Deck
Unlock for access to all 50 flashcards in this deck.
Unlock Deck
k this deck
39
Based on the equation of exchange, the money supply in the economy is calculated as
A) M = V/PQ.
B) M = V(PQ).
C) MV = PQ.
D) M = PQ ? V.
A) M = V/PQ.
B) M = V(PQ).
C) MV = PQ.
D) M = PQ ? V.
Unlock Deck
Unlock for access to all 50 flashcards in this deck.
Unlock Deck
k this deck
40
If the Fed reduces the discount rate, which of the following are most likely to result?
A) The money supply curve shifts rightward, and the equilibrium interest rate falls in the money market.
B) Investment spending declines, causing the aggregate demand curve to shift leftward, reducing equilibrium real GDP and thus slowing the economy.
C) Investment spending rises, causing the aggregate demand curve to shift rightward, increasing equilibrium real GDP and thus accelerating the economy.
D) Both answers a. and b. above are correct.
E) Both answers a. and c. above are correct.
Unlock Deck
Unlock for access to all 50 flashcards in this deck.
Unlock Deck
k this deck
41
In Part (a) of Exhibit A-4, the economy is initially in short-run equilibrium at real GDP level Y 1 and price level P 2. Classical theory argues that
A) SRAS 1 will shift to SRAS 2 without government intervention.
B) lower wages will result in a shift from SRAS 1 to SRAS 2.
C) long-run equilibrium will be established at Y P and P 3.
D) All of the answers above will take place.
A) SRAS 1 will shift to SRAS 2 without government intervention.
B) lower wages will result in a shift from SRAS 1 to SRAS 2.
C) long-run equilibrium will be established at Y P and P 3.
D) All of the answers above will take place.
Unlock Deck
Unlock for access to all 50 flashcards in this deck.
Unlock Deck
k this deck
42
What is the quantity theory of money, and what does each term in the equation represent?
Unlock Deck
Unlock for access to all 50 flashcards in this deck.
Unlock Deck
k this deck
43
Which of the following correctly gives us the equation of exchange?
A) TR = PQ.
B) MV = VM.
C) MV = PQ.
D) TR = VM.
A) TR = PQ.
B) MV = VM.
C) MV = PQ.
D) TR = VM.
Unlock Deck
Unlock for access to all 50 flashcards in this deck.
Unlock Deck
k this deck
44
In Part (b) of Exhibit A-4, an expansionary stabilization policy designed to move the economy from Y 1 to Y P would attempt to shift
A) the aggregate demand curve (AD) leftward.
B) SRAS 1 to SRAS 2.
C) the aggregate demand curve (AD) rightward.
D) the LRAS rightward.
A) the aggregate demand curve (AD) leftward.
B) SRAS 1 to SRAS 2.
C) the aggregate demand curve (AD) rightward.
D) the LRAS rightward.
Unlock Deck
Unlock for access to all 50 flashcards in this deck.
Unlock Deck
k this deck
45
The V in the equation of exchange represents the
A) variation in the GDP.
B) variation in the CPI.
C) variation in real GDP.
D) average number of times per year a dollar is spent on final goods and services.
A) variation in the GDP.
B) variation in the CPI.
C) variation in real GDP.
D) average number of times per year a dollar is spent on final goods and services.
Unlock Deck
Unlock for access to all 50 flashcards in this deck.
Unlock Deck
k this deck
46
Which of the following is the velocity of money?
A) How quickly the average worker gets paid after his or her work is done.
B) The average speed of ATM machines.
C) The average number of times per year that a given dollar of the money supply is spent.
D) None of the answers above are correct.
A) How quickly the average worker gets paid after his or her work is done.
B) The average speed of ATM machines.
C) The average number of times per year that a given dollar of the money supply is spent.
D) None of the answers above are correct.
Unlock Deck
Unlock for access to all 50 flashcards in this deck.
Unlock Deck
k this deck
47
As shown in Part (b) of Exhibit A-4, assume classical nonintervention policy is adopted. Which of the following would cause the economy to self-correct?
A) Competition among firms for workers increases the nominal wage and SRAS shifts rightward.
B) Long-run equilibrium will be established at Y 1 and P 2.
C) Long-run equilibrium will be established at Y 1 and P 3.
D) Competition among unemployed workers decreases nominal wages and SRAS shifts rightward.
Unlock Deck
Unlock for access to all 50 flashcards in this deck.
Unlock Deck
k this deck
48
Exhibit 6 shows the monetarist monetary policy transmission mechanism. Assume the economy is in a recession. At each arrow, identify a reason why the transmission process could fail.
Unlock Deck
Unlock for access to all 50 flashcards in this deck.
Unlock Deck
k this deck
49
If nominal GDP is $7 trillion, and the money supply is $2 trillion, then what is the velocity of money?
A) 14.0.
B) 7.0.
C) 3.5.
D) 2.0.
A) 14.0.
B) 7.0.
C) 3.5.
D) 2.0.
Unlock Deck
Unlock for access to all 50 flashcards in this deck.
Unlock Deck
k this deck
50
DID THE FED CAUSE THE GREAT RECESSION?
Applicable Concept: monetarism
The story of the worst collapse of the housing market and the most serious financial crisis since the Great Depression is filled with villains and no action hero to sweep down from the sky and save the day. It is an Alice in Wonderland story with plenty of blame to go around: homeowners who bought a Trojan horse, rampant speculation, predatory lenders, slick Wall Street operators, greedy CEOs, lax regulators, and debatable Fed policy. Perhaps a phrase by Alan Greenspan, former Fed chairman, called "The Maestro," best described the bust of the housing market bubble when he said, "How do we know when irrational exuberance has unduly escalated asset values?"
The stage was set for the housing crisis by the Fed's response to the recession of 2001. The annual change in the money supply jumped sharply upward from -3.1 percent in 2000 to an 8.7 percent increase in 2001. And, as shown in the above exhibit, the Fed decreased interest rates sharply after 2001 and kept them historically low in order to boost aggregate demand and prevent another recession. Then in 2004, Greenspan addressed the Credit Union Association and said, "American consumers might benefit if lenders provided greater mortgage product alternatives to the traditional fixed rate mortgage." And as if following the Fed chairman's advice, adjustable-rate mortgages (ARMs) became the loan of choice for subprime mortgage loan borrowers who had poor or less than ideal credit scores. Mailboxes were stuffed with offers to borrow 100 percent or more of a home's value with zero down. Television shows advertised the idea that anyone could make it rich in real estate, and housing became a speculative game. Payments and "teaser" interest rates were held artificially low for the first few years of the loan and then would jump sharply upward. Forget worrying about not affording the home, your income would not be checked, following a "no document" lending practice. In fact, some loans were made to people who were no longer living. Thus, using risky ARMs, banks lent billions of dollars to home buyers who could not pay the bank when the payments and interest rates rose.
SOURCE : FRB Federal Open Market Committee, http://www.federalreserve.gov/fomc/fundsrate.htm.
Faced with accumulating portfolios of risky debt, banks and mortgage companies sold these risky mortgages to New York investment firms such as Bear Stearns (acquired by JPMorgan Chase with financial backing from the Fed) and Merrill Lynch, who pooled them with other securities. These packages, often called collateralized debt obligations, or CDOs, were sold to customers around the world-a process called "securitization." And this securitization occurred with the blessing of ratings agencies such as Standard Poor's, which actually did not know how to evaluate the risk of these securities. With each of these transactions, large fees were collected, and in short, consummation of the deal was the criterion and not validity of the assessment of risk.
Expansion of the housing market bubble was based on an assumption by all the players that the party would never end and real estate prices would always go up. However, beginning in the summer of 2005, subprime foreclosures rose and home prices dropped as people's payments rose under their ARMs. Also, once the value of homes fell below the loan value, people could not refinance loans to get lower payments. When people walked away from their mortgages, Wall Street and foreign investors were stuck with bad loans in their CDOs to write off, CEOs were fired, and many real estate executives were indicted for mortgage fraud. As a result, lenders greatly tightened their lending standards to avoid further risky loans, and a credit crunch made home financing difficult to obtain.
In 2008, the Fed announced that it would allow Wall Street investment firms to receive emergency loans and exchange risky investments for Treasury securities. Also, the Housing and Economic Recovery Act of 2008 was passed that allowed some borrowers to refinance their mortgages with new fixed-rate loans backed by a federal guarantee, and it provided grants for state and local governments in the hardest-hit communities to buy foreclosed property. It also included a tax credit for first-time home buyers who buy housing that is unoccupied. And the Treasury Department was given authority to bail out or take over Fannie Mae and Freddie Mac, the troubled government-created firms that fund the vast majority of mortgage loans in the United States.
In addition, a massive $700 billion bailout plan was enacted in 2008 that gave the Treasury the authority TARP (Troubled Assets Recovery Program) to buy and resell bad mortgage debt from financial institutions. But TARP changed its original purpose because it was very difficult to determine the price that the government should pay for the risky assets. Consequently, TARP changed its plan and spent over half of its funds to invest government capital into banks by buying preferred stock with a 5 percent rate of return, which is the equivalent of a loan to the bank. In 2010 Congress passed Dodd-Frank, which is a controversial and extensive act intended to increase accountability and regulation of financial institutions. This act gives more oversight authority to the Fed over products that financial institutions provide. In 2013 the Volcker Rule, named after the former Federal Reserve chairman, was approved. This rule limits banks investment in complex financial instruments. And in 2014, Bank of America admitted that it took part in faulty mortgage-backed securities practices and agreed to a $16.5 billion settlement with the U.S. government.
In support of the Fed's monetary policy prior to the deflation of the home prices bubble, one can argue that the reality is that increasing the money supply and low-interest rates were required to sustain expansion. Based on the monetarist school of thought, criticize the Fed's policy.
Applicable Concept: monetarism
The story of the worst collapse of the housing market and the most serious financial crisis since the Great Depression is filled with villains and no action hero to sweep down from the sky and save the day. It is an Alice in Wonderland story with plenty of blame to go around: homeowners who bought a Trojan horse, rampant speculation, predatory lenders, slick Wall Street operators, greedy CEOs, lax regulators, and debatable Fed policy. Perhaps a phrase by Alan Greenspan, former Fed chairman, called "The Maestro," best described the bust of the housing market bubble when he said, "How do we know when irrational exuberance has unduly escalated asset values?"
The stage was set for the housing crisis by the Fed's response to the recession of 2001. The annual change in the money supply jumped sharply upward from -3.1 percent in 2000 to an 8.7 percent increase in 2001. And, as shown in the above exhibit, the Fed decreased interest rates sharply after 2001 and kept them historically low in order to boost aggregate demand and prevent another recession. Then in 2004, Greenspan addressed the Credit Union Association and said, "American consumers might benefit if lenders provided greater mortgage product alternatives to the traditional fixed rate mortgage." And as if following the Fed chairman's advice, adjustable-rate mortgages (ARMs) became the loan of choice for subprime mortgage loan borrowers who had poor or less than ideal credit scores. Mailboxes were stuffed with offers to borrow 100 percent or more of a home's value with zero down. Television shows advertised the idea that anyone could make it rich in real estate, and housing became a speculative game. Payments and "teaser" interest rates were held artificially low for the first few years of the loan and then would jump sharply upward. Forget worrying about not affording the home, your income would not be checked, following a "no document" lending practice. In fact, some loans were made to people who were no longer living. Thus, using risky ARMs, banks lent billions of dollars to home buyers who could not pay the bank when the payments and interest rates rose.
SOURCE : FRB Federal Open Market Committee, http://www.federalreserve.gov/fomc/fundsrate.htm.
Faced with accumulating portfolios of risky debt, banks and mortgage companies sold these risky mortgages to New York investment firms such as Bear Stearns (acquired by JPMorgan Chase with financial backing from the Fed) and Merrill Lynch, who pooled them with other securities. These packages, often called collateralized debt obligations, or CDOs, were sold to customers around the world-a process called "securitization." And this securitization occurred with the blessing of ratings agencies such as Standard Poor's, which actually did not know how to evaluate the risk of these securities. With each of these transactions, large fees were collected, and in short, consummation of the deal was the criterion and not validity of the assessment of risk.
Expansion of the housing market bubble was based on an assumption by all the players that the party would never end and real estate prices would always go up. However, beginning in the summer of 2005, subprime foreclosures rose and home prices dropped as people's payments rose under their ARMs. Also, once the value of homes fell below the loan value, people could not refinance loans to get lower payments. When people walked away from their mortgages, Wall Street and foreign investors were stuck with bad loans in their CDOs to write off, CEOs were fired, and many real estate executives were indicted for mortgage fraud. As a result, lenders greatly tightened their lending standards to avoid further risky loans, and a credit crunch made home financing difficult to obtain.
In 2008, the Fed announced that it would allow Wall Street investment firms to receive emergency loans and exchange risky investments for Treasury securities. Also, the Housing and Economic Recovery Act of 2008 was passed that allowed some borrowers to refinance their mortgages with new fixed-rate loans backed by a federal guarantee, and it provided grants for state and local governments in the hardest-hit communities to buy foreclosed property. It also included a tax credit for first-time home buyers who buy housing that is unoccupied. And the Treasury Department was given authority to bail out or take over Fannie Mae and Freddie Mac, the troubled government-created firms that fund the vast majority of mortgage loans in the United States.
In addition, a massive $700 billion bailout plan was enacted in 2008 that gave the Treasury the authority TARP (Troubled Assets Recovery Program) to buy and resell bad mortgage debt from financial institutions. But TARP changed its original purpose because it was very difficult to determine the price that the government should pay for the risky assets. Consequently, TARP changed its plan and spent over half of its funds to invest government capital into banks by buying preferred stock with a 5 percent rate of return, which is the equivalent of a loan to the bank. In 2010 Congress passed Dodd-Frank, which is a controversial and extensive act intended to increase accountability and regulation of financial institutions. This act gives more oversight authority to the Fed over products that financial institutions provide. In 2013 the Volcker Rule, named after the former Federal Reserve chairman, was approved. This rule limits banks investment in complex financial instruments. And in 2014, Bank of America admitted that it took part in faulty mortgage-backed securities practices and agreed to a $16.5 billion settlement with the U.S. government.
In support of the Fed's monetary policy prior to the deflation of the home prices bubble, one can argue that the reality is that increasing the money supply and low-interest rates were required to sustain expansion. Based on the monetarist school of thought, criticize the Fed's policy.
Unlock Deck
Unlock for access to all 50 flashcards in this deck.
Unlock Deck
k this deck
Unlock Deck
Unlock for access to all 50 flashcards in this deck.


