Deck 5: Temperature Relations
Full screen (f)
Question
Question
Question
Question
Question
Question
Question
Question
Question
Question
Question
Question

Unlock Deck
Sign up to unlock the cards in this deck!
Unlock Deck
Unlock Deck
1/12
Play
Full screen (f)
Deck 5: Temperature Relations
1
The body temperature of the seashore isopod Ligia oceanica is 30°C under stones, where the relative humidity is 100%, but 26°C on the surface, where it is exposed to full sun and the relative humidity is 70%. Edney (1953) proposed that the isopods in the open had lower body temperatures because they evaporatively cooled in the open air. Explain why evaporative cooling would be effective in the open air but nearly impossible under stones.
Ligia oceanica is an isopod belonging to phylum arthropoda living near the seashore. It is commonly found in rock crevices and under rocks.
Conditions on the surface: -
• The body temperature of Ligia oceanica is given as 26 °C on the surface, where the relative humidity is 70%.
• Relative humidity gives an idea of the water vapor content of the atmosphere. The lower the relative humidity, the lower the water vapor content of the atmosphere.
• When there is a difference between the actual vapor pressure and the saturation vapor pressure, the difference in the two pressures at a particular temperature is given by the vapor pressure deficit.
• The low vapor content of the atmosphere indicates a high vapor pressure deficit and low relative humidity. Such conditions promote more loss of water by the evaporation from the terrestrial organisms. This evaporation also contributes to the evaporative cooling of the organism.
• Hence, Ligia oceanica at the surface loses more, which leads to the evaporative cooling and lowering of its body temperature.
Conditions under the rocks:
• The relative humidity under the rocks is given as 100%, which indicates a saturated atmosphere.
• The actual vapor pressure is equal to the saturation vapor pressure. Hence, it indicates a zero vapor pressure deficit.
• Under these conditions, the loss of moisture from the body cannot occur, since the atmosphere is already saturated with moisture.
The relationship between the evaporative cooling and the vapor status of the atmosphere in terms of the relative humidity and vapor pressure deficit is given as follows.
Hence, there is no evaporative cooling, and the body temperature of the isopod is high under the stones.
Thus, evaporative cooling is effective in open air, but nearly impossible under the stones.
2
The number of observations included in a sample, that is, sample size, has an important influence on the level of confidence we place on conclusions based on that sample. Let's examine a simple example of how sample size affects our estimate of some ecological feature. Consider an ecologist interested in how disturbance by flash flooding may affect the number of benthic insect species living in a stream. The stream is Tesuque Creek at about 3,000 m elevation in the mountains above Santa Fe, New Mexico. A flash flood, which completely disrupted one fork of Tesuque Creek, left a second, similar-sized fork undisturbed. Nine months after the flood, samples were taken to determine if there was a difference in the number of species of mayflies (Order Ephemeroptera), stoneflies (O. Plecoptera), caddisflies (O. Trichoptera), and beetles (O. Coleoptera) living in similar-sized reaches of the two forks. Samples of the benthic community were taken at 5 m intervals with a Surber sampler, which has a 0.1 m 2 metal frame, or quadrat, and an attached net. As a stream ecologist disturbs the bottom material within the quadrat of a Surber sampler, the net trailing in the current catches benthic organisms that are dislodged. In the study of Tesuque Creek, the number of benthic insect species captured in each 0.1 m 2 sample ranged from one to six in the disturbed fork and from two to eight in the undisturbed fork. However, our question concerns the total number of species in each fork and the number of benthic samples required to make a good estimate of that number of species.
Figure 1 plots the data in a way that provides an answer to both questions. The Surber samples are plotted in the exact order they were taken, beginning with the first that was taken at the downstream end of each study reach and ending with the twelfth sample taken 55 m upstream from the first. As shown in figure 1 , each of the first few samples adds to the cumulative number of species collected at each site, which rises steeply at first and then levels off at a maximum number of species in each study reach. The cumulative number of species stopped increasing at a sample size of seven quadrats in the undisturbed study reach and at five quadrats in the disturbed study reach.
How many samples should a researcher take? In the case of the benthic community just examined, seven replicate counts from 0.1 m 2 quadrats appears to be sufficient to estimate the number of benthic mayfly, stonefly, caddisfly, and beetle species living in a short reach of a small, high-elevation stream in the Rocky Mountains. (We will revisit this study in Investigating the Evidence 16, p. 359, which concerns estimating the number of species in a community.) In contrast, to make generalizations about global patterns of rooting among plants, Schenk and Jackson (2002) reported on 475 root profiles at 209 locations (see p. 134). The number of samples necessary depends on the amount of variability in the system under study and the spatial and temporal scope of the study. However, whether the scope of a project is large or small, sample size is one of the most important components of study design.
When designing an ecological study, it is important to take a sufficient number of samples to test the hypothesis under study. Why might a researcher try to collect a sufficient number of samples to test the hypothesis but not more?
Scientific research is a systematic and stepwise approach of solving a problem as per the set rules.
It is a lengthy process requiring complete knowledge of research methodology, proper planning, and execution.
There are a number of steps involved in a scientific study. These are listed below.
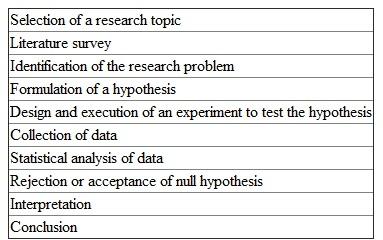 After the identification of the research problem, a hypothesis is formulated. A hypothesis is a statement that gives the solution for the research problem.
There are two types of hypothesis:
A null hypothesis states that the observations in the data are due to chance and statiscally insignificant.
An alternative hypothesis states that the observations in the data are not due to chance, but due to a definite cause.
In a scientific study, the researcher tries to disprove the null hypothesis, which indirectly proves the alternative hypothesis.
For evaluation of hypothesis, data is collected from a population. Since the population size is usually huge, it is not practicable to collect the data from the whole population. Hence, a sample that is representative of a population is collected. This process is called sampling. A small population, however, can be taken as the sample itself.
Sampling is an important step that may lead to sampling errors if done improperly. The sample size is a critical factor.
A large sample size makes the research expensive, time-consuming, and laborious. It makes the interpretation of results difficult.
However, a large sample size increases the accuracy.
The margin of error (the discrepancy between the sample parameter and population parameter) is decreased. For example, if the margin of error is ±1%, then the difference between the population parameter and the sample parameter is ±1%. Thus, the smaller the margin of error, the higher is the precision.
High confidence levels (the percentage of samples, including the population parameter studied out of the total samples) can be set. Confidence levels of 90%, 95% or 99% can be set. A confidence level of 95% indicates that out of 100 samples, 95 samples will contain the population parameter and 5 will not represent the population.
In the case of a population showing high variability, a large population is preferred to include the heterogeneity of the population.
A small sample size may not be the true representative of the population.
It may lead to accepting or rejecting the null hypothesis incorrectly.
Thus, it may lead to inaccurate results.
The level of precision of the study, the population variability, and the confidence levels set for the study determine the sample size.
Hence, a researcher should try to collect a sufficient number of samples to test the hypothesis.
It is a lengthy process requiring complete knowledge of research methodology, proper planning, and execution.
There are a number of steps involved in a scientific study. These are listed below.
After the identification of the research problem, a hypothesis is formulated. A hypothesis is a statement that gives the solution for the research problem.There are two types of hypothesis:
A null hypothesis states that the observations in the data are due to chance and statiscally insignificant.
An alternative hypothesis states that the observations in the data are not due to chance, but due to a definite cause.
In a scientific study, the researcher tries to disprove the null hypothesis, which indirectly proves the alternative hypothesis.
For evaluation of hypothesis, data is collected from a population. Since the population size is usually huge, it is not practicable to collect the data from the whole population. Hence, a sample that is representative of a population is collected. This process is called sampling. A small population, however, can be taken as the sample itself.
Sampling is an important step that may lead to sampling errors if done improperly. The sample size is a critical factor.
A large sample size makes the research expensive, time-consuming, and laborious. It makes the interpretation of results difficult.
However, a large sample size increases the accuracy.
The margin of error (the discrepancy between the sample parameter and population parameter) is decreased. For example, if the margin of error is ±1%, then the difference between the population parameter and the sample parameter is ±1%. Thus, the smaller the margin of error, the higher is the precision.
High confidence levels (the percentage of samples, including the population parameter studied out of the total samples) can be set. Confidence levels of 90%, 95% or 99% can be set. A confidence level of 95% indicates that out of 100 samples, 95 samples will contain the population parameter and 5 will not represent the population.
In the case of a population showing high variability, a large population is preferred to include the heterogeneity of the population.
A small sample size may not be the true representative of the population.
It may lead to accepting or rejecting the null hypothesis incorrectly.
Thus, it may lead to inaccurate results.
The level of precision of the study, the population variability, and the confidence levels set for the study determine the sample size.
Hence, a researcher should try to collect a sufficient number of samples to test the hypothesis.
3
Distinguish between vapor pressure deficit, osmotic pressure, and water potential. How can all three phenomena be expressed in the same units of measure: pascals?
The distinguishing features among vapor pressure deficit, osmotic pressure, and water potential are as follows:
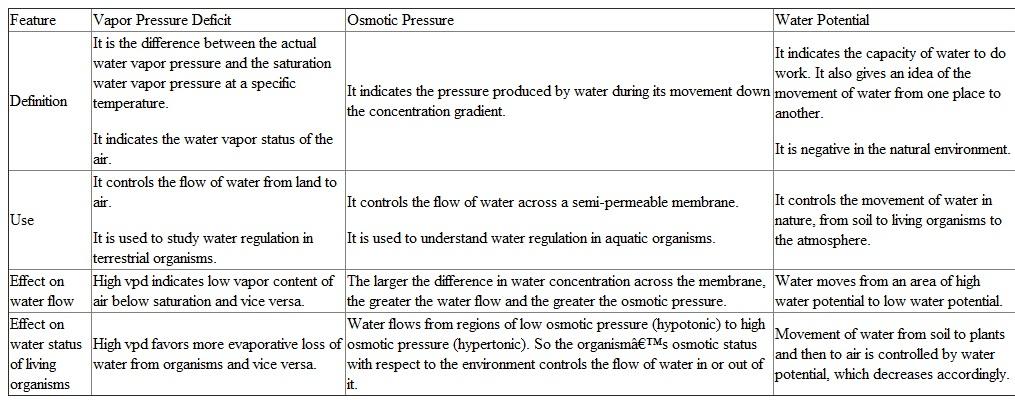 Vapor pressure deficit, osmotic pressure and water potential are expressed in the same units of pressure, Pascal.
Vapor pressure deficit: It gives a difference in two pressures, that is, actual vapor pressure and saturation vapor pressure. Hence, its unit is Pascals.
Osmotic pressure: It is a type of pressure exerted by moving water across the semi-permeable membrane. Hence, it also has a unit of pressure: Pascals.
Water potential: It shows the movement of water from one place to another. Water flows from an area of high concentration or high water potential to an area of low concentration or low water potential. Thus, water potential can be correlated with water concentration and, in turn, to pressure. High water potential indicates more water concentration and hence more pressure exerted. Hence, it also has a unit of pressure: Pascals.
Vapor pressure deficit, osmotic pressure and water potential are expressed in the same units of pressure, Pascal.Vapor pressure deficit: It gives a difference in two pressures, that is, actual vapor pressure and saturation vapor pressure. Hence, its unit is Pascals.
Osmotic pressure: It is a type of pressure exerted by moving water across the semi-permeable membrane. Hence, it also has a unit of pressure: Pascals.
Water potential: It shows the movement of water from one place to another. Water flows from an area of high concentration or high water potential to an area of low concentration or low water potential. Thus, water potential can be correlated with water concentration and, in turn, to pressure. High water potential indicates more water concentration and hence more pressure exerted. Hence, it also has a unit of pressure: Pascals.
4
The number of observations included in a sample, that is, sample size, has an important influence on the level of confidence we place on conclusions based on that sample. Let's examine a simple example of how sample size affects our estimate of some ecological feature. Consider an ecologist interested in how disturbance by flash flooding may affect the number of benthic insect species living in a stream. The stream is Tesuque Creek at about 3,000 m elevation in the mountains above Santa Fe, New Mexico. A flash flood, which completely disrupted one fork of Tesuque Creek, left a second, similar-sized fork undisturbed. Nine months after the flood, samples were taken to determine if there was a difference in the number of species of mayflies (Order Ephemeroptera), stoneflies (O. Plecoptera), caddisflies (O. Trichoptera), and beetles (O. Coleoptera) living in similar-sized reaches of the two forks. Samples of the benthic community were taken at 5 m intervals with a Surber sampler, which has a 0.1 m 2 metal frame, or quadrat, and an attached net. As a stream ecologist disturbs the bottom material within the quadrat of a Surber sampler, the net trailing in the current catches benthic organisms that are dislodged. In the study of Tesuque Creek, the number of benthic insect species captured in each 0.1 m 2 sample ranged from one to six in the disturbed fork and from two to eight in the undisturbed fork. However, our question concerns the total number of species in each fork and the number of benthic samples required to make a good estimate of that number of species.
Figure 1 plots the data in a way that provides an answer to both questions. The Surber samples are plotted in the exact order they were taken, beginning with the first that was taken at the downstream end of each study reach and ending with the twelfth sample taken 55 m upstream from the first. As shown in figure 1 , each of the first few samples adds to the cumulative number of species collected at each site, which rises steeply at first and then levels off at a maximum number of species in each study reach. The cumulative number of species stopped increasing at a sample size of seven quadrats in the undisturbed study reach and at five quadrats in the disturbed study reach.
How many samples should a researcher take? In the case of the benthic community just examined, seven replicate counts from 0.1 m 2 quadrats appears to be sufficient to estimate the number of benthic mayfly, stonefly, caddisfly, and beetle species living in a short reach of a small, high-elevation stream in the Rocky Mountains. (We will revisit this study in Investigating the Evidence 16, p. 359, which concerns estimating the number of species in a community.) In contrast, to make generalizations about global patterns of rooting among plants, Schenk and Jackson (2002) reported on 475 root profiles at 209 locations (see p. 134). The number of samples necessary depends on the amount of variability in the system under study and the spatial and temporal scope of the study. However, whether the scope of a project is large or small, sample size is one of the most important components of study design.
Judging from the data displayed in figure 1 , how did disturbance by flash flooding affect the number of mayfly, stonefly, caddisfly, and beetle species living in the disturbed reach?
Unlock Deck
Unlock for access to all 12 flashcards in this deck.
Unlock Deck
k this deck
5
Leaf water potential is typically highest just before dawn and then decreases progressively through midday. Should lower leaf water potentials at midday increase or decrease the rate of water movement from soil to a plant? Assume soil water potential is approximately the same in early morning and midday. Are the water needs of the plant greater in early morning or at midday?
Unlock Deck
Unlock for access to all 12 flashcards in this deck.
Unlock Deck
k this deck
6
Compare the water budgets of the tenebrionid beetle, Onymacris, and the kangaroo rat, Dipodomys, shown in figures 5.9 and 5.10. Which of these two species obtains most of its water from metabolic water? Which relies most on condensation of fog as a water source? In which species do you see greater losses of water through the urine?
Unlock Deck
Unlock for access to all 12 flashcards in this deck.
Unlock Deck
k this deck
7
In chapter 5, we discussed water relations of tenebrionid beetles from the Namib Desert. However, members of this family also occur in moist temperate environments. How should water loss rates vary among species of tenebrionids from different environments? On what assumptions do you base your prediction? How would you test your prediction?
Unlock Deck
Unlock for access to all 12 flashcards in this deck.
Unlock Deck
k this deck
8
In the Sonoran Desert, the only insects known to evaporatively cool are cicadas. Explain how cicadas can employ evaporative cooling while hundreds of other insect species in the same environment cannot.
Unlock Deck
Unlock for access to all 12 flashcards in this deck.
Unlock Deck
k this deck
9
Many desert species are well waterproofed. Evolution cannot, however, eliminate all evaporative water loss. Why not? (Hint: Think of the kinds of exchanges that an organism must maintain with its environment.)
Unlock Deck
Unlock for access to all 12 flashcards in this deck.
Unlock Deck
k this deck
10
While we have concentrated in chapter 5 on regulation of water and salts, most marine invertebrates are isosmotic with their external environment. What is a potential benefit of being isosmotic?
Unlock Deck
Unlock for access to all 12 flashcards in this deck.
Unlock Deck
k this deck
11
Review water and salt regulation by marine and freshwater bony fish. Which of the two is hypoosmotic relative to its environment? Which of the two is hyperosmotic relative to its environment? Some sharks live in freshwater. How should the kidneys of marine and freshwater sharks function?
Unlock Deck
Unlock for access to all 12 flashcards in this deck.
Unlock Deck
k this deck
12
Ronald Neilson and his colleagues (1992, 1995) used the nvironmental requirements of plants to predict the responses of vegetation to climate change. In chapter 1, we briefly discussed the studies of Margaret Davis (1983, 1989) that reconstructed the movement of vegetation across eastern North America. She made this reconstruction using the pollen preserved in lake sediments. How might the results of paleoecological studies such as this be used to refine models based on plant environmental requirements? (Assume that you can also reasonably reconstruct the climate when historic changes in vegetation occurred.)
Unlock Deck
Unlock for access to all 12 flashcards in this deck.
Unlock Deck
k this deck
Unlock Deck
Unlock for access to all 12 flashcards in this deck.


