Deck 11: The Aggregate Expenditures Model
Full screen (f)
Question
Question
Question
Question
Question
Question
Question
Question
Question
The data in columnS1 and 2 in the accompanying table are for a private closed economy: 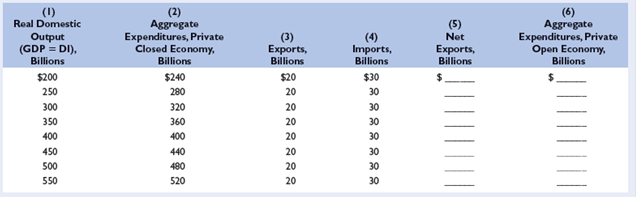
a. Use columnS1 and 2 to determine the equilibrium GDP for this hypothetical economy.
b. Now open up this economy to international trade by including the export and import figures of columnS3 and 4. Fill in columns 5 and 6 and determine the equilibrium GDP for the open economy. What is the change in equilibrium GDP caused by the addition of net exports?
c. Given the original $20 billion level of exports, what would be net exports and the equilibrium GDP if imports were $10 billion greater at each level of GDP?
d. What is the multiplier in this example?
Question
Question
Assume that, without taxes, the consumption schedule of an economy is as follows: 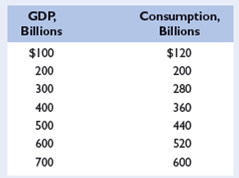
a. Graph this consumption schedule and determine the MPC.
b. Assume now that a lump-sum tax is imposed such that the government collects $10 billion in taxes at all levels of GDP. Graph the resulting consumption schedule and compare the MPC and the multiplier with those of the pretax consumption schedule.
Question
Question
Refer to columnS1 and 6 in the table for problem 5. Incorporate government into the table by assuming that it plans to tax and spend $20 billion at each possible level of GDP. Also assume that the tax is a personal tax and that government spending does not induce a shift in the private aggregate expenditures schedule. What is the change in equilibrium GDP caused by the addition of government? 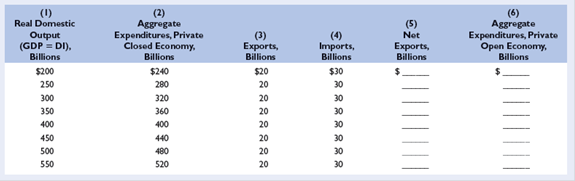
Question
Question
Question
Question
Refer to the accompanying table in answering the questions that follow: 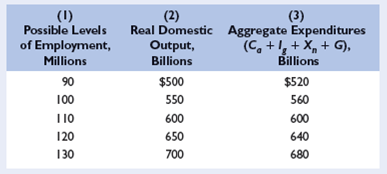
a. If full employment in this economy iS130 million, will there be an inflationary expenditure gap or a recessionary expenditure gap? What will be the consequence of this gap? By how much would aggregate expenditures in column 3 have to change at each level of GDP to eliminate the inflationary expenditure gap or the recessionary expenditure gap? What is the multiplier in this example?
b. Will there be an inflationary expenditure gap or a recessionary expenditure gap if the full-employment level of output is $500 billion? By how much would aggregate expenditures in column 3 have to change at each level of GDP to eliminate the gap? What is the multiplier in this example?
c. Assuming that investment, net exports, and government expenditures do not change with changes in real GDP, what are the sizes of the MPC, the MPS, and the multiplier?
Question
Question

Unlock Deck
Sign up to unlock the cards in this deck!
Unlock Deck
Unlock Deck
1/19
Play
Full screen (f)
Deck 11: The Aggregate Expenditures Model
1
Assuming the level of investment is $16 billion and independent of the level of total output, complete the accompanying table and determine the equilibrium levels of output and employment in this private closed economy. What are the sizes of the MPC and MPS?
Marginal propensity to consume (MPC) measures the degree of responsiveness of a change in the consumption spending due to a given change in the income of a consumer.
That is, it is the additional amount spent on consumption due to an increase in the income by an additional dollar. For this reason, MPC always lies between 0 and 1.
Marginal propensity to save (MPS) measures the degree of responsiveness of a change in the savings of a consumer for a given change in his/her income level.
That is, it is the additional number of dollars that is saved, when the income of a consumer increases by one additional dollar.
Disposable income ( Y ) consists of consumption ( C ) and saving ( S ). The following relationship holds between these components:
 The following table shows the level of savings at each GDP level (figures are in billions):
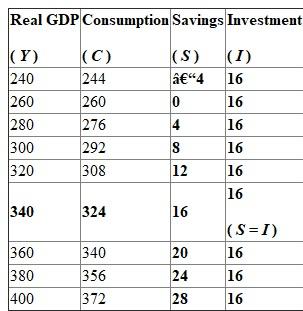 The equilibrium occurs at the point of intersection of savings and investment curves. That is, both savings and investment are equal at equilibrium.
Here, savings and investment are equal ($16 billion) at an equilibrium level of output of $340 billion. The equilibrium employment level is '65' million.
The value of MPC is calculated as follows:
 Thus, the value of MPC is 0.8. This means that the consumer spends 80 cents out of an additional dollar he/she earns.
The value of MPS is calculated as follows:
 Hence, the value of MPS is 0.2. This means that the consumer saveS20 cents out of an additional dollar he/she earns.
That is, it is the additional amount spent on consumption due to an increase in the income by an additional dollar. For this reason, MPC always lies between 0 and 1.
Marginal propensity to save (MPS) measures the degree of responsiveness of a change in the savings of a consumer for a given change in his/her income level.
That is, it is the additional number of dollars that is saved, when the income of a consumer increases by one additional dollar.
Disposable income ( Y ) consists of consumption ( C ) and saving ( S ). The following relationship holds between these components:
The following table shows the level of savings at each GDP level (figures are in billions): The equilibrium occurs at the point of intersection of savings and investment curves. That is, both savings and investment are equal at equilibrium.Here, savings and investment are equal ($16 billion) at an equilibrium level of output of $340 billion. The equilibrium employment level is '65' million.
The value of MPC is calculated as follows:
Thus, the value of MPC is 0.8. This means that the consumer spends 80 cents out of an additional dollar he/she earns.The value of MPS is calculated as follows:
Hence, the value of MPS is 0.2. This means that the consumer saveS20 cents out of an additional dollar he/she earns. 2
What is an investment schedule and how does it differ from an investment demand curve?
An investment schedule shows the amounts business firms collectively intend to invest - their planned investment - at each possible level of GDP. It does not change with GDP. An investment demand curve and the interest rate together determine the investment schedule. Investment demand is a function of interest rate.
Investment schedule differ from investment demand curve because investment schedule is constant and is a horizontal line with GDP on the horizontal axis (graph 1); whereas investment demand curve is a downward sloping line with interest rate on the vertical axis (graph 2).
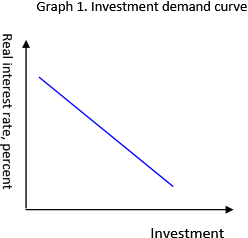

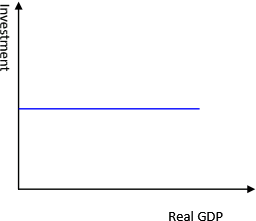
Investment schedule differ from investment demand curve because investment schedule is constant and is a horizontal line with GDP on the horizontal axis (graph 1); whereas investment demand curve is a downward sloping line with interest rate on the vertical axis (graph 2).
3
Using the consumption and saving data in probleM1 and assuming investment is $16 billion, what are saving and planned investment at the $380 billion level of domestic output? What are saving and actual investment at that level? What are saving and planned investment at the $300 billion level of domestic output? What are the levels of saving and actual investment? In which direction and by what amount will unplanned investment change as the economy moves from the $380 billion level of GDP to the equilibrium level of real GDP? From the $300 billion level of real GDP to the equilibrium level of GDP?
The level of output in an economy is a function of the consumption, investments, savings, government expenditures and net exports. A change in any of the variables brings about a cyclical change in the output and the other variables as well.
The reason for a change in the output when a change in the above mentioned factors occurs is the fact that the output produced in an economy is dependent upon how money and other resources are put to use, both by an individual and by the government.
The table mentioning the details of all levels of output at different levels of savings is shown as the one below:
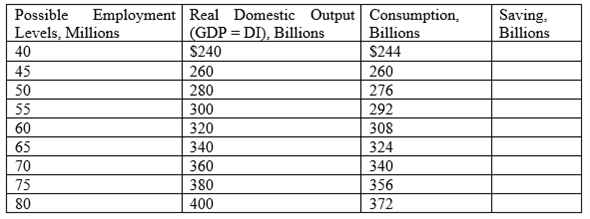 It is stated that the level of investment is at $16 billion. It is required to find the savings and planned investment at a domestic output level of $380 billion.
The output level of$380 billion has a consumption at $356 billion. The savings at this point is calculated as shown below:
 Thus, the saving at $380 billion of output is $24 billion.
The planned investment is given to be $16 billion. It is known that in an equilibrium state in the economy, savings equal investment. Also, investment is classified into planned and unplanned investment.
The planned investment is given as $16 billion in the information already provided.
Thus, the unplanned investment is estimated as shown below:
 Thus, savings of $8 billion above planned investment lead to an unplanned increase in inventories in the economy.
Thus, the actual level of investment equals actual savings at $24 billion.
At the $300 billion level of output in the economy, the consumption level is at $292 billion. Thus, the saving at this point is calculated as shown below:
 Thus, the saving at $300 billion of output is $8 billion.
The planned investment is given to be $16 billion. It is known that in an equilibrium state in the economy, savings equal investment. Also, investment is classified into planned and unplanned investment.
The planned investment is given as $16 billion in the information already provided.
Thus, the unplanned investment is estimated as shown below:
 Thus, savings of $8 billion below the planned investment lead to an unplanned decrease in inventories in the economy.
Thus, the actual level of investment equals actual savings at $8 billion.
When the economy operates at $380 billion of GDP, an unplanned increase in investments of $8 billion urges the firm to reduce production since an unplanned increase in inventories can be used up in the future and thus, the firms can afford to decrease their production at this stage when the savings are over and above planned investment.
Similarly, when the economy is operating at $300 billion of output, an unplanned decline in inventories forces firms to increase production to meet this change in inventories since the savings fall short of the level required to meet planned investment.
The reason for a change in the output when a change in the above mentioned factors occurs is the fact that the output produced in an economy is dependent upon how money and other resources are put to use, both by an individual and by the government.
The table mentioning the details of all levels of output at different levels of savings is shown as the one below:
It is stated that the level of investment is at $16 billion. It is required to find the savings and planned investment at a domestic output level of $380 billion.The output level of$380 billion has a consumption at $356 billion. The savings at this point is calculated as shown below:
Thus, the saving at $380 billion of output is $24 billion.The planned investment is given to be $16 billion. It is known that in an equilibrium state in the economy, savings equal investment. Also, investment is classified into planned and unplanned investment.
The planned investment is given as $16 billion in the information already provided.
Thus, the unplanned investment is estimated as shown below:
Thus, savings of $8 billion above planned investment lead to an unplanned increase in inventories in the economy. Thus, the actual level of investment equals actual savings at $24 billion.
At the $300 billion level of output in the economy, the consumption level is at $292 billion. Thus, the saving at this point is calculated as shown below:
Thus, the saving at $300 billion of output is $8 billion.The planned investment is given to be $16 billion. It is known that in an equilibrium state in the economy, savings equal investment. Also, investment is classified into planned and unplanned investment.
The planned investment is given as $16 billion in the information already provided.
Thus, the unplanned investment is estimated as shown below:
Thus, savings of $8 billion below the planned investment lead to an unplanned decrease in inventories in the economy. Thus, the actual level of investment equals actual savings at $8 billion.
When the economy operates at $380 billion of GDP, an unplanned increase in investments of $8 billion urges the firm to reduce production since an unplanned increase in inventories can be used up in the future and thus, the firms can afford to decrease their production at this stage when the savings are over and above planned investment.
Similarly, when the economy is operating at $300 billion of output, an unplanned decline in inventories forces firms to increase production to meet this change in inventories since the savings fall short of the level required to meet planned investment.
4
Why does equilibrium real GDP occur where C + Ig = GDP in a private closed economy? What happens to real GDP when C + Ig exceeds GDP? When C + Ig is less than GDP? What two expenditure components of real GDP are purposely excluded in a private closed economy?
Unlock Deck
Unlock for access to all 19 flashcards in this deck.
Unlock Deck
k this deck
5
By how much will GDP change if firms increase their investment by $8 billion and the MPC is.80? If the MPC is.67?
Unlock Deck
Unlock for access to all 19 flashcards in this deck.
Unlock Deck
k this deck
6
Why is saving called a leakage ? Why is planned investment called an injection ? Why must saving equal planned investment at equilibrium GDP in the private closed economy? Are unplanned changes in inventories rising, falling, or constant at equilibrium GDP? Explain.
Unlock Deck
Unlock for access to all 19 flashcards in this deck.
Unlock Deck
k this deck
7
Suppose that a certain country has an MPC of.9 and a real GDP of $400 billion. If its investment spending decreases by $4 billion, what will be its new level of real GDP?
Unlock Deck
Unlock for access to all 19 flashcards in this deck.
Unlock Deck
k this deck
8
Other things equal, what effect will each of the following changes independently have on the equilibrium level of real GDP in the private closed economy?a. A decline in the real interest rate.
b. An overall decrease in the expected rate of return on investment.
c. A sizeable, sustained increase in stock prices.
b. An overall decrease in the expected rate of return on investment.
c. A sizeable, sustained increase in stock prices.
Unlock Deck
Unlock for access to all 19 flashcards in this deck.
Unlock Deck
k this deck
9
The data in columnS1 and 2 in the accompanying table are for a private closed economy:
a. Use columnS1 and 2 to determine the equilibrium GDP for this hypothetical economy.
b. Now open up this economy to international trade by including the export and import figures of columnS3 and 4. Fill in columns 5 and 6 and determine the equilibrium GDP for the open economy. What is the change in equilibrium GDP caused by the addition of net exports?
c. Given the original $20 billion level of exports, what would be net exports and the equilibrium GDP if imports were $10 billion greater at each level of GDP?
d. What is the multiplier in this example?
Unlock Deck
Unlock for access to all 19 flashcards in this deck.
Unlock Deck
k this deck
10
Depict graphically the aggregate expenditures model for a private closed economy. Now show a decrease in the aggregate expenditures schedule and explain why the decline in real GDP in your diagram is greater than the decline in the aggregate expenditures schedule. What is the term used for the ratio of a decline in real GDP to the initial drop in aggregate expenditures?
Unlock Deck
Unlock for access to all 19 flashcards in this deck.
Unlock Deck
k this deck
11
Assume that, without taxes, the consumption schedule of an economy is as follows:
a. Graph this consumption schedule and determine the MPC.
b. Assume now that a lump-sum tax is imposed such that the government collects $10 billion in taxes at all levels of GDP. Graph the resulting consumption schedule and compare the MPC and the multiplier with those of the pretax consumption schedule.
Unlock Deck
Unlock for access to all 19 flashcards in this deck.
Unlock Deck
k this deck
12
Assuming the economy is operating below its potential output, what is the impact of an increase in net exports on real GDP? Why is it difficult, if not impossible, for a country to boost its net exports by increasing its tariffs during a global recession?
Unlock Deck
Unlock for access to all 19 flashcards in this deck.
Unlock Deck
k this deck
13
Refer to columnS1 and 6 in the table for problem 5. Incorporate government into the table by assuming that it plans to tax and spend $20 billion at each possible level of GDP. Also assume that the tax is a personal tax and that government spending does not induce a shift in the private aggregate expenditures schedule. What is the change in equilibrium GDP caused by the addition of government?
Unlock Deck
Unlock for access to all 19 flashcards in this deck.
Unlock Deck
k this deck
14
Explain graphically the determination of equilibrium GDP for a private economy through the aggregate expenditures model. Now add government purchases (any amount you choose) to your graph, showing its impact on equilibrium GDP. Finally, add taxation (any amount of lump-sum tax that you choose) to your graph and show its effect on equilibrium GDP
Unlock Deck
Unlock for access to all 19 flashcards in this deck.
Unlock Deck
k this deck
15
Advanced Analysis Assume that the consumption schedule for a private open economy is such that consumption C = 50 + 0.8 Y. Assume further that planned investment Ig and net exports Xn are independent of the level of real GDP and constant at Ig = 30 and Xn = 10. Recall also that, in equilibrium, the real output produced ( Y ) is equal to aggregate expenditures: Y = C + Ig + Xn.
Unlock Deck
Unlock for access to all 19 flashcards in this deck.
Unlock Deck
k this deck
16
What is a recessionary expenditure gap? An inflationary expenditure gap? Which is associated with a positive GDP gap? A negative GDP gap?
Unlock Deck
Unlock for access to all 19 flashcards in this deck.
Unlock Deck
k this deck
17
Refer to the accompanying table in answering the questions that follow:
a. If full employment in this economy iS130 million, will there be an inflationary expenditure gap or a recessionary expenditure gap? What will be the consequence of this gap? By how much would aggregate expenditures in column 3 have to change at each level of GDP to eliminate the inflationary expenditure gap or the recessionary expenditure gap? What is the multiplier in this example?
b. Will there be an inflationary expenditure gap or a recessionary expenditure gap if the full-employment level of output is $500 billion? By how much would aggregate expenditures in column 3 have to change at each level of GDP to eliminate the gap? What is the multiplier in this example?
c. Assuming that investment, net exports, and government expenditures do not change with changes in real GDP, what are the sizes of the MPC, the MPS, and the multiplier?
Unlock Deck
Unlock for access to all 19 flashcards in this deck.
Unlock Deck
k this deck
18
LAST WORD What is Say's law? How does it relate to the view held by classical economists that the economy generally will operate at a position on its production possibilities curve (Chapter 1)? Use production possibilities analysis to demonstrate Keynes' view on this matter.
Unlock Deck
Unlock for access to all 19 flashcards in this deck.
Unlock Deck
k this deck
19
Answer the following questions, which relate to the aggregate expenditures model:
Unlock Deck
Unlock for access to all 19 flashcards in this deck.
Unlock Deck
k this deck
Unlock Deck
Unlock for access to all 19 flashcards in this deck.


