Deck 16: General Equilibrium Theory
Full screen (f)
Question
Using the data on supply and demand in problem 1,suppose the EU imposed a tariff of 2 euros on each pound of beef.
a. How much beef would EU producers supply?
b. How much beef would EU consumers demand?
c. How much beef would the EU import?
d. How much total revenue would EU government authorities collect from the tariff?
Problem 1
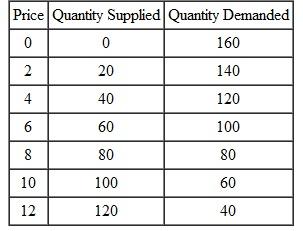
The following table provides hypothetical data about the supply and demand for beef in the European Union. The prices are in euros,and quantities are millions of pounds of beef per month. (You may wish to draw the supply and demand curves to help you visualize what is happening.)
 a. In the absence of international trade,what is the equilibrium price and quantity of beef?
b. If trade opens up,and the world price of beef is (and remains)2 euros per pound of beef,how much beef will EU producers supply? How much beef will EU consumers demand? How much beef will be imported?
c. Within the EU,who gains and who loses when trade opens up?
a. How much beef would EU producers supply?
b. How much beef would EU consumers demand?
c. How much beef would the EU import?
d. How much total revenue would EU government authorities collect from the tariff?
Problem 1
The following table provides hypothetical data about the supply and demand for beef in the European Union. The prices are in euros,and quantities are millions of pounds of beef per month. (You may wish to draw the supply and demand curves to help you visualize what is happening.)
a. In the absence of international trade,what is the equilibrium price and quantity of beef?b. If trade opens up,and the world price of beef is (and remains)2 euros per pound of beef,how much beef will EU producers supply? How much beef will EU consumers demand? How much beef will be imported?
c. Within the EU,who gains and who loses when trade opens up?
Question
Using the data on supply and demand in problem 1,suppose the EU imposed a quota on imports of beef equal to 40 million pounds of beef per month.
a. What would be the price of beef in the EU?
b. How much beef would EU producers supply?
c. How much beef would EU consumers demand?
Problem 1
The following table provides hypothetical data about the supply and demand for beef in the European Union. The prices are in euros,and quantities are millions of pounds of beef per month. (You may wish to draw the supply and demand curves to help you visualize what is happening.)
 a. In the absence of international trade,what is the equilibrium price and quantity of beef?
b. If trade opens up,and the world price of beef is (and remains)2 euros per pound of beef,how much beef will EU producers supply? How much beef will EU consumers demand? How much beef will be imported?
c. Within the EU,who gains and who loses when trade opens up?
a. What would be the price of beef in the EU?
b. How much beef would EU producers supply?
c. How much beef would EU consumers demand?
Problem 1
The following table provides hypothetical data about the supply and demand for beef in the European Union. The prices are in euros,and quantities are millions of pounds of beef per month. (You may wish to draw the supply and demand curves to help you visualize what is happening.)
a. In the absence of international trade,what is the equilibrium price and quantity of beef?b. If trade opens up,and the world price of beef is (and remains)2 euros per pound of beef,how much beef will EU producers supply? How much beef will EU consumers demand? How much beef will be imported?
c. Within the EU,who gains and who loses when trade opens up?
Question
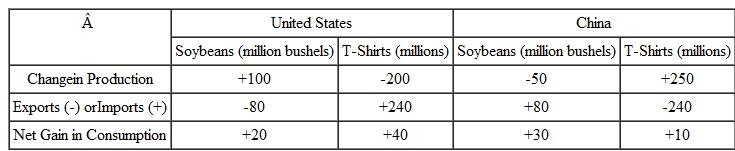
Refer to Table 1 in the chapter. Suppose the terms of trade are two and a half T-shirts for each bushel of soybeans (instead of three for one as in the chapter). As in the chapter,assume the United States increases soybean production by 100 million bushels and exports 80 million of them to China,and that China decreases its own soybean production by 50 million bushels. Some of the remaining numbers in the table will have to change to be consistent with these new specifications. Then,answer each of the following questions.
a. Does China still gain from trade? Explain briefly.
b. Does the United States still gain from trade? Explain briefly.
c. Compare the effects of trade for China under the new and old terms of trade. In which case does China fare better? Explain briefly.
d. Compare the effects of trade for the United States under the new and old terms of trade. In which case does the United States fare better? Explain briefly
Table 1
Question
Refer to Table.1 in the chapter. Suppose the terms of trade are four T-shirts for each bushel of soybeans (instead of three for one as in the chapter). Assume the United States increases soybean production by 100 million bushels and exports 60 million to China. China increases its T-shirt production by 250 million. Some of the remaining numbers in the table will have to change,to be consistent with these new specifications. Then,answer each of the following questions.
a. Does China still gain from trade? Explain briefly.
b. Does the United States still gain from trade? Explain briefly.
c. Compare the effects of trade for China under the new and old terms of trade. In which case does China fare better? Explain briefly.
d. Compare the effects of trade for the United States under the new and old terms of trade. In which case does the United States fare better? Explain briefly.
Table 1
Question
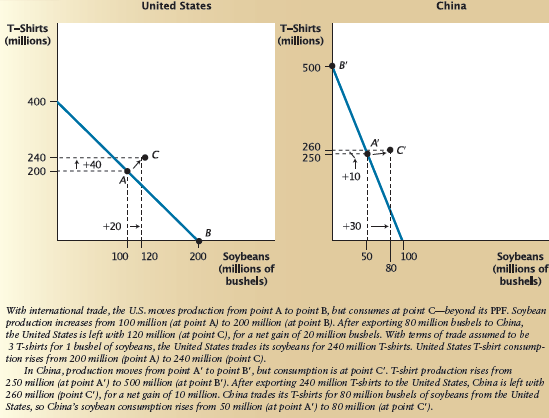
Redraw the PPFs for the United States and China from Figure 1 in the chapter. Assume that the initial production and consumption points ( A and A ?)and the new production points ( B and B ?)are the same as in that figure. Plot the new consumption points ( C and C ?)that correspond to your results from the problem (1).
Figure 1: The Gains from Specialization and Trade
Problem (1)Refer to Table 1 in the chapter. Suppose the terms of trade are four T-shirts for each bushel of soybeans (instead of three for one as in the chapter). Assume the United States increases soybean production by 100 million bushels and exports 60 million to China. China increases its T-shirt production by 250 million. Some of the remaining numbers in the table will have to change,to be consistent with these new specifications. Then,answer each of the following questions.
a. Does China still gain from trade? Explain briefly.
b. Does the United States still gain from trade? Explain briefly.
c. Compare the effects of trade for China under the new and old terms of trade. In which case does China fare better? Explain briefly.
d. Compare the effects of trade for the United States under the new and old terms of trade. In which case does the United States fare better? Explain briefly
Table 1
Question
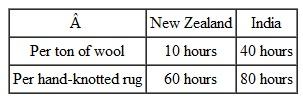
The following table shows the hypothetical labor requirements per ton of wool and per hand-knotted rug,for New Zealand and for India.
Labor Requirements per Unit
 a. Which country has an absolute advantage in each product?
b. Calculate the opportunity cost in each country for each of the two products. Which country has a comparative advantage in each product?
c. If India produces one more rug and exports it to New Zealand,what is the lowest price (measured in tons of wool)that it would accept? What is the highest price that New Zealand would pay? Within what range will the equilibrium terms of trade lie?
Labor Requirements per Unit
a. Which country has an absolute advantage in each product?b. Calculate the opportunity cost in each country for each of the two products. Which country has a comparative advantage in each product?
c. If India produces one more rug and exports it to New Zealand,what is the lowest price (measured in tons of wool)that it would accept? What is the highest price that New Zealand would pay? Within what range will the equilibrium terms of trade lie?
Question
Using the data from problem 1,suppose that New Zealand has 300 million hours of labor per period,while India has 800 million hours.
a. Draw PPFs for both countries for the two goods (put quantity of wool on the vertical axis).
b. Suppose that,before trade,each country uses half of its labor to produce wool and half to produce rugs. Locate each country's production point on its PPF (label it A for New Zealand,and A ? for India).
c. After trade opens up and each country completely specializes in its comparative advantage good,locate each country's production point on its PPF (label it B for New Zealand,and B ? for India)Problem 1
The following table shows the hypothetical labor requirements per ton of wool and per hand-knotted rug,for New Zealand and for India.
Labor Requirements per Unit
 a. Which country has an absolute advantage in each product?
b. Calculate the opportunity cost in each country for each of the two products. Which country has a comparative advantage in each product?
c. If India produces one more rug and exports it to New Zealand,what is the lowest price (measured in tons of wool)that it would accept? What is the highest price that New Zealand would pay? Within what range will the equilibrium terms of trade lie?
a. Draw PPFs for both countries for the two goods (put quantity of wool on the vertical axis).
b. Suppose that,before trade,each country uses half of its labor to produce wool and half to produce rugs. Locate each country's production point on its PPF (label it A for New Zealand,and A ? for India).
c. After trade opens up and each country completely specializes in its comparative advantage good,locate each country's production point on its PPF (label it B for New Zealand,and B ? for India)Problem 1
The following table shows the hypothetical labor requirements per ton of wool and per hand-knotted rug,for New Zealand and for India.
Labor Requirements per Unit
a. Which country has an absolute advantage in each product?b. Calculate the opportunity cost in each country for each of the two products. Which country has a comparative advantage in each product?
c. If India produces one more rug and exports it to New Zealand,what is the lowest price (measured in tons of wool)that it would accept? What is the highest price that New Zealand would pay? Within what range will the equilibrium terms of trade lie?
Question
This problem uses the data from problem 1,and the graphs you drew in problem 10. Suppose that the terms of trade end up at 4 tons of wool for 1 hand-knotted rug. Suppose,too,that New Zealand decides to export 12 million tons of wool to India.
a. How many rugs will New Zealand import from India?
b. What will be New Zealand's consumption of each good after trade?
c. What will be India's consumption of each good after trade?
d. On the PPFs you drew for problem 2,plot each country's consumption point after trade. Label it C for New Zealand,and C ? for India
Problem 1
The following table shows the hypothetical labor requirements per ton of wool and per hand-knotted rug,for New Zealand and for India.
Labor Requirements per Unit
 a. Which country has an absolute advantage in each product?
b. Calculate the opportunity cost in each country for each of the two products. Which country has a comparative advantage in each product?
c. If India produces one more rug and exports it to New Zealand,what is the lowest price (measured in tons of wool)that it would accept? What is the highest price that New Zealand would pay? Within what range will the equilibrium terms of trade lie?
Problem 2
Using the data from problem 1,suppose that New Zealand has 300 million hours of labor per period,while India has 800 million hours.
a. Draw PPFs for both countries for the two goods (put quantity of wool on the vertical axis).
b. Suppose that,before trade,each country uses half of its labor to produce wool and half to produce rugs. Locate each country's production point on its PPF (label it A for New Zealand,and A ? for India).
c. After trade opens up and each country completely specializes in its comparative advantage good,locate each country's production point on its PPF (label it B for New Zealand,and B ? for India)
a. How many rugs will New Zealand import from India?
b. What will be New Zealand's consumption of each good after trade?
c. What will be India's consumption of each good after trade?
d. On the PPFs you drew for problem 2,plot each country's consumption point after trade. Label it C for New Zealand,and C ? for India
Problem 1
The following table shows the hypothetical labor requirements per ton of wool and per hand-knotted rug,for New Zealand and for India.
Labor Requirements per Unit
a. Which country has an absolute advantage in each product?b. Calculate the opportunity cost in each country for each of the two products. Which country has a comparative advantage in each product?
c. If India produces one more rug and exports it to New Zealand,what is the lowest price (measured in tons of wool)that it would accept? What is the highest price that New Zealand would pay? Within what range will the equilibrium terms of trade lie?
Problem 2
Using the data from problem 1,suppose that New Zealand has 300 million hours of labor per period,while India has 800 million hours.
a. Draw PPFs for both countries for the two goods (put quantity of wool on the vertical axis).
b. Suppose that,before trade,each country uses half of its labor to produce wool and half to produce rugs. Locate each country's production point on its PPF (label it A for New Zealand,and A ? for India).
c. After trade opens up and each country completely specializes in its comparative advantage good,locate each country's production point on its PPF (label it B for New Zealand,and B ? for India)
Question
In Figures 1 and 2,we assumed that the world price of a good was fixed,and not affected by the quantity of imports a country chooses. But if a country is large relative to the world market,its imports can influence the world price.
Suppose the market for good X involves only two large countries (A and B),with supply and demand schedules as shown below:
Country A Country B
![In Figures 1 and 2,we assumed that the world price of a good was fixed,and not affected by the quantity of imports a country chooses. But if a country is large relative to the world market,its imports can influence the world price. Suppose the market for good X involves only two large countries (A and B),with supply and demand schedules as shown below: Country A Country B a. Plot the supply and demand curves for each country. b. Before international trade,what is the equilibrium price and quantity in each country? For the remaining questions,assume that the two countries can trade in good X. c. Which country will export good X? d. What will be the equilibrium world price? [Hint: This will be the price at which the quantity of exports from one country equals the quantity of imports to the other.] e. What will happen to production and consumption in Country A? f. What will happen to production and consumption in Country B? g. What quantity will be exported (and also imported)in equilibrium? h. On your graph,label the new levels of production and consumption in each country,as well as distances representing exports and imports Figure 1: The Impact of Imports on Consumers and Producers Figure 2: The Effects of a Tariff <div style=padding-top: 35px>](https://d2lvgg3v3hfg70.cloudfront.net/SM3044/11eb872f_ac97_bc59_a220_89b4eb6a1f3c_SM3044_00.jpg) a. Plot the supply and demand curves for each country.
a. Plot the supply and demand curves for each country.
b. Before international trade,what is the equilibrium price and quantity in each country? For the remaining questions,assume that the two countries can trade in good X.
c. Which country will export good X?
d. What will be the equilibrium world price? [Hint: This will be the price at which the quantity of exports from one country equals the quantity of imports to the other.]
e. What will happen to production and consumption in Country A?
f. What will happen to production and consumption in Country B?
g. What quantity will be exported (and also imported)in equilibrium?
h. On your graph,label the new levels of production and consumption in each country,as well as distances representing exports and imports
Figure 1: The Impact of Imports on Consumers and Producers
![In Figures 1 and 2,we assumed that the world price of a good was fixed,and not affected by the quantity of imports a country chooses. But if a country is large relative to the world market,its imports can influence the world price. Suppose the market for good X involves only two large countries (A and B),with supply and demand schedules as shown below: Country A Country B a. Plot the supply and demand curves for each country. b. Before international trade,what is the equilibrium price and quantity in each country? For the remaining questions,assume that the two countries can trade in good X. c. Which country will export good X? d. What will be the equilibrium world price? [Hint: This will be the price at which the quantity of exports from one country equals the quantity of imports to the other.] e. What will happen to production and consumption in Country A? f. What will happen to production and consumption in Country B? g. What quantity will be exported (and also imported)in equilibrium? h. On your graph,label the new levels of production and consumption in each country,as well as distances representing exports and imports Figure 1: The Impact of Imports on Consumers and Producers Figure 2: The Effects of a Tariff <div style=padding-top: 35px>](https://d2lvgg3v3hfg70.cloudfront.net/SM3044/11eb872f_ac97_bc5a_a220_49a22d9272dd_SM3044_00.jpg)
Figure 2: The Effects of a Tariff
![In Figures 1 and 2,we assumed that the world price of a good was fixed,and not affected by the quantity of imports a country chooses. But if a country is large relative to the world market,its imports can influence the world price. Suppose the market for good X involves only two large countries (A and B),with supply and demand schedules as shown below: Country A Country B a. Plot the supply and demand curves for each country. b. Before international trade,what is the equilibrium price and quantity in each country? For the remaining questions,assume that the two countries can trade in good X. c. Which country will export good X? d. What will be the equilibrium world price? [Hint: This will be the price at which the quantity of exports from one country equals the quantity of imports to the other.] e. What will happen to production and consumption in Country A? f. What will happen to production and consumption in Country B? g. What quantity will be exported (and also imported)in equilibrium? h. On your graph,label the new levels of production and consumption in each country,as well as distances representing exports and imports Figure 1: The Impact of Imports on Consumers and Producers Figure 2: The Effects of a Tariff <div style=padding-top: 35px>](https://d2lvgg3v3hfg70.cloudfront.net/SM3044/11eb872f_ac97_e36b_a220_1d68b842fb30_SM3044_00.jpg)
Suppose the market for good X involves only two large countries (A and B),with supply and demand schedules as shown below:
Country A Country B
a. Plot the supply and demand curves for each country.b. Before international trade,what is the equilibrium price and quantity in each country? For the remaining questions,assume that the two countries can trade in good X.
c. Which country will export good X?
d. What will be the equilibrium world price? [Hint: This will be the price at which the quantity of exports from one country equals the quantity of imports to the other.]
e. What will happen to production and consumption in Country A?
f. What will happen to production and consumption in Country B?
g. What quantity will be exported (and also imported)in equilibrium?
h. On your graph,label the new levels of production and consumption in each country,as well as distances representing exports and imports
Figure 1: The Impact of Imports on Consumers and Producers
Figure 2: The Effects of a Tariff
Question
Suppose that the costs of production of winter hats and wheat in two countries are as follows:
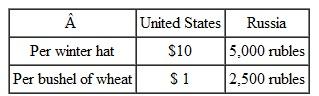 a. What is the opportunity cost of producing one more winter hat in the United States? In Russia?
b. What is the opportunity cost of producing one more bushel of wheat in the United States? In Russia?
c. Which country has a comparative advantage in winter hats? In wheat?
a. What is the opportunity cost of producing one more winter hat in the United States? In Russia?b. What is the opportunity cost of producing one more bushel of wheat in the United States? In Russia?
c. Which country has a comparative advantage in winter hats? In wheat?
Question
Suppose that the Marshall Islands does not trade with the outside world. It has a competitive domestic market for TV sets. The market supply and demand curves are reflected in this table:
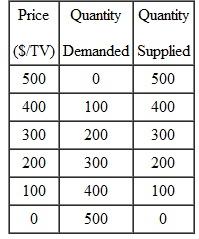 a. Plot the supply and demand curves and determine the domestic equilibrium price and quantity.
b. Suddenly,the islanders discover the virtues of free exchange and begin trading with the outside world. The Marshall Islands is a very small country,and so its trading has no effect on the price established in the world market. It can import as many TVs as it wishes at the world price of $100 per TV. In this situation,how many TVs will be purchased in the Marshall Islands? How many will be produced there? How many will be imported?
c. After protests from domestic producers,the government decides to impose a tariff of $100 per imported TV. Now how many TVs will be purchased in the Marshall Islands? How many will be produced there? How many will be imported?
d. What is the government's revenue from the tariff described in part (c)?
e. Compare the effect of the tariff described in part (c)with a quota that limits imports to 100 TVs per year
a. Plot the supply and demand curves and determine the domestic equilibrium price and quantity.b. Suddenly,the islanders discover the virtues of free exchange and begin trading with the outside world. The Marshall Islands is a very small country,and so its trading has no effect on the price established in the world market. It can import as many TVs as it wishes at the world price of $100 per TV. In this situation,how many TVs will be purchased in the Marshall Islands? How many will be produced there? How many will be imported?
c. After protests from domestic producers,the government decides to impose a tariff of $100 per imported TV. Now how many TVs will be purchased in the Marshall Islands? How many will be produced there? How many will be imported?
d. What is the government's revenue from the tariff described in part (c)?
e. Compare the effect of the tariff described in part (c)with a quota that limits imports to 100 TVs per year
Question
The following table provides hypothetical data about the supply and demand for beef in the European Union. The prices are in euros,and quantities are millions of pounds of beef per month. (You may wish to draw the supply and demand curves to help you visualize what is happening.)
 a. In the absence of international trade,what is the equilibrium price and quantity of beef?
b. If trade opens up,and the world price of beef is (and remains)2 euros per pound of beef,how much beef will EU producers supply? How much beef will EU consumers demand? How much beef will be imported?
c. Within the EU,who gains and who loses when trade opens up?
a. In the absence of international trade,what is the equilibrium price and quantity of beef?b. If trade opens up,and the world price of beef is (and remains)2 euros per pound of beef,how much beef will EU producers supply? How much beef will EU consumers demand? How much beef will be imported?
c. Within the EU,who gains and who loses when trade opens up?

Unlock Deck
Sign up to unlock the cards in this deck!
Unlock Deck
Unlock Deck
1/12
Play
Full screen (f)
Deck 16: General Equilibrium Theory
1
Using the data on supply and demand in problem 1,suppose the EU imposed a tariff of 2 euros on each pound of beef.
a. How much beef would EU producers supply?
b. How much beef would EU consumers demand?
c. How much beef would the EU import?
d. How much total revenue would EU government authorities collect from the tariff?
Problem 1
The following table provides hypothetical data about the supply and demand for beef in the European Union. The prices are in euros,and quantities are millions of pounds of beef per month. (You may wish to draw the supply and demand curves to help you visualize what is happening.)
a. In the absence of international trade,what is the equilibrium price and quantity of beef?
b. If trade opens up,and the world price of beef is (and remains)2 euros per pound of beef,how much beef will EU producers supply? How much beef will EU consumers demand? How much beef will be imported?
c. Within the EU,who gains and who loses when trade opens up?
a. How much beef would EU producers supply?
b. How much beef would EU consumers demand?
c. How much beef would the EU import?
d. How much total revenue would EU government authorities collect from the tariff?
Problem 1
The following table provides hypothetical data about the supply and demand for beef in the European Union. The prices are in euros,and quantities are millions of pounds of beef per month. (You may wish to draw the supply and demand curves to help you visualize what is happening.)
a. In the absence of international trade,what is the equilibrium price and quantity of beef?b. If trade opens up,and the world price of beef is (and remains)2 euros per pound of beef,how much beef will EU producers supply? How much beef will EU consumers demand? How much beef will be imported?
c. Within the EU,who gains and who loses when trade opens up?
a)When the tariff of €2 is imposed,then the domestic price is raised by the amount of tariff. So the new price is €4 per pound of beef and at this price the quantity demanded is 120 million pounds and the quantity supplied is only 40 million pounds.
Hence,EU producers will be producing only 40 million pounds of beef.
b)As mentioned,an imposition of a beef tariff of €2 will increase the domestic price by the amount of tariff. So the new price will be €4 per pound of beef and at this price EU consumers will demand 120 millions of pounds of beef.
c)When the tariff of €2 is imposed,the new price is €4 per pound of beef and at this price the quantity demanded is 120 million pounds and the quantity supplied is only 40 million pounds. So to cater this excess demand,a total of 80 million pounds of beef will be imported.
d)Government earns a revenue from imposition of tariff. Note that the quantity of imported beef is 80 million pounds and a tariff of €2 is charged by the government. Hence,the total amount of tariff generated is €160 million. This is the amount earned by government
2
Using the data on supply and demand in problem 1,suppose the EU imposed a quota on imports of beef equal to 40 million pounds of beef per month.
a. What would be the price of beef in the EU?
b. How much beef would EU producers supply?
c. How much beef would EU consumers demand?
Problem 1
The following table provides hypothetical data about the supply and demand for beef in the European Union. The prices are in euros,and quantities are millions of pounds of beef per month. (You may wish to draw the supply and demand curves to help you visualize what is happening.)
a. In the absence of international trade,what is the equilibrium price and quantity of beef?
b. If trade opens up,and the world price of beef is (and remains)2 euros per pound of beef,how much beef will EU producers supply? How much beef will EU consumers demand? How much beef will be imported?
c. Within the EU,who gains and who loses when trade opens up?
a. What would be the price of beef in the EU?
b. How much beef would EU producers supply?
c. How much beef would EU consumers demand?
Problem 1
The following table provides hypothetical data about the supply and demand for beef in the European Union. The prices are in euros,and quantities are millions of pounds of beef per month. (You may wish to draw the supply and demand curves to help you visualize what is happening.)
a. In the absence of international trade,what is the equilibrium price and quantity of beef?b. If trade opens up,and the world price of beef is (and remains)2 euros per pound of beef,how much beef will EU producers supply? How much beef will EU consumers demand? How much beef will be imported?
c. Within the EU,who gains and who loses when trade opens up?
The demand for and supply of beef in EU determines the equilibrium quantity and price. The quantity and price in the domestic market is determined by equilibrating quantity demanded and supplied. This occurs when the price of a pound of beef is determined at €8. At this price,the quantity demanded and supplied are equal to 80 million pounds.
a)When the trade is allowed,world price becomes domestic price. Assume that EU has to accept the world market price of a pound of beef which is fixed at €2. Note that this price is lower than the domestic price so that the world price of €2 per pound becomes the domestic market price.
At this price,the quantity demanded is 140 million pounds and the quantity supplied is only 20 million pounds. So there is an excess demand of 100 million pounds. But only 40 million pounds of beef is allowed to import. Hence,a total of 40 million pounds of beef is imported which raises the domestic price to €6 per pound. At this price domestic supply is 60 million pounds and imports are 40 million pounds,together catering a demand of 100 million pounds of beef.
b)As mentioned,at the world price of €2,the quantity demanded is 140 million pounds and the quantity supplied is only 20 million pounds. But only 40 million pounds of beef is allowed to import. This raises the domestic price to €6 per pound. At this price domestic supply is 60 million pounds
c)Again,at the world price of €2,the quantity demanded by consumers is 140 million pounds and the quantity supplied by domestic producers is only 20 million pounds. But only 40 million pounds of beef is allowed to import under quota. This raises the domestic price to €6 per pound. At this new price,the consumers demand 100 million pounds of beef.
3
Refer to Table 1 in the chapter. Suppose the terms of trade are two and a half T-shirts for each bushel of soybeans (instead of three for one as in the chapter). As in the chapter,assume the United States increases soybean production by 100 million bushels and exports 80 million of them to China,and that China decreases its own soybean production by 50 million bushels. Some of the remaining numbers in the table will have to change to be consistent with these new specifications. Then,answer each of the following questions.
a. Does China still gain from trade? Explain briefly.
b. Does the United States still gain from trade? Explain briefly.
c. Compare the effects of trade for China under the new and old terms of trade. In which case does China fare better? Explain briefly.
d. Compare the effects of trade for the United States under the new and old terms of trade. In which case does the United States fare better? Explain briefly
Table 1
When country U and country C trade with each other,country U increases its soybean production by 100 million bushels and exports 80 million bushels to country C. Country C in turn,decreases the production of soybeans as it imports 80 million bushels from country U.
Against it,with the new terms of trade being 2.5,country U decreases its T-shirts' production by 200 million and now imports 200 million T-shirts according to its terms of trade (2.5*exports = 200)from country C. Country C in turn,since importing 80 million bushels of soybeans,must be exporting 2.5*times its imports due to a changed in terms of trade. So it increases the production of T-shirts to export 200 million to Country U.
a)Country C exports 200 million of T-shirts to Country U and is still left with 50 million. It imports 80 million bushels of soybean from Country U so it has more soybeans and more T-shirts for its consumers. Hence Country C gains from trade by attaining specialization in production of T-shirts.
b)As mentioned,country U imports 200 million of T-shirts from Country C so there is no net gains. It exports 80 million bushels of soybean to Country C and is still left with 20 million bushels so it has more soybeans for its consumers. Hence Country U gains from trade by attaining specialization in production of Soybeans.
c)When the terms of trade was three,Country C had 30 million bushels of soybeans and 10 million T-shirts as a result of trade. When the terms of trade reduces to 2.5,Country C has 30 million bushels of soybeans and but now it has 50 million T-shirts. Hence Country C is better off in new terms of trade.
d)For country U,the old terms of trade were much better. When the terms of trade was three,Country U had 20 million bushels of soybeans and 40 million T-shirts as a result of trade. When the terms of trade reduces to 2.5,Country U has 20 million bushels of soybeans and but now it has no additional T-shirts for domestic buyers. Hence Country U is better off in old terms of trade.
4
Refer to Table.1 in the chapter. Suppose the terms of trade are four T-shirts for each bushel of soybeans (instead of three for one as in the chapter). Assume the United States increases soybean production by 100 million bushels and exports 60 million to China. China increases its T-shirt production by 250 million. Some of the remaining numbers in the table will have to change,to be consistent with these new specifications. Then,answer each of the following questions.
a. Does China still gain from trade? Explain briefly.
b. Does the United States still gain from trade? Explain briefly.
c. Compare the effects of trade for China under the new and old terms of trade. In which case does China fare better? Explain briefly.
d. Compare the effects of trade for the United States under the new and old terms of trade. In which case does the United States fare better? Explain briefly.
Table 1
a. Does China still gain from trade? Explain briefly.
b. Does the United States still gain from trade? Explain briefly.
c. Compare the effects of trade for China under the new and old terms of trade. In which case does China fare better? Explain briefly.
d. Compare the effects of trade for the United States under the new and old terms of trade. In which case does the United States fare better? Explain briefly.
Table 1
Unlock Deck
Unlock for access to all 12 flashcards in this deck.
Unlock Deck
k this deck
5
Redraw the PPFs for the United States and China from Figure 1 in the chapter. Assume that the initial production and consumption points ( A and A ?)and the new production points ( B and B ?)are the same as in that figure. Plot the new consumption points ( C and C ?)that correspond to your results from the problem (1).
Figure 1: The Gains from Specialization and Trade
Problem (1)Refer to Table 1 in the chapter. Suppose the terms of trade are four T-shirts for each bushel of soybeans (instead of three for one as in the chapter). Assume the United States increases soybean production by 100 million bushels and exports 60 million to China. China increases its T-shirt production by 250 million. Some of the remaining numbers in the table will have to change,to be consistent with these new specifications. Then,answer each of the following questions.
a. Does China still gain from trade? Explain briefly.
b. Does the United States still gain from trade? Explain briefly.
c. Compare the effects of trade for China under the new and old terms of trade. In which case does China fare better? Explain briefly.
d. Compare the effects of trade for the United States under the new and old terms of trade. In which case does the United States fare better? Explain briefly
Table 1
Unlock Deck
Unlock for access to all 12 flashcards in this deck.
Unlock Deck
k this deck
6
The following table shows the hypothetical labor requirements per ton of wool and per hand-knotted rug,for New Zealand and for India.
Labor Requirements per Unit
a. Which country has an absolute advantage in each product?
b. Calculate the opportunity cost in each country for each of the two products. Which country has a comparative advantage in each product?
c. If India produces one more rug and exports it to New Zealand,what is the lowest price (measured in tons of wool)that it would accept? What is the highest price that New Zealand would pay? Within what range will the equilibrium terms of trade lie?
Labor Requirements per Unit
a. Which country has an absolute advantage in each product?b. Calculate the opportunity cost in each country for each of the two products. Which country has a comparative advantage in each product?
c. If India produces one more rug and exports it to New Zealand,what is the lowest price (measured in tons of wool)that it would accept? What is the highest price that New Zealand would pay? Within what range will the equilibrium terms of trade lie?
Unlock Deck
Unlock for access to all 12 flashcards in this deck.
Unlock Deck
k this deck
7
Using the data from problem 1,suppose that New Zealand has 300 million hours of labor per period,while India has 800 million hours.
a. Draw PPFs for both countries for the two goods (put quantity of wool on the vertical axis).
b. Suppose that,before trade,each country uses half of its labor to produce wool and half to produce rugs. Locate each country's production point on its PPF (label it A for New Zealand,and A ? for India).
c. After trade opens up and each country completely specializes in its comparative advantage good,locate each country's production point on its PPF (label it B for New Zealand,and B ? for India)Problem 1
The following table shows the hypothetical labor requirements per ton of wool and per hand-knotted rug,for New Zealand and for India.
Labor Requirements per Unit
a. Which country has an absolute advantage in each product?
b. Calculate the opportunity cost in each country for each of the two products. Which country has a comparative advantage in each product?
c. If India produces one more rug and exports it to New Zealand,what is the lowest price (measured in tons of wool)that it would accept? What is the highest price that New Zealand would pay? Within what range will the equilibrium terms of trade lie?
a. Draw PPFs for both countries for the two goods (put quantity of wool on the vertical axis).
b. Suppose that,before trade,each country uses half of its labor to produce wool and half to produce rugs. Locate each country's production point on its PPF (label it A for New Zealand,and A ? for India).
c. After trade opens up and each country completely specializes in its comparative advantage good,locate each country's production point on its PPF (label it B for New Zealand,and B ? for India)Problem 1
The following table shows the hypothetical labor requirements per ton of wool and per hand-knotted rug,for New Zealand and for India.
Labor Requirements per Unit
a. Which country has an absolute advantage in each product?b. Calculate the opportunity cost in each country for each of the two products. Which country has a comparative advantage in each product?
c. If India produces one more rug and exports it to New Zealand,what is the lowest price (measured in tons of wool)that it would accept? What is the highest price that New Zealand would pay? Within what range will the equilibrium terms of trade lie?
Unlock Deck
Unlock for access to all 12 flashcards in this deck.
Unlock Deck
k this deck
8
This problem uses the data from problem 1,and the graphs you drew in problem 10. Suppose that the terms of trade end up at 4 tons of wool for 1 hand-knotted rug. Suppose,too,that New Zealand decides to export 12 million tons of wool to India.
a. How many rugs will New Zealand import from India?
b. What will be New Zealand's consumption of each good after trade?
c. What will be India's consumption of each good after trade?
d. On the PPFs you drew for problem 2,plot each country's consumption point after trade. Label it C for New Zealand,and C ? for India
Problem 1
The following table shows the hypothetical labor requirements per ton of wool and per hand-knotted rug,for New Zealand and for India.
Labor Requirements per Unit
a. Which country has an absolute advantage in each product?
b. Calculate the opportunity cost in each country for each of the two products. Which country has a comparative advantage in each product?
c. If India produces one more rug and exports it to New Zealand,what is the lowest price (measured in tons of wool)that it would accept? What is the highest price that New Zealand would pay? Within what range will the equilibrium terms of trade lie?
Problem 2
Using the data from problem 1,suppose that New Zealand has 300 million hours of labor per period,while India has 800 million hours.
a. Draw PPFs for both countries for the two goods (put quantity of wool on the vertical axis).
b. Suppose that,before trade,each country uses half of its labor to produce wool and half to produce rugs. Locate each country's production point on its PPF (label it A for New Zealand,and A ? for India).
c. After trade opens up and each country completely specializes in its comparative advantage good,locate each country's production point on its PPF (label it B for New Zealand,and B ? for India)
a. How many rugs will New Zealand import from India?
b. What will be New Zealand's consumption of each good after trade?
c. What will be India's consumption of each good after trade?
d. On the PPFs you drew for problem 2,plot each country's consumption point after trade. Label it C for New Zealand,and C ? for India
Problem 1
The following table shows the hypothetical labor requirements per ton of wool and per hand-knotted rug,for New Zealand and for India.
Labor Requirements per Unit
a. Which country has an absolute advantage in each product?b. Calculate the opportunity cost in each country for each of the two products. Which country has a comparative advantage in each product?
c. If India produces one more rug and exports it to New Zealand,what is the lowest price (measured in tons of wool)that it would accept? What is the highest price that New Zealand would pay? Within what range will the equilibrium terms of trade lie?
Problem 2
Using the data from problem 1,suppose that New Zealand has 300 million hours of labor per period,while India has 800 million hours.
a. Draw PPFs for both countries for the two goods (put quantity of wool on the vertical axis).
b. Suppose that,before trade,each country uses half of its labor to produce wool and half to produce rugs. Locate each country's production point on its PPF (label it A for New Zealand,and A ? for India).
c. After trade opens up and each country completely specializes in its comparative advantage good,locate each country's production point on its PPF (label it B for New Zealand,and B ? for India)
Unlock Deck
Unlock for access to all 12 flashcards in this deck.
Unlock Deck
k this deck
9
In Figures 1 and 2,we assumed that the world price of a good was fixed,and not affected by the quantity of imports a country chooses. But if a country is large relative to the world market,its imports can influence the world price.
Suppose the market for good X involves only two large countries (A and B),with supply and demand schedules as shown below:
Country A Country B
a. Plot the supply and demand curves for each country.
b. Before international trade,what is the equilibrium price and quantity in each country? For the remaining questions,assume that the two countries can trade in good X.
c. Which country will export good X?
d. What will be the equilibrium world price? [Hint: This will be the price at which the quantity of exports from one country equals the quantity of imports to the other.]
e. What will happen to production and consumption in Country A?
f. What will happen to production and consumption in Country B?
g. What quantity will be exported (and also imported)in equilibrium?
h. On your graph,label the new levels of production and consumption in each country,as well as distances representing exports and imports
Figure 1: The Impact of Imports on Consumers and Producers
Figure 2: The Effects of a Tariff
Suppose the market for good X involves only two large countries (A and B),with supply and demand schedules as shown below:
Country A Country B
a. Plot the supply and demand curves for each country.b. Before international trade,what is the equilibrium price and quantity in each country? For the remaining questions,assume that the two countries can trade in good X.
c. Which country will export good X?
d. What will be the equilibrium world price? [Hint: This will be the price at which the quantity of exports from one country equals the quantity of imports to the other.]
e. What will happen to production and consumption in Country A?
f. What will happen to production and consumption in Country B?
g. What quantity will be exported (and also imported)in equilibrium?
h. On your graph,label the new levels of production and consumption in each country,as well as distances representing exports and imports
Figure 1: The Impact of Imports on Consumers and Producers
Figure 2: The Effects of a Tariff
Unlock Deck
Unlock for access to all 12 flashcards in this deck.
Unlock Deck
k this deck
10
Suppose that the costs of production of winter hats and wheat in two countries are as follows:
a. What is the opportunity cost of producing one more winter hat in the United States? In Russia?
b. What is the opportunity cost of producing one more bushel of wheat in the United States? In Russia?
c. Which country has a comparative advantage in winter hats? In wheat?
a. What is the opportunity cost of producing one more winter hat in the United States? In Russia?b. What is the opportunity cost of producing one more bushel of wheat in the United States? In Russia?
c. Which country has a comparative advantage in winter hats? In wheat?
Unlock Deck
Unlock for access to all 12 flashcards in this deck.
Unlock Deck
k this deck
11
Suppose that the Marshall Islands does not trade with the outside world. It has a competitive domestic market for TV sets. The market supply and demand curves are reflected in this table:
a. Plot the supply and demand curves and determine the domestic equilibrium price and quantity.
b. Suddenly,the islanders discover the virtues of free exchange and begin trading with the outside world. The Marshall Islands is a very small country,and so its trading has no effect on the price established in the world market. It can import as many TVs as it wishes at the world price of $100 per TV. In this situation,how many TVs will be purchased in the Marshall Islands? How many will be produced there? How many will be imported?
c. After protests from domestic producers,the government decides to impose a tariff of $100 per imported TV. Now how many TVs will be purchased in the Marshall Islands? How many will be produced there? How many will be imported?
d. What is the government's revenue from the tariff described in part (c)?
e. Compare the effect of the tariff described in part (c)with a quota that limits imports to 100 TVs per year
a. Plot the supply and demand curves and determine the domestic equilibrium price and quantity.b. Suddenly,the islanders discover the virtues of free exchange and begin trading with the outside world. The Marshall Islands is a very small country,and so its trading has no effect on the price established in the world market. It can import as many TVs as it wishes at the world price of $100 per TV. In this situation,how many TVs will be purchased in the Marshall Islands? How many will be produced there? How many will be imported?
c. After protests from domestic producers,the government decides to impose a tariff of $100 per imported TV. Now how many TVs will be purchased in the Marshall Islands? How many will be produced there? How many will be imported?
d. What is the government's revenue from the tariff described in part (c)?
e. Compare the effect of the tariff described in part (c)with a quota that limits imports to 100 TVs per year
Unlock Deck
Unlock for access to all 12 flashcards in this deck.
Unlock Deck
k this deck
12
The following table provides hypothetical data about the supply and demand for beef in the European Union. The prices are in euros,and quantities are millions of pounds of beef per month. (You may wish to draw the supply and demand curves to help you visualize what is happening.)
a. In the absence of international trade,what is the equilibrium price and quantity of beef?
b. If trade opens up,and the world price of beef is (and remains)2 euros per pound of beef,how much beef will EU producers supply? How much beef will EU consumers demand? How much beef will be imported?
c. Within the EU,who gains and who loses when trade opens up?
a. In the absence of international trade,what is the equilibrium price and quantity of beef?b. If trade opens up,and the world price of beef is (and remains)2 euros per pound of beef,how much beef will EU producers supply? How much beef will EU consumers demand? How much beef will be imported?
c. Within the EU,who gains and who loses when trade opens up?
Unlock Deck
Unlock for access to all 12 flashcards in this deck.
Unlock Deck
k this deck
Unlock Deck
Unlock for access to all 12 flashcards in this deck.


