Deck 12: Overview of Fixed-Income Portfolio Management
Full screen (f)
Question
The following information relates to Questions 1-6
Cécile Perreaux is a junior analyst for an international wealth management firm. her supervi-sor, Margit daasvand, asks Perreaux to evaluate three fixed-income funds as part of the firm's global fixed-income offerings. Selected financial data for the funds aschel, Permot, and rosaiso are presented in exhibit 1. in Perreaux's initial review, she assumes that there is no reinvestment income and that the yield curve remains unchanged.
EXHIBIT 1 Selected Data on Fixed-Income Funds
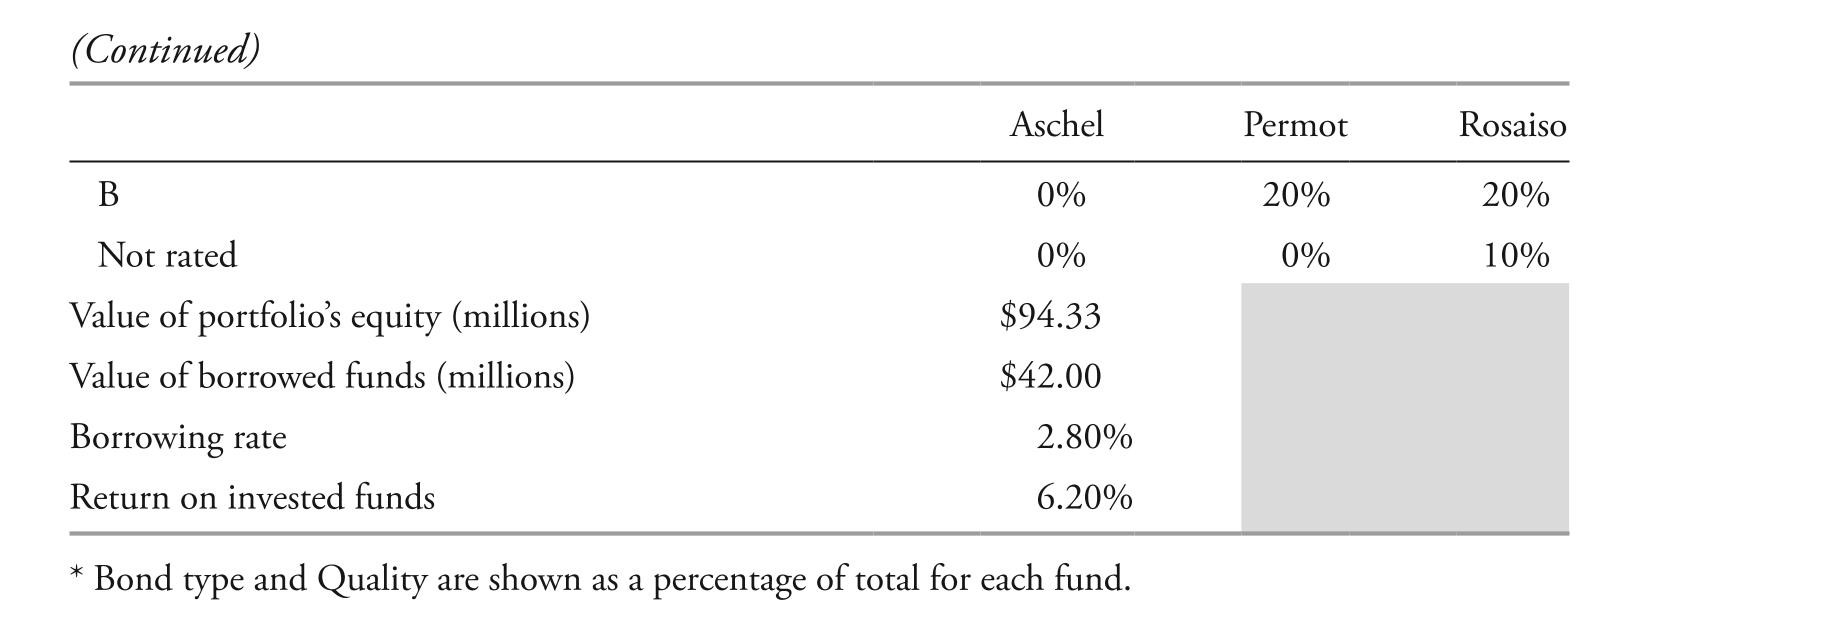 after further review of the composition of each of the funds, Perreaux notes the following.
note 1: aschel is the only fund of the three that uses leverage.note 2: rosaiso is the only fund of the three that holds a significant number of bonds with embedded options.daasvand asks Perreaux to analyze immunization approaches to liability-based mandates for a meeting with villash foundation. villash foundation is a tax-exempt client. Prior to the meeting, Perreaux identifies what she considers to be two key features of a cash flow-matching approach.
feature 1: it requires no yield curve assumptions.
feature 2: Cash flows come from coupons and liquidating bond portfolio positions.two years later, daasvand learns that villash foundation needs $5,000,000 in cash to meet liabilities. She asks Perreaux to analyze two bonds for possible liquidation. Selected data
on the two bonds are presented in exhibit 2.
-based on note 2, rosaiso is the only fund for which the expected change in price based on the investor's views of yields and yield spreads should be calculated using:
A) convexity.
B) modified duration.
C) effective duration.
Cécile Perreaux is a junior analyst for an international wealth management firm. her supervi-sor, Margit daasvand, asks Perreaux to evaluate three fixed-income funds as part of the firm's global fixed-income offerings. Selected financial data for the funds aschel, Permot, and rosaiso are presented in exhibit 1. in Perreaux's initial review, she assumes that there is no reinvestment income and that the yield curve remains unchanged.
EXHIBIT 1 Selected Data on Fixed-Income Funds
after further review of the composition of each of the funds, Perreaux notes the following.note 1: aschel is the only fund of the three that uses leverage.note 2: rosaiso is the only fund of the three that holds a significant number of bonds with embedded options.daasvand asks Perreaux to analyze immunization approaches to liability-based mandates for a meeting with villash foundation. villash foundation is a tax-exempt client. Prior to the meeting, Perreaux identifies what she considers to be two key features of a cash flow-matching approach.
feature 1: it requires no yield curve assumptions.
feature 2: Cash flows come from coupons and liquidating bond portfolio positions.two years later, daasvand learns that villash foundation needs $5,000,000 in cash to meet liabilities. She asks Perreaux to analyze two bonds for possible liquidation. Selected data
on the two bonds are presented in exhibit 2.
-based on note 2, rosaiso is the only fund for which the expected change in price based on the investor's views of yields and yield spreads should be calculated using:
A) convexity.
B) modified duration.
C) effective duration.
Question
The following information relates to Questions 1-6
Cécile Perreaux is a junior analyst for an international wealth management firm. her supervi-sor, Margit daasvand, asks Perreaux to evaluate three fixed-income funds as part of the firm's global fixed-income offerings. Selected financial data for the funds aschel, Permot, and rosaiso are presented in exhibit 1. in Perreaux's initial review, she assumes that there is no reinvestment income and that the yield curve remains unchanged.
EXHIBIT 1 Selected Data on Fixed-Income Funds
after further review of the composition of each of the funds, Perreaux notes the following.
note 1: aschel is the only fund of the three that uses leverage.note 2: rosaiso is the only fund of the three that holds a significant number of bonds with embedded options.daasvand asks Perreaux to analyze immunization approaches to liability-based mandates for a meeting with villash foundation. villash foundation is a tax-exempt client. Prior to the meeting, Perreaux identifies what she considers to be two key features of a cash flow-matching approach.
feature 1: it requires no yield curve assumptions.
feature 2: Cash flows come from coupons and liquidating bond portfolio positions.two years later, daasvand learns that villash foundation needs $5,000,000 in cash to meet liabilities. She asks Perreaux to analyze two bonds for possible liquidation. Selected data
on the two bonds are presented in exhibit 2.
-The levered portfolio return for aschel is closest to:
A) 7.25%.
B) 7.71%.
C) 8.96%.
Cécile Perreaux is a junior analyst for an international wealth management firm. her supervi-sor, Margit daasvand, asks Perreaux to evaluate three fixed-income funds as part of the firm's global fixed-income offerings. Selected financial data for the funds aschel, Permot, and rosaiso are presented in exhibit 1. in Perreaux's initial review, she assumes that there is no reinvestment income and that the yield curve remains unchanged.
EXHIBIT 1 Selected Data on Fixed-Income Funds
after further review of the composition of each of the funds, Perreaux notes the following.note 1: aschel is the only fund of the three that uses leverage.note 2: rosaiso is the only fund of the three that holds a significant number of bonds with embedded options.daasvand asks Perreaux to analyze immunization approaches to liability-based mandates for a meeting with villash foundation. villash foundation is a tax-exempt client. Prior to the meeting, Perreaux identifies what she considers to be two key features of a cash flow-matching approach.
feature 1: it requires no yield curve assumptions.
feature 2: Cash flows come from coupons and liquidating bond portfolio positions.two years later, daasvand learns that villash foundation needs $5,000,000 in cash to meet liabilities. She asks Perreaux to analyze two bonds for possible liquidation. Selected data
on the two bonds are presented in exhibit 2.
-The levered portfolio return for aschel is closest to:
A) 7.25%.
B) 7.71%.
C) 8.96%.
Question
Question
Question
Question
Question
The following information relates to Questions 1-6
Cécile Perreaux is a junior analyst for an international wealth management firm. her supervi-sor, Margit daasvand, asks Perreaux to evaluate three fixed-income funds as part of the firm's global fixed-income offerings. Selected financial data for the funds aschel, Permot, and rosaiso are presented in exhibit 1. in Perreaux's initial review, she assumes that there is no reinvestment income and that the yield curve remains unchanged.
EXHIBIT 1 Selected Data on Fixed-Income Funds
after further review of the composition of each of the funds, Perreaux notes the following.
note 1: aschel is the only fund of the three that uses leverage.note 2: rosaiso is the only fund of the three that holds a significant number of bonds with embedded options.daasvand asks Perreaux to analyze immunization approaches to liability-based mandates for a meeting with villash foundation. villash foundation is a tax-exempt client. Prior to the meeting, Perreaux identifies what she considers to be two key features of a cash flow-matching approach.
feature 1: it requires no yield curve assumptions.
feature 2: Cash flows come from coupons and liquidating bond portfolio positions.two years later, daasvand learns that villash foundation needs $5,000,000 in cash to meet liabilities. She asks Perreaux to analyze two bonds for possible liquidation. Selected data
on the two bonds are presented in exhibit 2.
-based on exhibit 2, the optimal strategy to meet villash foundation's cash needs is the sale of:
A) 100% of bond 1.
B) 100% of bond 2.
C) 50% of bond 1 and 50% of bond 2.
Cécile Perreaux is a junior analyst for an international wealth management firm. her supervi-sor, Margit daasvand, asks Perreaux to evaluate three fixed-income funds as part of the firm's global fixed-income offerings. Selected financial data for the funds aschel, Permot, and rosaiso are presented in exhibit 1. in Perreaux's initial review, she assumes that there is no reinvestment income and that the yield curve remains unchanged.
EXHIBIT 1 Selected Data on Fixed-Income Funds
after further review of the composition of each of the funds, Perreaux notes the following.note 1: aschel is the only fund of the three that uses leverage.note 2: rosaiso is the only fund of the three that holds a significant number of bonds with embedded options.daasvand asks Perreaux to analyze immunization approaches to liability-based mandates for a meeting with villash foundation. villash foundation is a tax-exempt client. Prior to the meeting, Perreaux identifies what she considers to be two key features of a cash flow-matching approach.
feature 1: it requires no yield curve assumptions.
feature 2: Cash flows come from coupons and liquidating bond portfolio positions.two years later, daasvand learns that villash foundation needs $5,000,000 in cash to meet liabilities. She asks Perreaux to analyze two bonds for possible liquidation. Selected data
on the two bonds are presented in exhibit 2.
-based on exhibit 2, the optimal strategy to meet villash foundation's cash needs is the sale of:
A) 100% of bond 1.
B) 100% of bond 2.
C) 50% of bond 1 and 50% of bond 2.
Question
The following information relates to Questions 1-6
Cécile Perreaux is a junior analyst for an international wealth management firm. her supervi-sor, Margit daasvand, asks Perreaux to evaluate three fixed-income funds as part of the firm's global fixed-income offerings. Selected financial data for the funds aschel, Permot, and rosaiso are presented in exhibit 1. in Perreaux's initial review, she assumes that there is no reinvestment income and that the yield curve remains unchanged.
EXHIBIT 1 Selected Data on Fixed-Income Funds
after further review of the composition of each of the funds, Perreaux notes the following.
note 1: aschel is the only fund of the three that uses leverage.note 2: rosaiso is the only fund of the three that holds a significant number of bonds with embedded options.daasvand asks Perreaux to analyze immunization approaches to liability-based mandates for a meeting with villash foundation. villash foundation is a tax-exempt client. Prior to the meeting, Perreaux identifies what she considers to be two key features of a cash flow-matching approach.
feature 1: it requires no yield curve assumptions.
feature 2: Cash flows come from coupons and liquidating bond portfolio positions.two years later, daasvand learns that villash foundation needs $5,000,000 in cash to meet liabilities. She asks Perreaux to analyze two bonds for possible liquidation. Selected data
on the two bonds are presented in exhibit 2.
-is Perreaux correct with respect to key features of cash flow matching?
A) Yes.
B) no, only feature 1 is correct.
C) no, only feature 2 is correct.
Cécile Perreaux is a junior analyst for an international wealth management firm. her supervi-sor, Margit daasvand, asks Perreaux to evaluate three fixed-income funds as part of the firm's global fixed-income offerings. Selected financial data for the funds aschel, Permot, and rosaiso are presented in exhibit 1. in Perreaux's initial review, she assumes that there is no reinvestment income and that the yield curve remains unchanged.
EXHIBIT 1 Selected Data on Fixed-Income Funds
after further review of the composition of each of the funds, Perreaux notes the following.note 1: aschel is the only fund of the three that uses leverage.note 2: rosaiso is the only fund of the three that holds a significant number of bonds with embedded options.daasvand asks Perreaux to analyze immunization approaches to liability-based mandates for a meeting with villash foundation. villash foundation is a tax-exempt client. Prior to the meeting, Perreaux identifies what she considers to be two key features of a cash flow-matching approach.
feature 1: it requires no yield curve assumptions.
feature 2: Cash flows come from coupons and liquidating bond portfolio positions.two years later, daasvand learns that villash foundation needs $5,000,000 in cash to meet liabilities. She asks Perreaux to analyze two bonds for possible liquidation. Selected data
on the two bonds are presented in exhibit 2.
-is Perreaux correct with respect to key features of cash flow matching?
A) Yes.
B) no, only feature 1 is correct.
C) no, only feature 2 is correct.
Question
The following information relates to Questions 1-6
Cécile Perreaux is a junior analyst for an international wealth management firm. her supervi-sor, Margit daasvand, asks Perreaux to evaluate three fixed-income funds as part of the firm's global fixed-income offerings. Selected financial data for the funds aschel, Permot, and rosaiso are presented in exhibit 1. in Perreaux's initial review, she assumes that there is no reinvestment income and that the yield curve remains unchanged.
EXHIBIT 1 Selected Data on Fixed-Income Funds
after further review of the composition of each of the funds, Perreaux notes the following.
note 1: aschel is the only fund of the three that uses leverage.note 2: rosaiso is the only fund of the three that holds a significant number of bonds with embedded options.daasvand asks Perreaux to analyze immunization approaches to liability-based mandates for a meeting with villash foundation. villash foundation is a tax-exempt client. Prior to the meeting, Perreaux identifies what she considers to be two key features of a cash flow-matching approach.
feature 1: it requires no yield curve assumptions.
feature 2: Cash flows come from coupons and liquidating bond portfolio positions.two years later, daasvand learns that villash foundation needs $5,000,000 in cash to meet liabilities. She asks Perreaux to analyze two bonds for possible liquidation. Selected data
on the two bonds are presented in exhibit 2.
-based on exhibit 1, the rolling yield of aschel over a one-year investment horizon is closest to:
A) −2.56%.
B) 0.54%.
C) 5.66%.
Cécile Perreaux is a junior analyst for an international wealth management firm. her supervi-sor, Margit daasvand, asks Perreaux to evaluate three fixed-income funds as part of the firm's global fixed-income offerings. Selected financial data for the funds aschel, Permot, and rosaiso are presented in exhibit 1. in Perreaux's initial review, she assumes that there is no reinvestment income and that the yield curve remains unchanged.
EXHIBIT 1 Selected Data on Fixed-Income Funds
after further review of the composition of each of the funds, Perreaux notes the following.note 1: aschel is the only fund of the three that uses leverage.note 2: rosaiso is the only fund of the three that holds a significant number of bonds with embedded options.daasvand asks Perreaux to analyze immunization approaches to liability-based mandates for a meeting with villash foundation. villash foundation is a tax-exempt client. Prior to the meeting, Perreaux identifies what she considers to be two key features of a cash flow-matching approach.
feature 1: it requires no yield curve assumptions.
feature 2: Cash flows come from coupons and liquidating bond portfolio positions.two years later, daasvand learns that villash foundation needs $5,000,000 in cash to meet liabilities. She asks Perreaux to analyze two bonds for possible liquidation. Selected data
on the two bonds are presented in exhibit 2.
-based on exhibit 1, the rolling yield of aschel over a one-year investment horizon is closest to:
A) −2.56%.
B) 0.54%.
C) 5.66%.
Question
The following information relates to Questions 1-6
Cécile Perreaux is a junior analyst for an international wealth management firm. her supervi-sor, Margit daasvand, asks Perreaux to evaluate three fixed-income funds as part of the firm's global fixed-income offerings. Selected financial data for the funds aschel, Permot, and rosaiso are presented in exhibit 1. in Perreaux's initial review, she assumes that there is no reinvestment income and that the yield curve remains unchanged.
EXHIBIT 1 Selected Data on Fixed-Income Funds
after further review of the composition of each of the funds, Perreaux notes the following.
note 1: aschel is the only fund of the three that uses leverage.note 2: rosaiso is the only fund of the three that holds a significant number of bonds with embedded options.daasvand asks Perreaux to analyze immunization approaches to liability-based mandates for a meeting with villash foundation. villash foundation is a tax-exempt client. Prior to the meeting, Perreaux identifies what she considers to be two key features of a cash flow-matching approach.
feature 1: it requires no yield curve assumptions.
feature 2: Cash flows come from coupons and liquidating bond portfolio positions.two years later, daasvand learns that villash foundation needs $5,000,000 in cash to meet liabilities. She asks Perreaux to analyze two bonds for possible liquidation. Selected data
on the two bonds are presented in exhibit 2.
-based on exhibit 1, which fund provides the highest level of protection against inflation for coupon payments?
A) aschel
B) Permot
C) rosaiso
Cécile Perreaux is a junior analyst for an international wealth management firm. her supervi-sor, Margit daasvand, asks Perreaux to evaluate three fixed-income funds as part of the firm's global fixed-income offerings. Selected financial data for the funds aschel, Permot, and rosaiso are presented in exhibit 1. in Perreaux's initial review, she assumes that there is no reinvestment income and that the yield curve remains unchanged.
EXHIBIT 1 Selected Data on Fixed-Income Funds
after further review of the composition of each of the funds, Perreaux notes the following.note 1: aschel is the only fund of the three that uses leverage.note 2: rosaiso is the only fund of the three that holds a significant number of bonds with embedded options.daasvand asks Perreaux to analyze immunization approaches to liability-based mandates for a meeting with villash foundation. villash foundation is a tax-exempt client. Prior to the meeting, Perreaux identifies what she considers to be two key features of a cash flow-matching approach.
feature 1: it requires no yield curve assumptions.
feature 2: Cash flows come from coupons and liquidating bond portfolio positions.two years later, daasvand learns that villash foundation needs $5,000,000 in cash to meet liabilities. She asks Perreaux to analyze two bonds for possible liquidation. Selected data
on the two bonds are presented in exhibit 2.
-based on exhibit 1, which fund provides the highest level of protection against inflation for coupon payments?
A) aschel
B) Permot
C) rosaiso
Question
Question

Unlock Deck
Sign up to unlock the cards in this deck!
Unlock Deck
Unlock Deck
1/12
Play
Full screen (f)
Deck 12: Overview of Fixed-Income Portfolio Management
1
The following information relates to Questions 1-6
Cécile Perreaux is a junior analyst for an international wealth management firm. her supervi-sor, Margit daasvand, asks Perreaux to evaluate three fixed-income funds as part of the firm's global fixed-income offerings. Selected financial data for the funds aschel, Permot, and rosaiso are presented in exhibit 1. in Perreaux's initial review, she assumes that there is no reinvestment income and that the yield curve remains unchanged.
EXHIBIT 1 Selected Data on Fixed-Income Funds
after further review of the composition of each of the funds, Perreaux notes the following.
note 1: aschel is the only fund of the three that uses leverage.note 2: rosaiso is the only fund of the three that holds a significant number of bonds with embedded options.daasvand asks Perreaux to analyze immunization approaches to liability-based mandates for a meeting with villash foundation. villash foundation is a tax-exempt client. Prior to the meeting, Perreaux identifies what she considers to be two key features of a cash flow-matching approach.
feature 1: it requires no yield curve assumptions.
feature 2: Cash flows come from coupons and liquidating bond portfolio positions.two years later, daasvand learns that villash foundation needs $5,000,000 in cash to meet liabilities. She asks Perreaux to analyze two bonds for possible liquidation. Selected data
on the two bonds are presented in exhibit 2.
-based on note 2, rosaiso is the only fund for which the expected change in price based on the investor's views of yields and yield spreads should be calculated using:
A) convexity.
B) modified duration.
C) effective duration.
Cécile Perreaux is a junior analyst for an international wealth management firm. her supervi-sor, Margit daasvand, asks Perreaux to evaluate three fixed-income funds as part of the firm's global fixed-income offerings. Selected financial data for the funds aschel, Permot, and rosaiso are presented in exhibit 1. in Perreaux's initial review, she assumes that there is no reinvestment income and that the yield curve remains unchanged.
EXHIBIT 1 Selected Data on Fixed-Income Funds
after further review of the composition of each of the funds, Perreaux notes the following.note 1: aschel is the only fund of the three that uses leverage.note 2: rosaiso is the only fund of the three that holds a significant number of bonds with embedded options.daasvand asks Perreaux to analyze immunization approaches to liability-based mandates for a meeting with villash foundation. villash foundation is a tax-exempt client. Prior to the meeting, Perreaux identifies what she considers to be two key features of a cash flow-matching approach.
feature 1: it requires no yield curve assumptions.
feature 2: Cash flows come from coupons and liquidating bond portfolio positions.two years later, daasvand learns that villash foundation needs $5,000,000 in cash to meet liabilities. She asks Perreaux to analyze two bonds for possible liquidation. Selected data
on the two bonds are presented in exhibit 2.
-based on note 2, rosaiso is the only fund for which the expected change in price based on the investor's views of yields and yield spreads should be calculated using:
A) convexity.
B) modified duration.
C) effective duration.
effective duration.
2
The following information relates to Questions 1-6
Cécile Perreaux is a junior analyst for an international wealth management firm. her supervi-sor, Margit daasvand, asks Perreaux to evaluate three fixed-income funds as part of the firm's global fixed-income offerings. Selected financial data for the funds aschel, Permot, and rosaiso are presented in exhibit 1. in Perreaux's initial review, she assumes that there is no reinvestment income and that the yield curve remains unchanged.
EXHIBIT 1 Selected Data on Fixed-Income Funds
after further review of the composition of each of the funds, Perreaux notes the following.
note 1: aschel is the only fund of the three that uses leverage.note 2: rosaiso is the only fund of the three that holds a significant number of bonds with embedded options.daasvand asks Perreaux to analyze immunization approaches to liability-based mandates for a meeting with villash foundation. villash foundation is a tax-exempt client. Prior to the meeting, Perreaux identifies what she considers to be two key features of a cash flow-matching approach.
feature 1: it requires no yield curve assumptions.
feature 2: Cash flows come from coupons and liquidating bond portfolio positions.two years later, daasvand learns that villash foundation needs $5,000,000 in cash to meet liabilities. She asks Perreaux to analyze two bonds for possible liquidation. Selected data
on the two bonds are presented in exhibit 2.
-The levered portfolio return for aschel is closest to:
A) 7.25%.
B) 7.71%.
C) 8.96%.
Cécile Perreaux is a junior analyst for an international wealth management firm. her supervi-sor, Margit daasvand, asks Perreaux to evaluate three fixed-income funds as part of the firm's global fixed-income offerings. Selected financial data for the funds aschel, Permot, and rosaiso are presented in exhibit 1. in Perreaux's initial review, she assumes that there is no reinvestment income and that the yield curve remains unchanged.
EXHIBIT 1 Selected Data on Fixed-Income Funds
after further review of the composition of each of the funds, Perreaux notes the following.note 1: aschel is the only fund of the three that uses leverage.note 2: rosaiso is the only fund of the three that holds a significant number of bonds with embedded options.daasvand asks Perreaux to analyze immunization approaches to liability-based mandates for a meeting with villash foundation. villash foundation is a tax-exempt client. Prior to the meeting, Perreaux identifies what she considers to be two key features of a cash flow-matching approach.
feature 1: it requires no yield curve assumptions.
feature 2: Cash flows come from coupons and liquidating bond portfolio positions.two years later, daasvand learns that villash foundation needs $5,000,000 in cash to meet liabilities. She asks Perreaux to analyze two bonds for possible liquidation. Selected data
on the two bonds are presented in exhibit 2.
-The levered portfolio return for aschel is closest to:
A) 7.25%.
B) 7.71%.
C) 8.96%.
7.71%.
3
The following information relates to Questions
Celia deveraux is chief investment officer for the topanga investors fund, which invests in equities and fixed income. The clients in the fund are all taxable investors. The fixed-income allocation includes a domestic (US) bond portfolio and an externally managed global bond portfolio.
The domestic bond portfolio has a total return mandate, which specifies a long-term re- turn objective of 25 basis points (bps) over the benchmark index. relative to the benchmark, small deviations in sector weightings are permitted, such risk factors as duration must closely match, and tracking error is expected to be less than 50 bps per year.
The objectives for the domestic bond portfolio include the ability to fund future liabili-ties, protect interest income from short-term inflation, and minimize the correlation with the fund's equity portfolio. The correlation between the fund's domestic bond portfolio and equity
portfolio is currently 0.14. deveraux plans to reduce the fund's equity allocation and increase
the allocation to the domestic bond portfolio. She reviews two possible investment strategies.
Strategy 1: Purchase aaa rated fixed-coupon corporate bonds with a modified duration
of two years and a correlation coefficient with the equity portfolio of −0.15.
Strategy 2: Purchase US government agency floating-coupon bonds with a modified du-
ration of one month and a correlation coefficient with the equity portfolioof −0.10.
deveraux realizes that the fund's return may decrease if the equity allocation of the fund is
reduced. deveraux decides to liquidate $20 million of US treasuries that are currently owned
and to invest the proceeds in the US corporate bond sector. to fulfill this strategy, deveraux
asks dan foster, a newly hired analyst for the fund, to recommend treasuries to sell and cor-porate bonds to purchase.
foster recommends treasuries from the existing portfolio that he believes are overvalued
and will generate capital gains. deveraux asks foster why he chose only overvalued bonds
with capital gains and did not include any bonds with capital losses. foster responds with two
statements.
Statement 1: taxable investors should prioritize selling overvalued bonds and always sell
them before selling bonds that are viewed as fairly valued or undervalued.
Statement 2: taxable investors should never intentionally realize capital losses.
regarding the purchase of corporate bonds, foster collects relevant data, which are pre-sented in exhibit 1.
deveraux and foster review the total expected 12-month return (assuming no reinvest-ment income) for the global bond portfolio. Selected financial data are presented in exhibit 2.exhibit 2 Selected data on global bond Portfolio
deveraux contemplates adding a new manager to the global bond portfolio. She reviews three proposals and determines that each manager uses the same index as its benchmark but pursues a different total return approach, as presented in exhibit 3.
-based on exhibit 1, which bond most likely has the highest liquidity premium?
A) bond 1
B) bond 2
C) bond 3
bond 3
4
The following information relates to Questions
Celia deveraux is chief investment officer for the topanga investors fund, which invests in equities and fixed income. The clients in the fund are all taxable investors. The fixed-income allocation includes a domestic (US) bond portfolio and an externally managed global bond portfolio.
The domestic bond portfolio has a total return mandate, which specifies a long-term re- turn objective of 25 basis points (bps) over the benchmark index. relative to the benchmark, small deviations in sector weightings are permitted, such risk factors as duration must closely match, and tracking error is expected to be less than 50 bps per year.
The objectives for the domestic bond portfolio include the ability to fund future liabili-ties, protect interest income from short-term inflation, and minimize the correlation with the fund's equity portfolio. The correlation between the fund's domestic bond portfolio and equity
portfolio is currently 0.14. deveraux plans to reduce the fund's equity allocation and increase
the allocation to the domestic bond portfolio. She reviews two possible investment strategies.
Strategy 1: Purchase aaa rated fixed-coupon corporate bonds with a modified duration
of two years and a correlation coefficient with the equity portfolio of −0.15.
Strategy 2: Purchase US government agency floating-coupon bonds with a modified du-
ration of one month and a correlation coefficient with the equity portfolioof −0.10.
deveraux realizes that the fund's return may decrease if the equity allocation of the fund is
reduced. deveraux decides to liquidate $20 million of US treasuries that are currently owned
and to invest the proceeds in the US corporate bond sector. to fulfill this strategy, deveraux
asks dan foster, a newly hired analyst for the fund, to recommend treasuries to sell and cor-porate bonds to purchase.
foster recommends treasuries from the existing portfolio that he believes are overvalued
and will generate capital gains. deveraux asks foster why he chose only overvalued bonds
with capital gains and did not include any bonds with capital losses. foster responds with two
statements.
Statement 1: taxable investors should prioritize selling overvalued bonds and always sell
them before selling bonds that are viewed as fairly valued or undervalued.
Statement 2: taxable investors should never intentionally realize capital losses.
regarding the purchase of corporate bonds, foster collects relevant data, which are pre-sented in exhibit 1.
deveraux and foster review the total expected 12-month return (assuming no reinvest-ment income) for the global bond portfolio. Selected financial data are presented in exhibit 2.exhibit 2 Selected data on global bond Portfolio
deveraux contemplates adding a new manager to the global bond portfolio. She reviews three proposals and determines that each manager uses the same index as its benchmark but pursues a different total return approach, as presented in exhibit 3.
-based on exhibit 2, the total expected return of the fund's global bond portfolio is closest to:
A) 0.90%.
B) 2.20%.
C) 3.76%.
Unlock Deck
Unlock for access to all 12 flashcards in this deck.
Unlock Deck
k this deck
5
The following information relates to Questions
Celia deveraux is chief investment officer for the topanga investors fund, which invests in equities and fixed income. The clients in the fund are all taxable investors. The fixed-income allocation includes a domestic (US) bond portfolio and an externally managed global bond portfolio.
The domestic bond portfolio has a total return mandate, which specifies a long-term re- turn objective of 25 basis points (bps) over the benchmark index. relative to the benchmark, small deviations in sector weightings are permitted, such risk factors as duration must closely match, and tracking error is expected to be less than 50 bps per year.
The objectives for the domestic bond portfolio include the ability to fund future liabili-ties, protect interest income from short-term inflation, and minimize the correlation with the fund's equity portfolio. The correlation between the fund's domestic bond portfolio and equity
portfolio is currently 0.14. deveraux plans to reduce the fund's equity allocation and increase
the allocation to the domestic bond portfolio. She reviews two possible investment strategies.
Strategy 1: Purchase aaa rated fixed-coupon corporate bonds with a modified duration
of two years and a correlation coefficient with the equity portfolio of −0.15.
Strategy 2: Purchase US government agency floating-coupon bonds with a modified du-
ration of one month and a correlation coefficient with the equity portfolioof −0.10.
deveraux realizes that the fund's return may decrease if the equity allocation of the fund is
reduced. deveraux decides to liquidate $20 million of US treasuries that are currently owned
and to invest the proceeds in the US corporate bond sector. to fulfill this strategy, deveraux
asks dan foster, a newly hired analyst for the fund, to recommend treasuries to sell and cor-porate bonds to purchase.
foster recommends treasuries from the existing portfolio that he believes are overvalued
and will generate capital gains. deveraux asks foster why he chose only overvalued bonds
with capital gains and did not include any bonds with capital losses. foster responds with two
statements.
Statement 1: taxable investors should prioritize selling overvalued bonds and always sell
them before selling bonds that are viewed as fairly valued or undervalued.
Statement 2: taxable investors should never intentionally realize capital losses.
regarding the purchase of corporate bonds, foster collects relevant data, which are pre-sented in exhibit 1.
deveraux and foster review the total expected 12-month return (assuming no reinvest-ment income) for the global bond portfolio. Selected financial data are presented in exhibit 2.exhibit 2 Selected data on global bond Portfolio
deveraux contemplates adding a new manager to the global bond portfolio. She reviews three proposals and determines that each manager uses the same index as its benchmark but pursues a different total return approach, as presented in exhibit 3.
-Strategy 2 is most likely preferred to Strategy 1 for meeting the objective of:
A) protecting inflation.
B) funding future liabilities.
C) minimizing the correlation of the fund's domestic bond portfolio and equity portfolio.
Unlock Deck
Unlock for access to all 12 flashcards in this deck.
Unlock Deck
k this deck
6
The following information relates to Questions
Celia deveraux is chief investment officer for the topanga investors fund, which invests in equities and fixed income. The clients in the fund are all taxable investors. The fixed-income allocation includes a domestic (US) bond portfolio and an externally managed global bond portfolio.
The domestic bond portfolio has a total return mandate, which specifies a long-term re- turn objective of 25 basis points (bps) over the benchmark index. relative to the benchmark, small deviations in sector weightings are permitted, such risk factors as duration must closely match, and tracking error is expected to be less than 50 bps per year.
The objectives for the domestic bond portfolio include the ability to fund future liabili-ties, protect interest income from short-term inflation, and minimize the correlation with the fund's equity portfolio. The correlation between the fund's domestic bond portfolio and equity
portfolio is currently 0.14. deveraux plans to reduce the fund's equity allocation and increase
the allocation to the domestic bond portfolio. She reviews two possible investment strategies.
Strategy 1: Purchase aaa rated fixed-coupon corporate bonds with a modified duration
of two years and a correlation coefficient with the equity portfolio of −0.15.
Strategy 2: Purchase US government agency floating-coupon bonds with a modified du-
ration of one month and a correlation coefficient with the equity portfolioof −0.10.
deveraux realizes that the fund's return may decrease if the equity allocation of the fund is
reduced. deveraux decides to liquidate $20 million of US treasuries that are currently owned
and to invest the proceeds in the US corporate bond sector. to fulfill this strategy, deveraux
asks dan foster, a newly hired analyst for the fund, to recommend treasuries to sell and cor-porate bonds to purchase.
foster recommends treasuries from the existing portfolio that he believes are overvalued
and will generate capital gains. deveraux asks foster why he chose only overvalued bonds
with capital gains and did not include any bonds with capital losses. foster responds with two
statements.
Statement 1: taxable investors should prioritize selling overvalued bonds and always sell
them before selling bonds that are viewed as fairly valued or undervalued.
Statement 2: taxable investors should never intentionally realize capital losses.
regarding the purchase of corporate bonds, foster collects relevant data, which are pre-sented in exhibit 1.
deveraux and foster review the total expected 12-month return (assuming no reinvest-ment income) for the global bond portfolio. Selected financial data are presented in exhibit 2.exhibit 2 Selected data on global bond Portfolio
deveraux contemplates adding a new manager to the global bond portfolio. She reviews three proposals and determines that each manager uses the same index as its benchmark but pursues a different total return approach, as presented in exhibit 3.
-which approach to its total return mandate is the fund's domestic bond portfolio most likely to use?
A) Pure indexing
B) enhanced indexing
C) active management
Unlock Deck
Unlock for access to all 12 flashcards in this deck.
Unlock Deck
k this deck
7
The following information relates to Questions 1-6
Cécile Perreaux is a junior analyst for an international wealth management firm. her supervi-sor, Margit daasvand, asks Perreaux to evaluate three fixed-income funds as part of the firm's global fixed-income offerings. Selected financial data for the funds aschel, Permot, and rosaiso are presented in exhibit 1. in Perreaux's initial review, she assumes that there is no reinvestment income and that the yield curve remains unchanged.
EXHIBIT 1 Selected Data on Fixed-Income Funds
after further review of the composition of each of the funds, Perreaux notes the following.
note 1: aschel is the only fund of the three that uses leverage.note 2: rosaiso is the only fund of the three that holds a significant number of bonds with embedded options.daasvand asks Perreaux to analyze immunization approaches to liability-based mandates for a meeting with villash foundation. villash foundation is a tax-exempt client. Prior to the meeting, Perreaux identifies what she considers to be two key features of a cash flow-matching approach.
feature 1: it requires no yield curve assumptions.
feature 2: Cash flows come from coupons and liquidating bond portfolio positions.two years later, daasvand learns that villash foundation needs $5,000,000 in cash to meet liabilities. She asks Perreaux to analyze two bonds for possible liquidation. Selected data
on the two bonds are presented in exhibit 2.
-based on exhibit 2, the optimal strategy to meet villash foundation's cash needs is the sale of:
A) 100% of bond 1.
B) 100% of bond 2.
C) 50% of bond 1 and 50% of bond 2.
Cécile Perreaux is a junior analyst for an international wealth management firm. her supervi-sor, Margit daasvand, asks Perreaux to evaluate three fixed-income funds as part of the firm's global fixed-income offerings. Selected financial data for the funds aschel, Permot, and rosaiso are presented in exhibit 1. in Perreaux's initial review, she assumes that there is no reinvestment income and that the yield curve remains unchanged.
EXHIBIT 1 Selected Data on Fixed-Income Funds
after further review of the composition of each of the funds, Perreaux notes the following.note 1: aschel is the only fund of the three that uses leverage.note 2: rosaiso is the only fund of the three that holds a significant number of bonds with embedded options.daasvand asks Perreaux to analyze immunization approaches to liability-based mandates for a meeting with villash foundation. villash foundation is a tax-exempt client. Prior to the meeting, Perreaux identifies what she considers to be two key features of a cash flow-matching approach.
feature 1: it requires no yield curve assumptions.
feature 2: Cash flows come from coupons and liquidating bond portfolio positions.two years later, daasvand learns that villash foundation needs $5,000,000 in cash to meet liabilities. She asks Perreaux to analyze two bonds for possible liquidation. Selected data
on the two bonds are presented in exhibit 2.
-based on exhibit 2, the optimal strategy to meet villash foundation's cash needs is the sale of:
A) 100% of bond 1.
B) 100% of bond 2.
C) 50% of bond 1 and 50% of bond 2.
Unlock Deck
Unlock for access to all 12 flashcards in this deck.
Unlock Deck
k this deck
8
The following information relates to Questions 1-6
Cécile Perreaux is a junior analyst for an international wealth management firm. her supervi-sor, Margit daasvand, asks Perreaux to evaluate three fixed-income funds as part of the firm's global fixed-income offerings. Selected financial data for the funds aschel, Permot, and rosaiso are presented in exhibit 1. in Perreaux's initial review, she assumes that there is no reinvestment income and that the yield curve remains unchanged.
EXHIBIT 1 Selected Data on Fixed-Income Funds
after further review of the composition of each of the funds, Perreaux notes the following.
note 1: aschel is the only fund of the three that uses leverage.note 2: rosaiso is the only fund of the three that holds a significant number of bonds with embedded options.daasvand asks Perreaux to analyze immunization approaches to liability-based mandates for a meeting with villash foundation. villash foundation is a tax-exempt client. Prior to the meeting, Perreaux identifies what she considers to be two key features of a cash flow-matching approach.
feature 1: it requires no yield curve assumptions.
feature 2: Cash flows come from coupons and liquidating bond portfolio positions.two years later, daasvand learns that villash foundation needs $5,000,000 in cash to meet liabilities. She asks Perreaux to analyze two bonds for possible liquidation. Selected data
on the two bonds are presented in exhibit 2.
-is Perreaux correct with respect to key features of cash flow matching?
A) Yes.
B) no, only feature 1 is correct.
C) no, only feature 2 is correct.
Cécile Perreaux is a junior analyst for an international wealth management firm. her supervi-sor, Margit daasvand, asks Perreaux to evaluate three fixed-income funds as part of the firm's global fixed-income offerings. Selected financial data for the funds aschel, Permot, and rosaiso are presented in exhibit 1. in Perreaux's initial review, she assumes that there is no reinvestment income and that the yield curve remains unchanged.
EXHIBIT 1 Selected Data on Fixed-Income Funds
after further review of the composition of each of the funds, Perreaux notes the following.note 1: aschel is the only fund of the three that uses leverage.note 2: rosaiso is the only fund of the three that holds a significant number of bonds with embedded options.daasvand asks Perreaux to analyze immunization approaches to liability-based mandates for a meeting with villash foundation. villash foundation is a tax-exempt client. Prior to the meeting, Perreaux identifies what she considers to be two key features of a cash flow-matching approach.
feature 1: it requires no yield curve assumptions.
feature 2: Cash flows come from coupons and liquidating bond portfolio positions.two years later, daasvand learns that villash foundation needs $5,000,000 in cash to meet liabilities. She asks Perreaux to analyze two bonds for possible liquidation. Selected data
on the two bonds are presented in exhibit 2.
-is Perreaux correct with respect to key features of cash flow matching?
A) Yes.
B) no, only feature 1 is correct.
C) no, only feature 2 is correct.
Unlock Deck
Unlock for access to all 12 flashcards in this deck.
Unlock Deck
k this deck
9
The following information relates to Questions 1-6
Cécile Perreaux is a junior analyst for an international wealth management firm. her supervi-sor, Margit daasvand, asks Perreaux to evaluate three fixed-income funds as part of the firm's global fixed-income offerings. Selected financial data for the funds aschel, Permot, and rosaiso are presented in exhibit 1. in Perreaux's initial review, she assumes that there is no reinvestment income and that the yield curve remains unchanged.
EXHIBIT 1 Selected Data on Fixed-Income Funds
after further review of the composition of each of the funds, Perreaux notes the following.
note 1: aschel is the only fund of the three that uses leverage.note 2: rosaiso is the only fund of the three that holds a significant number of bonds with embedded options.daasvand asks Perreaux to analyze immunization approaches to liability-based mandates for a meeting with villash foundation. villash foundation is a tax-exempt client. Prior to the meeting, Perreaux identifies what she considers to be two key features of a cash flow-matching approach.
feature 1: it requires no yield curve assumptions.
feature 2: Cash flows come from coupons and liquidating bond portfolio positions.two years later, daasvand learns that villash foundation needs $5,000,000 in cash to meet liabilities. She asks Perreaux to analyze two bonds for possible liquidation. Selected data
on the two bonds are presented in exhibit 2.
-based on exhibit 1, the rolling yield of aschel over a one-year investment horizon is closest to:
A) −2.56%.
B) 0.54%.
C) 5.66%.
Cécile Perreaux is a junior analyst for an international wealth management firm. her supervi-sor, Margit daasvand, asks Perreaux to evaluate three fixed-income funds as part of the firm's global fixed-income offerings. Selected financial data for the funds aschel, Permot, and rosaiso are presented in exhibit 1. in Perreaux's initial review, she assumes that there is no reinvestment income and that the yield curve remains unchanged.
EXHIBIT 1 Selected Data on Fixed-Income Funds
after further review of the composition of each of the funds, Perreaux notes the following.note 1: aschel is the only fund of the three that uses leverage.note 2: rosaiso is the only fund of the three that holds a significant number of bonds with embedded options.daasvand asks Perreaux to analyze immunization approaches to liability-based mandates for a meeting with villash foundation. villash foundation is a tax-exempt client. Prior to the meeting, Perreaux identifies what she considers to be two key features of a cash flow-matching approach.
feature 1: it requires no yield curve assumptions.
feature 2: Cash flows come from coupons and liquidating bond portfolio positions.two years later, daasvand learns that villash foundation needs $5,000,000 in cash to meet liabilities. She asks Perreaux to analyze two bonds for possible liquidation. Selected data
on the two bonds are presented in exhibit 2.
-based on exhibit 1, the rolling yield of aschel over a one-year investment horizon is closest to:
A) −2.56%.
B) 0.54%.
C) 5.66%.
Unlock Deck
Unlock for access to all 12 flashcards in this deck.
Unlock Deck
k this deck
10
The following information relates to Questions 1-6
Cécile Perreaux is a junior analyst for an international wealth management firm. her supervi-sor, Margit daasvand, asks Perreaux to evaluate three fixed-income funds as part of the firm's global fixed-income offerings. Selected financial data for the funds aschel, Permot, and rosaiso are presented in exhibit 1. in Perreaux's initial review, she assumes that there is no reinvestment income and that the yield curve remains unchanged.
EXHIBIT 1 Selected Data on Fixed-Income Funds
after further review of the composition of each of the funds, Perreaux notes the following.
note 1: aschel is the only fund of the three that uses leverage.note 2: rosaiso is the only fund of the three that holds a significant number of bonds with embedded options.daasvand asks Perreaux to analyze immunization approaches to liability-based mandates for a meeting with villash foundation. villash foundation is a tax-exempt client. Prior to the meeting, Perreaux identifies what she considers to be two key features of a cash flow-matching approach.
feature 1: it requires no yield curve assumptions.
feature 2: Cash flows come from coupons and liquidating bond portfolio positions.two years later, daasvand learns that villash foundation needs $5,000,000 in cash to meet liabilities. She asks Perreaux to analyze two bonds for possible liquidation. Selected data
on the two bonds are presented in exhibit 2.
-based on exhibit 1, which fund provides the highest level of protection against inflation for coupon payments?
A) aschel
B) Permot
C) rosaiso
Cécile Perreaux is a junior analyst for an international wealth management firm. her supervi-sor, Margit daasvand, asks Perreaux to evaluate three fixed-income funds as part of the firm's global fixed-income offerings. Selected financial data for the funds aschel, Permot, and rosaiso are presented in exhibit 1. in Perreaux's initial review, she assumes that there is no reinvestment income and that the yield curve remains unchanged.
EXHIBIT 1 Selected Data on Fixed-Income Funds
after further review of the composition of each of the funds, Perreaux notes the following.note 1: aschel is the only fund of the three that uses leverage.note 2: rosaiso is the only fund of the three that holds a significant number of bonds with embedded options.daasvand asks Perreaux to analyze immunization approaches to liability-based mandates for a meeting with villash foundation. villash foundation is a tax-exempt client. Prior to the meeting, Perreaux identifies what she considers to be two key features of a cash flow-matching approach.
feature 1: it requires no yield curve assumptions.
feature 2: Cash flows come from coupons and liquidating bond portfolio positions.two years later, daasvand learns that villash foundation needs $5,000,000 in cash to meet liabilities. She asks Perreaux to analyze two bonds for possible liquidation. Selected data
on the two bonds are presented in exhibit 2.
-based on exhibit 1, which fund provides the highest level of protection against inflation for coupon payments?
A) aschel
B) Permot
C) rosaiso
Unlock Deck
Unlock for access to all 12 flashcards in this deck.
Unlock Deck
k this deck
11
The following information relates to Questions
Celia deveraux is chief investment officer for the topanga investors fund, which invests in equities and fixed income. The clients in the fund are all taxable investors. The fixed-income allocation includes a domestic (US) bond portfolio and an externally managed global bond portfolio.
The domestic bond portfolio has a total return mandate, which specifies a long-term re- turn objective of 25 basis points (bps) over the benchmark index. relative to the benchmark, small deviations in sector weightings are permitted, such risk factors as duration must closely match, and tracking error is expected to be less than 50 bps per year.
The objectives for the domestic bond portfolio include the ability to fund future liabili-ties, protect interest income from short-term inflation, and minimize the correlation with the fund's equity portfolio. The correlation between the fund's domestic bond portfolio and equity
portfolio is currently 0.14. deveraux plans to reduce the fund's equity allocation and increase
the allocation to the domestic bond portfolio. She reviews two possible investment strategies.
Strategy 1: Purchase aaa rated fixed-coupon corporate bonds with a modified duration
of two years and a correlation coefficient with the equity portfolio of −0.15.
Strategy 2: Purchase US government agency floating-coupon bonds with a modified du-
ration of one month and a correlation coefficient with the equity portfolioof −0.10.
deveraux realizes that the fund's return may decrease if the equity allocation of the fund is
reduced. deveraux decides to liquidate $20 million of US treasuries that are currently owned
and to invest the proceeds in the US corporate bond sector. to fulfill this strategy, deveraux
asks dan foster, a newly hired analyst for the fund, to recommend treasuries to sell and cor-porate bonds to purchase.
foster recommends treasuries from the existing portfolio that he believes are overvalued
and will generate capital gains. deveraux asks foster why he chose only overvalued bonds
with capital gains and did not include any bonds with capital losses. foster responds with two
statements.
Statement 1: taxable investors should prioritize selling overvalued bonds and always sell
them before selling bonds that are viewed as fairly valued or undervalued.
Statement 2: taxable investors should never intentionally realize capital losses.
regarding the purchase of corporate bonds, foster collects relevant data, which are pre-sented in exhibit 1.
deveraux and foster review the total expected 12-month return (assuming no reinvest-ment income) for the global bond portfolio. Selected financial data are presented in exhibit 2.exhibit 2 Selected data on global bond Portfolio
deveraux contemplates adding a new manager to the global bond portfolio. She reviews three proposals and determines that each manager uses the same index as its benchmark but pursues a different total return approach, as presented in exhibit 3.
-based on exhibit 3, which manager is most likely to have an active management total return mandate?
A) Manager a
B) Manager b
C) Manager C
Unlock Deck
Unlock for access to all 12 flashcards in this deck.
Unlock Deck
k this deck
12
The following information relates to Questions
Celia deveraux is chief investment officer for the topanga investors fund, which invests in equities and fixed income. The clients in the fund are all taxable investors. The fixed-income allocation includes a domestic (US) bond portfolio and an externally managed global bond portfolio.
The domestic bond portfolio has a total return mandate, which specifies a long-term re- turn objective of 25 basis points (bps) over the benchmark index. relative to the benchmark, small deviations in sector weightings are permitted, such risk factors as duration must closely match, and tracking error is expected to be less than 50 bps per year.
The objectives for the domestic bond portfolio include the ability to fund future liabili-ties, protect interest income from short-term inflation, and minimize the correlation with the fund's equity portfolio. The correlation between the fund's domestic bond portfolio and equity
portfolio is currently 0.14. deveraux plans to reduce the fund's equity allocation and increase
the allocation to the domestic bond portfolio. She reviews two possible investment strategies.
Strategy 1: Purchase aaa rated fixed-coupon corporate bonds with a modified duration
of two years and a correlation coefficient with the equity portfolio of −0.15.
Strategy 2: Purchase US government agency floating-coupon bonds with a modified du-
ration of one month and a correlation coefficient with the equity portfolioof −0.10.
deveraux realizes that the fund's return may decrease if the equity allocation of the fund is
reduced. deveraux decides to liquidate $20 million of US treasuries that are currently owned
and to invest the proceeds in the US corporate bond sector. to fulfill this strategy, deveraux
asks dan foster, a newly hired analyst for the fund, to recommend treasuries to sell and cor-porate bonds to purchase.
foster recommends treasuries from the existing portfolio that he believes are overvalued
and will generate capital gains. deveraux asks foster why he chose only overvalued bonds
with capital gains and did not include any bonds with capital losses. foster responds with two
statements.
Statement 1: taxable investors should prioritize selling overvalued bonds and always sell
them before selling bonds that are viewed as fairly valued or undervalued.
Statement 2: taxable investors should never intentionally realize capital losses.
regarding the purchase of corporate bonds, foster collects relevant data, which are pre-sented in exhibit 1.
deveraux and foster review the total expected 12-month return (assuming no reinvest-ment income) for the global bond portfolio. Selected financial data are presented in exhibit 2.exhibit 2 Selected data on global bond Portfolio
deveraux contemplates adding a new manager to the global bond portfolio. She reviews three proposals and determines that each manager uses the same index as its benchmark but pursues a different total return approach, as presented in exhibit 3.
-are foster's statements to deveraux supporting foster's choice of bonds to sell correct?
A) Only Statement 1 is correct.
B) Only Statement 2 is correct.
C) neither Statement 1 nor Statement 2 is correct.
Unlock Deck
Unlock for access to all 12 flashcards in this deck.
Unlock Deck
k this deck
Unlock Deck
Unlock for access to all 12 flashcards in this deck.


