Deck 13: Asking and Answering Questions About the Difference Between Two Means
Full screen (f)
Question

Question
A number of butterfly species mate for hours, and if a mating couple is disturbed, one
of the butterflies is responsible for flying, carrying its partner with it. Not only are
mating pairs more noticeable to predators, the added weight may hamper the flight
during escape. Random samples of Green-veined White (Pieris napi) butterflies
were the subjects of a Swedish study to investigate the escape flights of single
butterflies and of mating pairs when exposed to a predator. Data on the initial takeoff
angle of escape are presented below. The investigators considered performing a
hypothesis test to determine if there was evidence that the mean take off angle was
different for singles and pairs. Using a graphical procedure of your choice,
determine if the t-test is appropriate.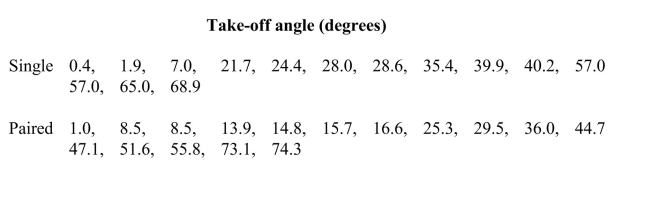
Question
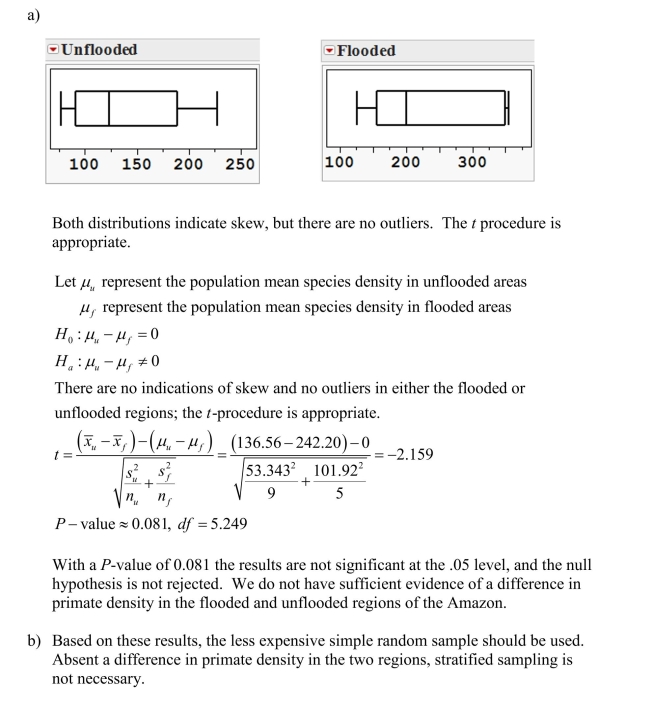
The Amazon River basin includes the largest remaining connected area of tropical
forest in the world, and ecologists regularly monitor its health. One aspect of its
health is the density of different indigenous species. The Amazon basin includes both
areas that are periodically flooded, and areas that are not periodically flooded. If the
densities of species differ in the flooded and unflooded regions, researchers will want
to take stratified samples in their studies. Stratified sampling would be more
expensive, since boats must be rented to get to any randomly selected flooded sites.
The data below are measures of density (individuals per square kilometer) of primates
in random samples of flooded and unflooded areas in the Amazon basin.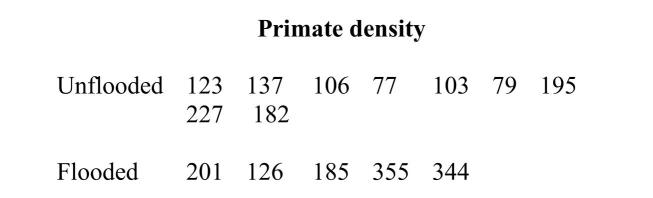 a) Do these data provide convincing evidence of a difference in the primate density
in flooded and unflooded forests in Amazonia? Provide appropriate statistical
justification for your conclusion.
b) Based on your results in part (a), would you recommend using a stratified sample?
Justify your recommendation with a statistical argument.
forest in the world, and ecologists regularly monitor its health. One aspect of its
health is the density of different indigenous species. The Amazon basin includes both
areas that are periodically flooded, and areas that are not periodically flooded. If the
densities of species differ in the flooded and unflooded regions, researchers will want
to take stratified samples in their studies. Stratified sampling would be more
expensive, since boats must be rented to get to any randomly selected flooded sites.
The data below are measures of density (individuals per square kilometer) of primates
in random samples of flooded and unflooded areas in the Amazon basin.
a) Do these data provide convincing evidence of a difference in the primate densityin flooded and unflooded forests in Amazonia? Provide appropriate statistical
justification for your conclusion.
b) Based on your results in part (a), would you recommend using a stratified sample?
Justify your recommendation with a statistical argument.
Question
Question
In an introductory marketing class students were presented with 6 items they could
bid on in an auction. They were asked to bid privately and also estimate the "typical"
bid for each item by their classmates. The items were randomly selected from a large
list of items that students might purchase. An initial analysis of the data established
the plausibility that the distribution of differences (estimated - actual) is
approximately normal.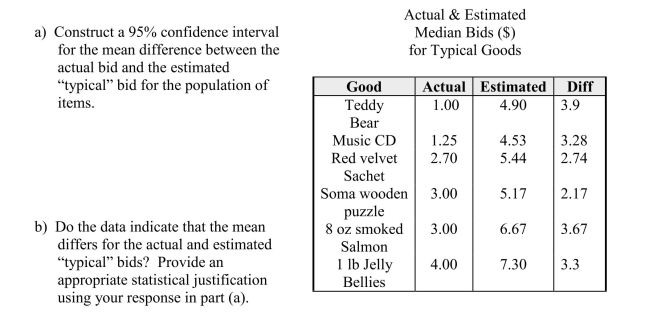
Question
A number of butterfly species mate for hours, and if a mating couple is disturbed, one
of the butterflies is responsible for flying, carrying its partner with it. Not only are
mating pairs more noticeable to predators, but the added weight may hamper the
flight during escape. Random samples of Green-veined White (Pieris napi)
butterflies were the subjects of a Swedish study to investigate the escape flights of
single butterflies and of mating pairs when exposed to a predator. Data on the initial
takeoff escape velocities are presented below. The investigators considered
performing a hypothesis test to determine if there was evidence that the mean take off
escape velocity was different for singles and pairs. Using a graphical procedure of
your choice, determine if the t-test is appropriate.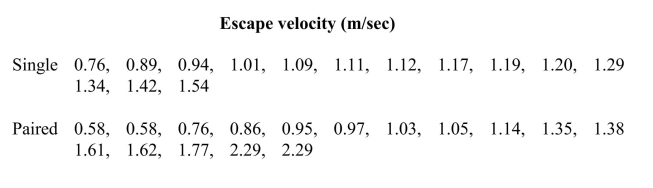
Question

Question
Question
Question
Question
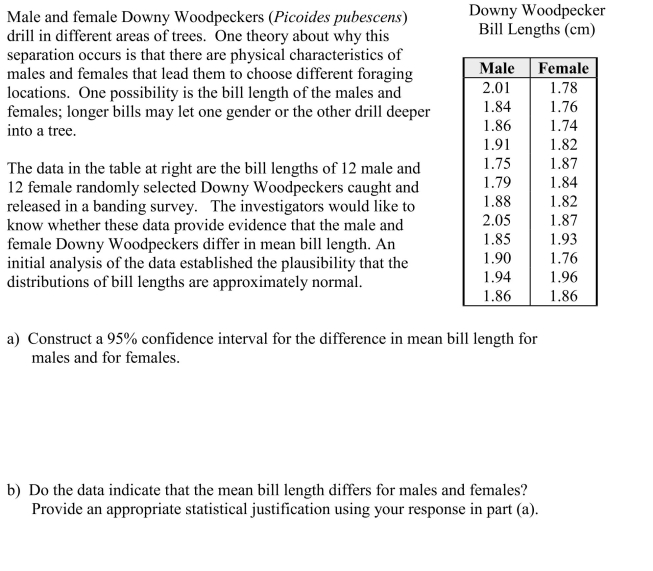
In many animal species the males and females differ slightly in structure, coloring,
and/or size. The hominid species Australopithecus is thought to have lived about 3.2
million years ago. ("Lucy," the famous near-complete skeleton discovered in 1974, is
an Australopithecus.) Forensic anthropologists use partial skeletal remains to
estimate the mass of an individual. The data below are estimates of masses from
partial skeletal remains of this species found in sub-Saharan Africa. Appropriate
graphical displays of the data indicate that it is reasonable to assume that the
population distributions of mass are approximately normal for both males and
females. You may also assume that these samples are representative of the respective
populations.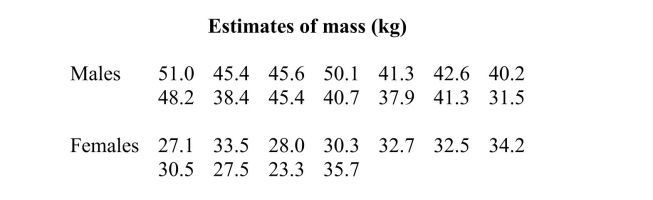 Do these data provide convincing evidence that the mean estimated masses differ for
Australopithecus males and females? Provide appropriate statistical justification for
your conclusion.
and/or size. The hominid species Australopithecus is thought to have lived about 3.2
million years ago. ("Lucy," the famous near-complete skeleton discovered in 1974, is
an Australopithecus.) Forensic anthropologists use partial skeletal remains to
estimate the mass of an individual. The data below are estimates of masses from
partial skeletal remains of this species found in sub-Saharan Africa. Appropriate
graphical displays of the data indicate that it is reasonable to assume that the
population distributions of mass are approximately normal for both males and
females. You may also assume that these samples are representative of the respective
populations.
Do these data provide convincing evidence that the mean estimated masses differ forAustralopithecus males and females? Provide appropriate statistical justification for
your conclusion.
Question
Question

Question
Question
Question
When wildlife biologists study small animals, the animals are trapped and then
anesthetized to prevent discomfort to the animal. A study of the effect of the
anesthetic, Isoflurane, on eastern gray squirrels (Sciurus carolinensis) resulted in the
pulse data presented below. The biologists were interested in comparing the effects
of Isoflurane in two different seasons, winter and summer.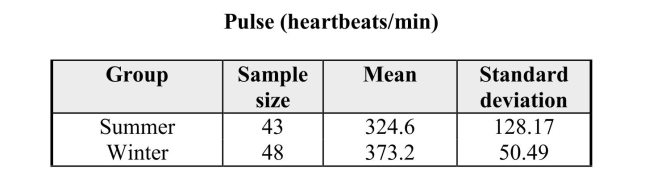 An initial analysis of the data revealed that it was reasonable to assume the
distribution of pulses for each season is approximately normal. It was also judged to
be reasonable to regard these samples as representative of the eastern gray squirrel
population.
a) Test the hypothesis of no difference in eastern gray squirrel mean pulse for winter
and summer.
b) Do the data indicate that the mean pulse differs for the two seasons? Provide an
appropriate statistical justification using your response in part (a).
anesthetized to prevent discomfort to the animal. A study of the effect of the
anesthetic, Isoflurane, on eastern gray squirrels (Sciurus carolinensis) resulted in the
pulse data presented below. The biologists were interested in comparing the effects
of Isoflurane in two different seasons, winter and summer.
An initial analysis of the data revealed that it was reasonable to assume thedistribution of pulses for each season is approximately normal. It was also judged to
be reasonable to regard these samples as representative of the eastern gray squirrel
population.
a) Test the hypothesis of no difference in eastern gray squirrel mean pulse for winter
and summer.
b) Do the data indicate that the mean pulse differs for the two seasons? Provide an
appropriate statistical justification using your response in part (a).
Question
Question

Question
Question
Question
When wildlife biologists study small animals, the animals are trapped and then
anesthetized to prevent discomfort to the animal. A study of the effect of the
anesthetic, Isoflurane, on Allegheny woodrats (Neotoma magister) resulted in the
heartbeat data presented below. The biologists were interested in comparing the
effects of Isoflurane in two different seasons, winter and summer.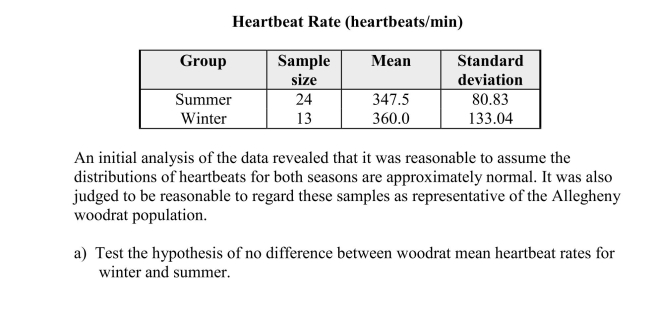 b) Do the data indicate that the mean heartbeat rates differ? Provide an appropriate
statistical justification using your response in part (a).
anesthetized to prevent discomfort to the animal. A study of the effect of the
anesthetic, Isoflurane, on Allegheny woodrats (Neotoma magister) resulted in the
heartbeat data presented below. The biologists were interested in comparing the
effects of Isoflurane in two different seasons, winter and summer.
b) Do the data indicate that the mean heartbeat rates differ? Provide an appropriatestatistical justification using your response in part (a).
Question
Question
Question
Question
Question
Question
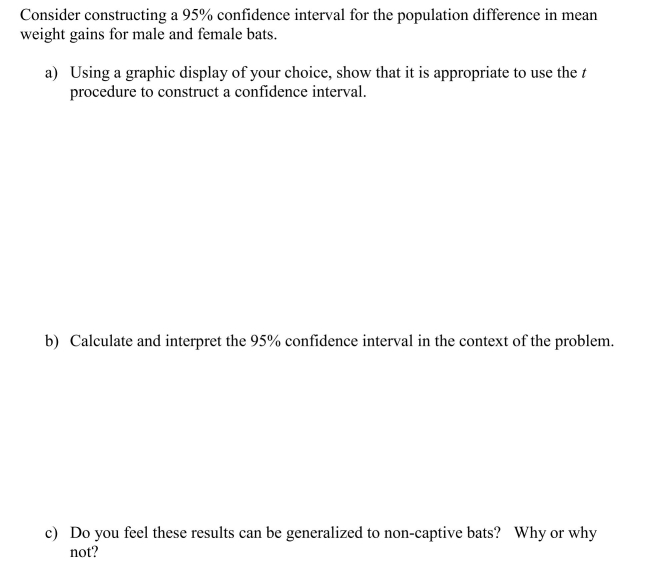
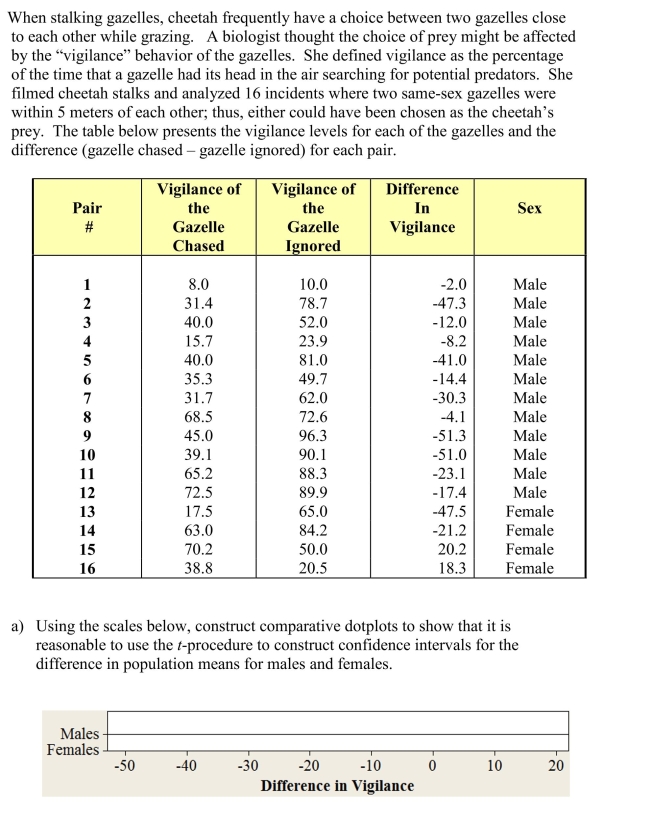 b) Calculate and interpret the 95% confidence interval in the context of the problem.
c) The investigator noticed that many more male pairs than female pairs were
actually stalked by cheetah. Two theories have been proposed for this difference.
The first theory is that the gazelle females are generally more vigilant than males.
The second theory is that females generally graze near the centers of the herds,
protecting the young, and are less accessible to predators.
i) Is it possible to use investigator's data be used to support or refute the theory
that females are more vigilant than males? Is so, how? If not, why not?
ii) Is it possible to use investigator's data be used to support or refute the theory
that females generally graze near the centers of the herds? Is so, how? If not,
why not?

Unlock Deck
Sign up to unlock the cards in this deck!
Unlock Deck
Unlock Deck
1/27
Play
Full screen (f)
Deck 13: Asking and Answering Questions About the Difference Between Two Means
1
False
2
A number of butterfly species mate for hours, and if a mating couple is disturbed, one
of the butterflies is responsible for flying, carrying its partner with it. Not only are
mating pairs more noticeable to predators, the added weight may hamper the flight
during escape. Random samples of Green-veined White (Pieris napi) butterflies
were the subjects of a Swedish study to investigate the escape flights of single
butterflies and of mating pairs when exposed to a predator. Data on the initial takeoff
angle of escape are presented below. The investigators considered performing a
hypothesis test to determine if there was evidence that the mean take off angle was
different for singles and pairs. Using a graphical procedure of your choice,
determine if the t-test is appropriate.
3
The Amazon River basin includes the largest remaining connected area of tropical
forest in the world, and ecologists regularly monitor its health. One aspect of its
health is the density of different indigenous species. The Amazon basin includes both
areas that are periodically flooded, and areas that are not periodically flooded. If the
densities of species differ in the flooded and unflooded regions, researchers will want
to take stratified samples in their studies. Stratified sampling would be more
expensive, since boats must be rented to get to any randomly selected flooded sites.
The data below are measures of density (individuals per square kilometer) of primates
in random samples of flooded and unflooded areas in the Amazon basin. a) Do these data provide convincing evidence of a difference in the primate density
in flooded and unflooded forests in Amazonia? Provide appropriate statistical
justification for your conclusion.
b) Based on your results in part (a), would you recommend using a stratified sample?
Justify your recommendation with a statistical argument.
forest in the world, and ecologists regularly monitor its health. One aspect of its
health is the density of different indigenous species. The Amazon basin includes both
areas that are periodically flooded, and areas that are not periodically flooded. If the
densities of species differ in the flooded and unflooded regions, researchers will want
to take stratified samples in their studies. Stratified sampling would be more
expensive, since boats must be rented to get to any randomly selected flooded sites.
The data below are measures of density (individuals per square kilometer) of primates
in random samples of flooded and unflooded areas in the Amazon basin.
a) Do these data provide convincing evidence of a difference in the primate densityin flooded and unflooded forests in Amazonia? Provide appropriate statistical
justification for your conclusion.
b) Based on your results in part (a), would you recommend using a stratified sample?
Justify your recommendation with a statistical argument.
4
Unlock Deck
Unlock for access to all 27 flashcards in this deck.
Unlock Deck
k this deck
5
In an introductory marketing class students were presented with 6 items they could
bid on in an auction. They were asked to bid privately and also estimate the "typical"
bid for each item by their classmates. The items were randomly selected from a large
list of items that students might purchase. An initial analysis of the data established
the plausibility that the distribution of differences (estimated - actual) is
approximately normal.
bid on in an auction. They were asked to bid privately and also estimate the "typical"
bid for each item by their classmates. The items were randomly selected from a large
list of items that students might purchase. An initial analysis of the data established
the plausibility that the distribution of differences (estimated - actual) is
approximately normal.
Unlock Deck
Unlock for access to all 27 flashcards in this deck.
Unlock Deck
k this deck
6
A number of butterfly species mate for hours, and if a mating couple is disturbed, one
of the butterflies is responsible for flying, carrying its partner with it. Not only are
mating pairs more noticeable to predators, but the added weight may hamper the
flight during escape. Random samples of Green-veined White (Pieris napi)
butterflies were the subjects of a Swedish study to investigate the escape flights of
single butterflies and of mating pairs when exposed to a predator. Data on the initial
takeoff escape velocities are presented below. The investigators considered
performing a hypothesis test to determine if there was evidence that the mean take off
escape velocity was different for singles and pairs. Using a graphical procedure of
your choice, determine if the t-test is appropriate.
Unlock Deck
Unlock for access to all 27 flashcards in this deck.
Unlock Deck
k this deck
7
Unlock Deck
Unlock for access to all 27 flashcards in this deck.
Unlock Deck
k this deck
8
When analyzing paired data the population distribution of differences, not
the separate population distributions, should be credibly normal.
the separate population distributions, should be credibly normal.
Unlock Deck
Unlock for access to all 27 flashcards in this deck.
Unlock Deck
k this deck
9
Unlock Deck
Unlock for access to all 27 flashcards in this deck.
Unlock Deck
k this deck
10
Two samples are said to be independent when the selection of the
individuals in one sample has no bearing on the selection of those in the
other sample.
individuals in one sample has no bearing on the selection of those in the
other sample.
Unlock Deck
Unlock for access to all 27 flashcards in this deck.
Unlock Deck
k this deck
11
In many animal species the males and females differ slightly in structure, coloring,
and/or size. The hominid species Australopithecus is thought to have lived about 3.2
million years ago. ("Lucy," the famous near-complete skeleton discovered in 1974, is
an Australopithecus.) Forensic anthropologists use partial skeletal remains to
estimate the mass of an individual. The data below are estimates of masses from
partial skeletal remains of this species found in sub-Saharan Africa. Appropriate
graphical displays of the data indicate that it is reasonable to assume that the
population distributions of mass are approximately normal for both males and
females. You may also assume that these samples are representative of the respective
populations. Do these data provide convincing evidence that the mean estimated masses differ for
Australopithecus males and females? Provide appropriate statistical justification for
your conclusion.
and/or size. The hominid species Australopithecus is thought to have lived about 3.2
million years ago. ("Lucy," the famous near-complete skeleton discovered in 1974, is
an Australopithecus.) Forensic anthropologists use partial skeletal remains to
estimate the mass of an individual. The data below are estimates of masses from
partial skeletal remains of this species found in sub-Saharan Africa. Appropriate
graphical displays of the data indicate that it is reasonable to assume that the
population distributions of mass are approximately normal for both males and
females. You may also assume that these samples are representative of the respective
populations.
Do these data provide convincing evidence that the mean estimated masses differ forAustralopithecus males and females? Provide appropriate statistical justification for
your conclusion.
Unlock Deck
Unlock for access to all 27 flashcards in this deck.
Unlock Deck
k this deck
12
"Tail-chasing" by dogs is an anxiety disorder characterized by circling behavior with
the dog's attention directed toward its tail. There may be many reasons for tail-
chasing behaviors. To investigate the potential for biochemical causes, a study was
performed at a small animal clinic at a university. Blood samples were taken from
random sample of 15 dogs brought to the clinic by owners worried about the tail-
chasing behaviors of their dogs. A control group consisting of a random sample of 15
dogs brought to the clinic for other reasons contributed blood samples with the
owner's permission. The mean lipoprotein density for the tail-chasing group was 12
mg/dl, and the standard deviation was 2.24 mg/dl. The corresponding statistics for
the control group were 13 mg/dl and 1.73 mg/dl. There was no indication of
skewness in either sample distribution.
a) Is there sufficient evidence to conclude that there is a difference in mean
lipoprotein density in these two samples? Provide statistical justification for your
response.
b) Irrespective of your response in part (a), consider the design of this study. Would
a statistically significant difference in mean lipoprotein density be sufficient to
make a case that lipoprotein density is the cause of tail-chasing behavior in dogs?
Why or why not?
Unlock Deck
Unlock for access to all 27 flashcards in this deck.
Unlock Deck
k this deck
13
Unlock Deck
Unlock for access to all 27 flashcards in this deck.
Unlock Deck
k this deck
14
"Tail-chasing" by dogs is an anxiety disorder characterized by circling behavior with
the dog's attention directed toward its tail. There may be many reasons for tail-
chasing behaviors. To investigate the potential for biochemical causes, a study was
performed at a small animal clinic at a university. Blood samples were taken from a
random sample of 15 dogs brought to the clinic by owners worried about the tail-
chasing behaviors of their dogs. A control group consisting of a random sample of 15
dogs brought to the clinic for other reasons contributed blood samples with the
owner's permission. The mean triglyceride level for the tail-chasing group was 68
mg/dl, and the standard deviation was 19.36 mg/dl. The corresponding statistics for
the control group were 61 mg/dl and 11.62 mg/dl. Both sample distributions were
approximately symmetric.
a) Is there convincing evidence of a difference in mean triglyceride level in these
two populations? Provide statistical justification for your response.
b) Irrespective of your response in part (a), consider the design of this study. Would
a statistically significant difference in mean triglyceride levels be sufficient to
make a case that triglyceride level is a cause of tail-chasing behavior in dogs?
Why or why not?
Unlock Deck
Unlock for access to all 27 flashcards in this deck.
Unlock Deck
k this deck
15
Unlock Deck
Unlock for access to all 27 flashcards in this deck.
Unlock Deck
k this deck
16
When wildlife biologists study small animals, the animals are trapped and then
anesthetized to prevent discomfort to the animal. A study of the effect of the
anesthetic, Isoflurane, on eastern gray squirrels (Sciurus carolinensis) resulted in the
pulse data presented below. The biologists were interested in comparing the effects
of Isoflurane in two different seasons, winter and summer. An initial analysis of the data revealed that it was reasonable to assume the
distribution of pulses for each season is approximately normal. It was also judged to
be reasonable to regard these samples as representative of the eastern gray squirrel
population.
a) Test the hypothesis of no difference in eastern gray squirrel mean pulse for winter
and summer.
b) Do the data indicate that the mean pulse differs for the two seasons? Provide an
appropriate statistical justification using your response in part (a).
anesthetized to prevent discomfort to the animal. A study of the effect of the
anesthetic, Isoflurane, on eastern gray squirrels (Sciurus carolinensis) resulted in the
pulse data presented below. The biologists were interested in comparing the effects
of Isoflurane in two different seasons, winter and summer.
An initial analysis of the data revealed that it was reasonable to assume thedistribution of pulses for each season is approximately normal. It was also judged to
be reasonable to regard these samples as representative of the eastern gray squirrel
population.
a) Test the hypothesis of no difference in eastern gray squirrel mean pulse for winter
and summer.
b) Do the data indicate that the mean pulse differs for the two seasons? Provide an
appropriate statistical justification using your response in part (a).
Unlock Deck
Unlock for access to all 27 flashcards in this deck.
Unlock Deck
k this deck
17
Unlock Deck
Unlock for access to all 27 flashcards in this deck.
Unlock Deck
k this deck
18
Unlock Deck
Unlock for access to all 27 flashcards in this deck.
Unlock Deck
k this deck
19
Unlock Deck
Unlock for access to all 27 flashcards in this deck.
Unlock Deck
k this deck
20
Unlock Deck
Unlock for access to all 27 flashcards in this deck.
Unlock Deck
k this deck
21
When wildlife biologists study small animals, the animals are trapped and then
anesthetized to prevent discomfort to the animal. A study of the effect of the
anesthetic, Isoflurane, on Allegheny woodrats (Neotoma magister) resulted in the
heartbeat data presented below. The biologists were interested in comparing the
effects of Isoflurane in two different seasons, winter and summer. b) Do the data indicate that the mean heartbeat rates differ? Provide an appropriate
statistical justification using your response in part (a).
anesthetized to prevent discomfort to the animal. A study of the effect of the
anesthetic, Isoflurane, on Allegheny woodrats (Neotoma magister) resulted in the
heartbeat data presented below. The biologists were interested in comparing the
effects of Isoflurane in two different seasons, winter and summer.
b) Do the data indicate that the mean heartbeat rates differ? Provide an appropriatestatistical justification using your response in part (a).
Unlock Deck
Unlock for access to all 27 flashcards in this deck.
Unlock Deck
k this deck
22
Unlock Deck
Unlock for access to all 27 flashcards in this deck.
Unlock Deck
k this deck
23
Unlock Deck
Unlock for access to all 27 flashcards in this deck.
Unlock Deck
k this deck
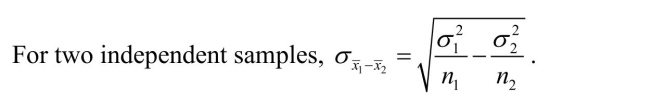
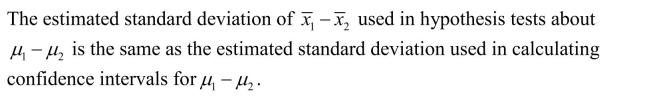
24
Inferences about the difference between two means fall into two categories: the
samples are independent, or the samples are paired.
a) What considerations would lead you to use the techniques for independent
samples rather than those for paired samples? You may use examples to
illustrate your ideas, but examples alone are not sufficient.
b) How do the analyses of independent samples and paired samples differ? In your
response, consider the hypotheses, methods, assumptions, and calculations.
Unlock Deck
Unlock for access to all 27 flashcards in this deck.
Unlock Deck
k this deck
25
Inferences about the difference between two means fall into two categories: the
samples are independent, or the samples are paired.
a) What considerations would lead you to use the techniques for independent
samples rather than those for paired samples? You may use examples to
illustrate your ideas, but examples alone are not sufficient.
b) How do the analyses of independent samples and paired samples differ? In your
response, consider the hypotheses, methods, assumptions, and calculations.
samples are independent, or the samples are paired.
a) What considerations would lead you to use the techniques for independent
samples rather than those for paired samples? You may use examples to
illustrate your ideas, but examples alone are not sufficient.
b) How do the analyses of independent samples and paired samples differ? In your
response, consider the hypotheses, methods, assumptions, and calculations.
Unlock Deck
Unlock for access to all 27 flashcards in this deck.
Unlock Deck
k this deck
26
Unlock Deck
Unlock for access to all 27 flashcards in this deck.
Unlock Deck
k this deck
27
b) Calculate and interpret the 95% confidence interval in the context of the problem.c) The investigator noticed that many more male pairs than female pairs were
actually stalked by cheetah. Two theories have been proposed for this difference.
The first theory is that the gazelle females are generally more vigilant than males.
The second theory is that females generally graze near the centers of the herds,
protecting the young, and are less accessible to predators.
i) Is it possible to use investigator's data be used to support or refute the theory
that females are more vigilant than males? Is so, how? If not, why not?
ii) Is it possible to use investigator's data be used to support or refute the theory
that females generally graze near the centers of the herds? Is so, how? If not,
why not?
Unlock Deck
Unlock for access to all 27 flashcards in this deck.
Unlock Deck
k this deck
Unlock Deck
Unlock for access to all 27 flashcards in this deck.


