Deck 20: International Trade
Full screen (f)
Question
Question
Question
Question
Question
Question
Question
Question
Question
Question
Question
Question
Question
Question
Question
Question
Question
Question
Question
Question
Question
Question
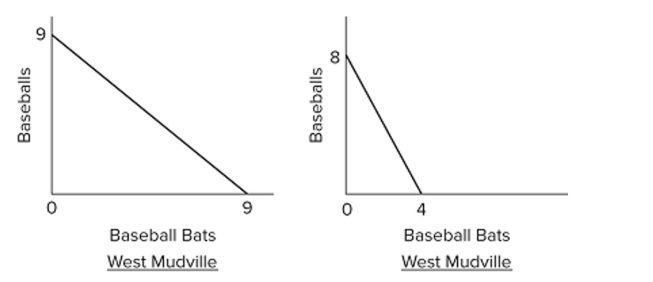 Assuming labor forces of equal size, the production possibilities curves suggest that workers in West Mudville will have
A) lower wages than workers in East Mudville before trade but equal wages after trade.
B) higher wages than workers in East Mudville both before and after trade.
C) lower wages than workers in East Mudville both before and after trade.
D) higher wages than workers in East Mudville before trade but lower wages after trade.
Question
Question
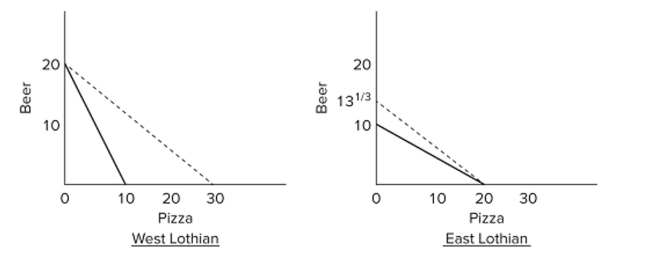 In the accompanying diagrams, solid lines are production possibilities curves, and the dashed lines are trading possibilities curves. The trading possibilities curves imply that
A) both countries have a trade surplus that will result in economic growth.
B) the domestic production possibilities curves entail unemployment and/or the domestic misallocation of resources.
C) world resources will be allocated more efficiently if the two nations specialize and trade based on comparative advantage.
D) both nations will be worse off as a result of international specialization and trade.
Question
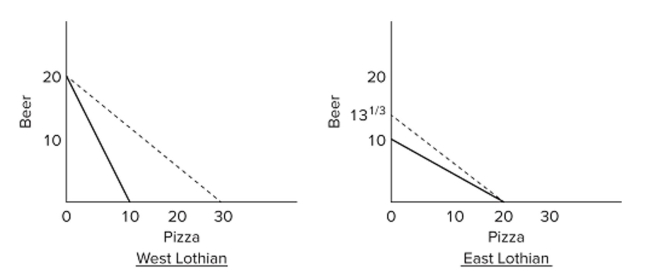 In the accompanying diagrams, solid lines are production possibilities curves, and the dashed lines are trading possibilities curves. The data suggest that
A) West Lothian should specialize in, and export, beer.
B) both countries will be better off if they do not engage in specialization and trade involving these two products.
C) West Lothian should specialize in, and export, pizza.
D) East Lothian should specialize in, and export, beer.
Question
Question
 Refer to the graphs. Stanville has a comparative advantage in producing
A) product A.
B) product B.
C) both product A and B.
D) neither product A nor B.
Question
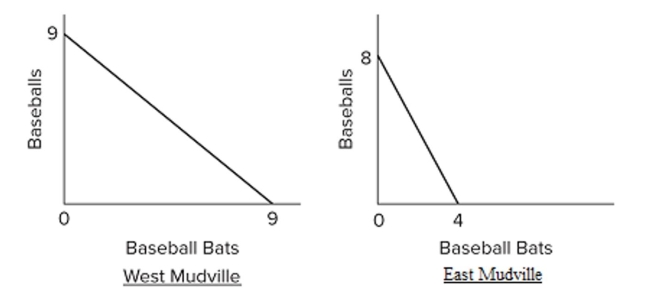 The production possibilities curves suggest that rev: 09_17_2020_QC_CS-228777
A) West Mudville should specialize in, and export, baseball bats.
B) West Mudville should specialize in, and export, both baseballs and baseball bats.
C) East Mudville should specialize in, and export, baseball bats.
D) workers will try to immigrate from West Mudville to East Mudville.
Question
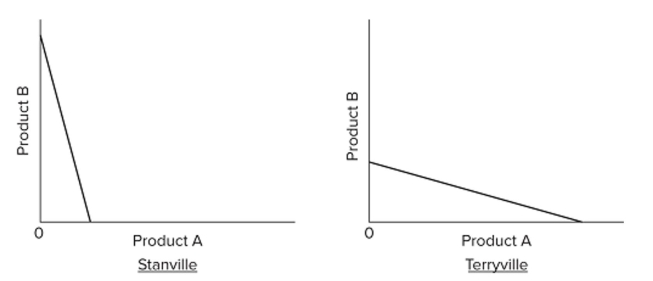 Refer to the graphs. Terryville has a comparative advantage in producing
A) product A.
B) product B.
C) both products A and B.
D) neither product A nor B.
Question
Question
 In the accompanying diagrams, solid lines are production possibilities curves, and the dashed lines are trading possibilities curves. The opportunity cost of producing a
A) pizza is 2 beers in both countries.
B) beer is ½ pizza in both countries.
C) pizza in East Lothian is 1 beer.
D) beer in West Lothian is ½ pizza.
Question
Question
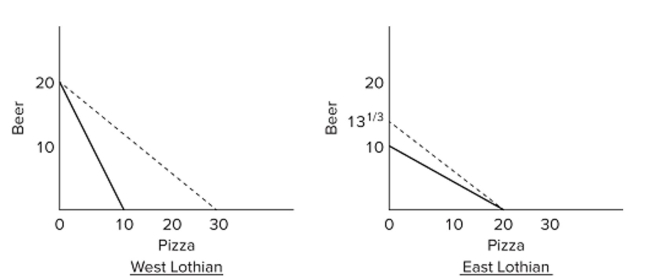 In the accompanying diagrams, solid lines are production possibilities curves, and the dashed lines are trading possibilities curves. The trading possibilities curves suggest that the terms of trade are
A) 1.5 beers for 1 pizza.
B) 1 beer for 2 pizzas.
C) 2 beers for 1 pizza.
D) 1 beer for 1.5 pizzas.
Question
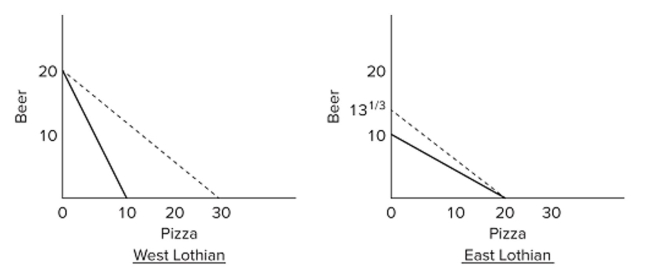 In the accompanying diagrams, solid lines are production possibilities curves, and the dashed lines are trading possibilities curves. The data contained in the production possibilities curves are based
On the assumption of
A) imperfect substitutability of resources between beer and pizza production.
B) constant costs.
C) decreasing costs.
D) increasing costs.
Question
Question
Question
Question
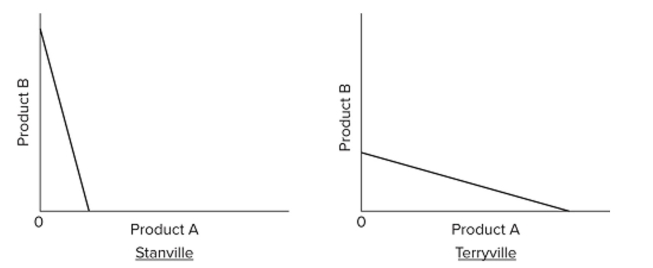 Refer to the graphs. These production possibilities curves
A) demonstrate that there can be gains from specialization and trade between the two nations.
B) reflect the law of increasing opportunity costs.
C) reflect the law of diminishing marginal utility.
D) imply that specialization will be incomplete.
Question
Question
Question
Question
Question
Question
Question
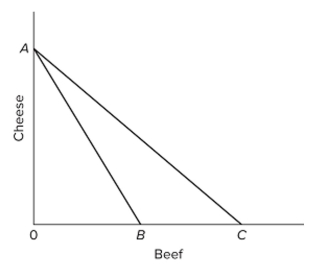 Refer to the given diagram, in which line AB is the U.S. production possibilities curve and AC is its trading possibilities curve. The international exchange ratio between beef and cheese (terms of
Trade)
A) is the absolute value of the slope of line AB.
B) is the absolute value of the slope of line AC.
C) could lie anywhere between the absolute value of the slopes of lines AB and AC.
D) cannot be determined on the basis of this information.
Question
Question
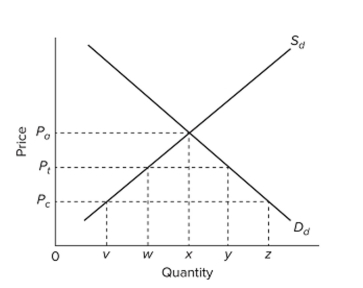
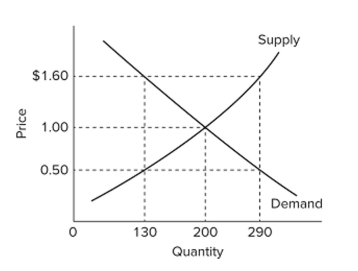 Refer to the diagram, which shows the domestic demand and supply curves for a specific standardized product in a particular nation. If the world price for this product is $0.50, this nation will
Experience a domestic
A) shortage of 160 units, which it will meet with 160 units of imports.
B) shortage of 160 units, which will increase the domestic price to $1.60.
C) surplus of 160 units, which it will export.
D) surplus of 160 units, which will reduce the world price to $1.00.
Question
Question
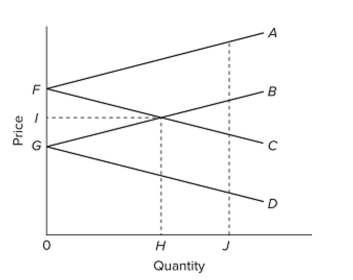
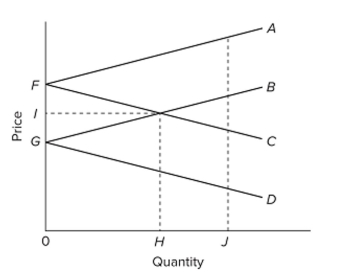 Refer to the diagram, which pertains to two nations and a specific product. Point G is the
A) domestic price for the nation represented by lines FA and FC.
B) world equilibrium price.
C) domestic price for the nation represented by lines GB and GD.
D) price above the world equilibrium price.
Question
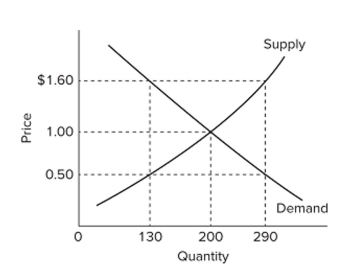 Refer to the diagram, which shows the domestic demand and supply curves for a specific standardized product in a particular nation. If the world price of this product is $1, this nation will
A) export all of the product.
B) import all of the product.
C) import some of the product and produce some of the product domestically.
D) neither export nor import the product.
Question
 Refer to the diagram pertaining to two nations and a specific product. Lines FA and GB are
A) domestic supply curves for two countries.
B) domestic demand curves for two countries.
C) import demand curves for two countries.
D) export supply curves for two countries.
Question
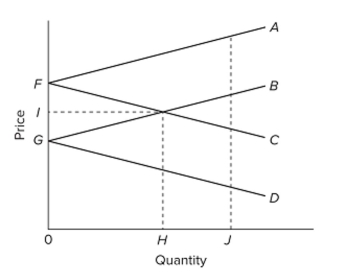 Refer to the diagram, which pertains to two nations and a specific product. Lines FC and GD are
A) domestic supply curves for two countries.
B) domestic demand curves for two countries.
C) import demand curves for two countries.
D) export supply curves for two countries.
Question
Question
Question
Question
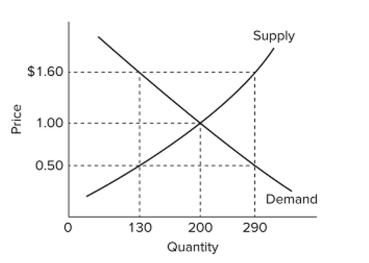 Refer to the diagram, which shows the domestic demand and supply curves for a specific standardized product in a particular nation. If the world price for this product is $1.60, this nation will
Experience a domestic
A) shortage of 160 units, which it will meet with 160 units of imports.
B) shortage of 160 units, which will increase the domestic price to $1.60.
C) surplus of 160 units, which it will export.
D) surplus of 160 units, which will reduce the world price to $1.00.
Question
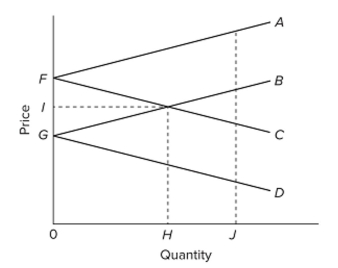 Refer to the diagram, which pertains to two nations and a specific product. The equilibrium world price occurs at
A) F.
B) I.
C) G.
D) J.
Question
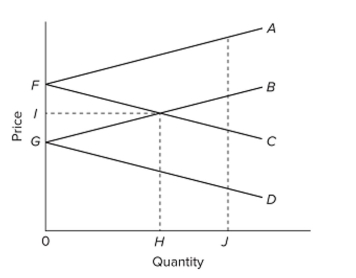 Refer to the diagram, which pertains to two nations and a specific product. In equilibrium, the nation represented by lines FA and FC will
A) export H to the country represented by lines GB and GD.
B) import H from the country represented by lines GB and GD.
C) pay price F for its imports.
D) receive price G for its exports.
Question
Question
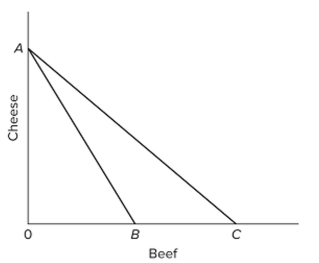 Refer to the given diagram, in which line AB is the U.S. production possibilities curve and AC is its trading possibilities curve. We can conclude that the United States
A) has chosen to specialize in the production of cheese.
B) has chosen to specialize in the production of beef.
C) has decided to trade beef for cheese.
D) is relatively more efficient than its trading partners in producing both cheese and beef.
Question
Question
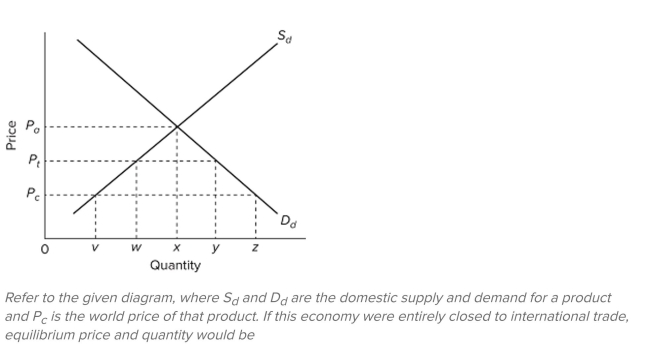
 Refer to the diagram, where and
are the domestic supply and demand for a product and
is
The world price of that product. If the economy is opened to free trade, the price and quantity sold of
This product would be
A)
B)
C)
D)
Question
Question
Question
Question
Question
Question
Question
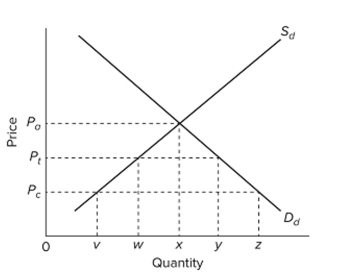 Refer to the diagram, where and
are the domestic supply and demand for a product and
is
The world price of that product. With free trade, that is, assuming no tariff, the outputs produced by
Domestic and foreign producers, respectively, would be
A) v and vz.
B) w and wy.
C) w and wz.
D) vx and xz.
Question
Question
Question
Question
Question
Question
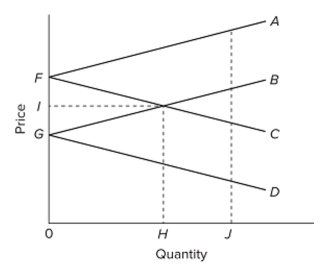 Refer to the diagram, which pertains to two nations and a specific product. The equilibrium level of exports and imports occurs at
A) H, where GB and FC intersect.
B) J, where the vertical distance between A and B equals the vertical distance between C and D.
C) world price level F.
D) world price level G.
Question
Question
Question
Question
A)
B)
C)
D)
Question

Unlock Deck
Sign up to unlock the cards in this deck!
Unlock Deck
Unlock Deck
1/339
Play
Full screen (f)
Deck 20: International Trade
1
As a percentage of GDP, U.S. exports are
A) greater than U.S. imports.
B) about 20 percent.
C) considerably lower than in several other industrially advanced nations.
D) higher than in Canada but lower than in Germany.
A) greater than U.S. imports.
B) about 20 percent.
C) considerably lower than in several other industrially advanced nations.
D) higher than in Canada but lower than in Germany.
considerably lower than in several other industrially advanced nations.
2
Countries engaged in international trade specialize in production based on
A) relative levels of GDP.
B) comparative advantage.
C) relative exchange rates.
D) relative inflation rates.
A) relative levels of GDP.
B) comparative advantage.
C) relative exchange rates.
D) relative inflation rates.
comparative advantage.
3
The terms of trade reflect the
A) rate at which gold exchanges internationally for any domestic currency.
B) ratio at which nations will exchange two goods.
C) fact that the gains from trade will be equally divided.
D) cost conditions embodied in a single country's production possibilities curve.
A) rate at which gold exchanges internationally for any domestic currency.
B) ratio at which nations will exchange two goods.
C) fact that the gains from trade will be equally divided.
D) cost conditions embodied in a single country's production possibilities curve.
ratio at which nations will exchange two goods.
4
The United States' most important trading partner quantitatively is
A) China.
B) Canada.
C) Mexico.
D) Japan.
A) China.
B) Canada.
C) Mexico.
D) Japan.
Unlock Deck
Unlock for access to all 339 flashcards in this deck.
Unlock Deck
k this deck
5
Which of the following is an example of a labor-intensive commodity?
A) digital cameras
B) beer
C) aspirin tablets
D) gasoline
A) digital cameras
B) beer
C) aspirin tablets
D) gasoline
Unlock Deck
Unlock for access to all 339 flashcards in this deck.
Unlock Deck
k this deck
6
In 2018, the United States
A) imported more services than it exported.
B) imported more goods than it exported.
C) traded mainly with developing nations such as Mexico and India.
D) had a small trade surplus in goods and services.
A) imported more services than it exported.
B) imported more goods than it exported.
C) traded mainly with developing nations such as Mexico and India.
D) had a small trade surplus in goods and services.
Unlock Deck
Unlock for access to all 339 flashcards in this deck.
Unlock Deck
k this deck
7
Differences in production efficiencies among nations in producing a particular good result from
A) different endowments of fertile soil.
B) different amounts of skilled labor.
C) different levels of technological knowledge.
D) all of these.
A) different endowments of fertile soil.
B) different amounts of skilled labor.
C) different levels of technological knowledge.
D) all of these.
Unlock Deck
Unlock for access to all 339 flashcards in this deck.
Unlock Deck
k this deck
8
In terms of absolute dollar volume, the top 3 leaders in world exports are
A) Japan, China, and the European Union.
B) the United States, England, and Canada.
C) Germany, England, and the United States.
D) China, the United States, and Germany.
A) Japan, China, and the European Union.
B) the United States, England, and Canada.
C) Germany, England, and the United States.
D) China, the United States, and Germany.
Unlock Deck
Unlock for access to all 339 flashcards in this deck.
Unlock Deck
k this deck
9
The accompanying tables give production possibilities data for Gamma and Sigma. All data are in tons.
Gamma's production possibilities
Sigma's production possibilities
Assume that before specialization and trade, Gamma and Sigma both chose production possibility "A)" Now if each specializes according to comparative advantage, the gains from specialization and Trade will be
A) 40 tons of pots.
B) 20 tons of tea and 20 tons of pots.
C) 20 tons of tea.
D) 40 tons of tea.
Unlock Deck
Unlock for access to all 339 flashcards in this deck.
Unlock Deck
k this deck
10
Assume that by devoting all of its resources to the production of X, nation Alpha can produce 40 units of X. By devoting all of its resources to Y, Alpha can produce 60Y. Comparable figures for
Nation Beta are 60X and 40Y. We can conclude that
A) the terms of trade will be 3X equals 1Y.
B) Alpha should specialize in Y and Beta in X.
C) Alpha should specialize in X and Beta in Y.
D) there is no basis for mutually beneficial specialization and trade.
Nation Beta are 60X and 40Y. We can conclude that
A) the terms of trade will be 3X equals 1Y.
B) Alpha should specialize in Y and Beta in X.
C) Alpha should specialize in X and Beta in Y.
D) there is no basis for mutually beneficial specialization and trade.
Unlock Deck
Unlock for access to all 339 flashcards in this deck.
Unlock Deck
k this deck
11
Which of the following is an example of a capital-intensive commodity?
A) clothing
B) wool
C) sunflower seeds
D) chemicals
A) clothing
B) wool
C) sunflower seeds
D) chemicals
Unlock Deck
Unlock for access to all 339 flashcards in this deck.
Unlock Deck
k this deck
12
Which of the following statements is false?
A) In recent years, the United States has had large annual trade deficits in goods.
B) The United States imports some of the same categories of goods as it exports.
C) China has the largest share of world exports.
D) As a percentage of GDP, U.S. exports are the highest among the industrially advanced nations.
Unlock Deck
Unlock for access to all 339 flashcards in this deck.
Unlock Deck
k this deck
13
The accompanying tables give production possibilities data for Gamma and Sigma. All data are in tons.
Gamma's production possibilities
Sigma's production possibilities
What are the limits of the terms of trade between Gamma and Sigma?
A) 1 tea = 2 pots to 1 tea = 6 pots
B) 1 tea = 3 pots to 1 tea = 6 pots
C) 1 tea = 2 pots to 1 tea = 3.5 pots
D) 1 tea = 1 pot to 1 tea = 3 pots
Gamma's production possibilities
Sigma's production possibilities
What are the limits of the terms of trade between Gamma and Sigma?
A) 1 tea = 2 pots to 1 tea = 6 pots
B) 1 tea = 3 pots to 1 tea = 6 pots
C) 1 tea = 2 pots to 1 tea = 3.5 pots
D) 1 tea = 1 pot to 1 tea = 3 pots
Unlock Deck
Unlock for access to all 339 flashcards in this deck.
Unlock Deck
k this deck
14
If country A can produce both goods X and Y more efficiently, that is, with smaller absolute amounts of resources, than can country B,
A) mutually advantageous specialization and trade between A and B may still be possible.
B) we can conclude that A is an industrially advanced economy and B is a developing economy.
C) it will necessarily be advantageous for B to import both X and Y from A.
D) then there is no possible basis for mutually advantageous specialization and trade between A and B.
Unlock Deck
Unlock for access to all 339 flashcards in this deck.
Unlock Deck
k this deck
15
In order for mutually beneficial trade to occur between two otherwise isolated nations,
A) each nation must be able to produce at least one good absolutely cheaper than the other.
B) each nation must be able to produce at least one good relatively cheaper than the other.
C) each nation must face constant costs in the production of the good it exports.
D) one nation's production must be labor-intensive, while the other nation's production is capital-intensive.
Unlock Deck
Unlock for access to all 339 flashcards in this deck.
Unlock Deck
k this deck
16
Which country has the largest share of total world exports?
A) Japan
B) Germany
C) United States
D) China
A) Japan
B) Germany
C) United States
D) China
Unlock Deck
Unlock for access to all 339 flashcards in this deck.
Unlock Deck
k this deck
17
The accompanying tables give production possibilities data for Gamma and Sigma. All data are in tons.
Gamma's production possibilities
Sigma's production possibilities
On the basis of this information,
A) Gamma should export both tea and pots to Sigma.
B) Sigma should export tea to Gamma, and Gamma should export pots to Sigma.
C) Gamma should export tea to Sigma, and Sigma should export pots to Gamma.
D) Gamma should export tea to Sigma, but it will not be pro?table for the two nations to exchange pots.
Unlock Deck
Unlock for access to all 339 flashcards in this deck.
Unlock Deck
k this deck
18
Which of the following is an example of a land-intensive commodity?
A) chemicals
B) autos
C) watches
D) wool
A) chemicals
B) autos
C) watches
D) wool
Unlock Deck
Unlock for access to all 339 flashcards in this deck.
Unlock Deck
k this deck
19
U.S. exports of goods and services (on a national income account basis) are about
A) 20 percent of U.S. GDP.
B) 8 percent of U.S. GDP.
C) 28 percent of U.S. GDP.
D) 12 percent of U.S. GDP.
A) 20 percent of U.S. GDP.
B) 8 percent of U.S. GDP.
C) 28 percent of U.S. GDP.
D) 12 percent of U.S. GDP.
Unlock Deck
Unlock for access to all 339 flashcards in this deck.
Unlock Deck
k this deck
20
In recent years, the United States has
A) exported more services abroad than it has imported.
B) had a small goods trade surplus with Japan.
C) had a large goods trade surplus with the rest of the world.
D) maintained an overall trade surplus (goods and services combined) with the rest of the world.
A) exported more services abroad than it has imported.
B) had a small goods trade surplus with Japan.
C) had a large goods trade surplus with the rest of the world.
D) maintained an overall trade surplus (goods and services combined) with the rest of the world.
Unlock Deck
Unlock for access to all 339 flashcards in this deck.
Unlock Deck
k this deck
21
The tables give production possibilities data for two countries, Alpha and Beta, which have populations of equal size.
Suppose that before specialization and trade, Alpha chose production alternative C and Beta chose
Production alternative B. After specialization and trade, the gains will be
A) 20 tons of ?sh.
B) 20 tons of chips.
C) 20 tons of ?sh and 20 tons of chips.
D) 240 tons of ?sh and 20 tons of chips.
Suppose that before specialization and trade, Alpha chose production alternative C and Beta chose
Production alternative B. After specialization and trade, the gains will be
A) 20 tons of ?sh.
B) 20 tons of chips.
C) 20 tons of ?sh and 20 tons of chips.
D) 240 tons of ?sh and 20 tons of chips.
Unlock Deck
Unlock for access to all 339 flashcards in this deck.
Unlock Deck
k this deck
22
Assuming labor forces of equal size, the production possibilities curves suggest that workers in West Mudville will haveA) lower wages than workers in East Mudville before trade but equal wages after trade.
B) higher wages than workers in East Mudville both before and after trade.
C) lower wages than workers in East Mudville both before and after trade.
D) higher wages than workers in East Mudville before trade but lower wages after trade.
Unlock Deck
Unlock for access to all 339 flashcards in this deck.
Unlock Deck
k this deck
23
If two nations have straight-line production possibilities curves,
A) then their trading possibilities curves must lie inside the production possibilities curves.
B) there will be no basis for mutually advantageous trade.
C) there will be a basis for mutually advantageous trade whether the slopes are equal or not.
D) there will be a basis for mutually advantageous trade provided the slopes differ.
Unlock Deck
Unlock for access to all 339 flashcards in this deck.
Unlock Deck
k this deck
24
In the accompanying diagrams, solid lines are production possibilities curves, and the dashed lines are trading possibilities curves. The trading possibilities curves imply thatA) both countries have a trade surplus that will result in economic growth.
B) the domestic production possibilities curves entail unemployment and/or the domestic misallocation of resources.
C) world resources will be allocated more efficiently if the two nations specialize and trade based on comparative advantage.
D) both nations will be worse off as a result of international specialization and trade.
Unlock Deck
Unlock for access to all 339 flashcards in this deck.
Unlock Deck
k this deck
25
In the accompanying diagrams, solid lines are production possibilities curves, and the dashed lines are trading possibilities curves. The data suggest thatA) West Lothian should specialize in, and export, beer.
B) both countries will be better off if they do not engage in specialization and trade involving these two products.
C) West Lothian should specialize in, and export, pizza.
D) East Lothian should specialize in, and export, beer.
Unlock Deck
Unlock for access to all 339 flashcards in this deck.
Unlock Deck
k this deck
26
The primary gain from international trade is
A) increased employment in the domestic export sector.
B) more goods than would be attainable through domestic production alone.
C) tariff revenue.
D) increased employment in the domestic import sector.
A) increased employment in the domestic export sector.
B) more goods than would be attainable through domestic production alone.
C) tariff revenue.
D) increased employment in the domestic import sector.
Unlock Deck
Unlock for access to all 339 flashcards in this deck.
Unlock Deck
k this deck
27
Refer to the graphs. Stanville has a comparative advantage in producingA) product A.
B) product B.
C) both product A and B.
D) neither product A nor B.
Unlock Deck
Unlock for access to all 339 flashcards in this deck.
Unlock Deck
k this deck
28
The production possibilities curves suggest that rev: 09_17_2020_QC_CS-228777A) West Mudville should specialize in, and export, baseball bats.
B) West Mudville should specialize in, and export, both baseballs and baseball bats.
C) East Mudville should specialize in, and export, baseball bats.
D) workers will try to immigrate from West Mudville to East Mudville.
Unlock Deck
Unlock for access to all 339 flashcards in this deck.
Unlock Deck
k this deck
29
Refer to the graphs. Terryville has a comparative advantage in producingA) product A.
B) product B.
C) both products A and B.
D) neither product A nor B.
Unlock Deck
Unlock for access to all 339 flashcards in this deck.
Unlock Deck
k this deck
30
The tables give production possibilities data for two countries, Alpha and Beta, which have populations of equal size. Beta
A) should specialize in catching ?sh and trade with Alpha for chips.
B) should specialize in producing chips and trade with Alpha for ?sh.
C) will not realize gains from specialization and trade.
D) will export both ?sh and chips to Alpha.
Unlock Deck
Unlock for access to all 339 flashcards in this deck.
Unlock Deck
k this deck
31
In the accompanying diagrams, solid lines are production possibilities curves, and the dashed lines are trading possibilities curves. The opportunity cost of producing aA) pizza is 2 beers in both countries.
B) beer is ½ pizza in both countries.
C) pizza in East Lothian is 1 beer.
D) beer in West Lothian is ½ pizza.
Unlock Deck
Unlock for access to all 339 flashcards in this deck.
Unlock Deck
k this deck
32
The tables give production possibilities data for two countries, Alpha and Beta, which have populations of equal size.
The given data show that
A) Beta has a comparative advantage in producing chips.
B) Alpha has a comparative advantage in catching ?sh.
C) Alpha is subject to constant costs and Beta is subject to increasing costs.
D) Beta is more e?cient than Alpha both in catching ?sh and in producing chips.
The given data show that
A) Beta has a comparative advantage in producing chips.
B) Alpha has a comparative advantage in catching ?sh.
C) Alpha is subject to constant costs and Beta is subject to increasing costs.
D) Beta is more e?cient than Alpha both in catching ?sh and in producing chips.
Unlock Deck
Unlock for access to all 339 flashcards in this deck.
Unlock Deck
k this deck
33
In the accompanying diagrams, solid lines are production possibilities curves, and the dashed lines are trading possibilities curves. The trading possibilities curves suggest that the terms of trade areA) 1.5 beers for 1 pizza.
B) 1 beer for 2 pizzas.
C) 2 beers for 1 pizza.
D) 1 beer for 1.5 pizzas.
Unlock Deck
Unlock for access to all 339 flashcards in this deck.
Unlock Deck
k this deck
34
In the accompanying diagrams, solid lines are production possibilities curves, and the dashed lines are trading possibilities curves. The data contained in the production possibilities curves are basedOn the assumption of
A) imperfect substitutability of resources between beer and pizza production.
B) constant costs.
C) decreasing costs.
D) increasing costs.
Unlock Deck
Unlock for access to all 339 flashcards in this deck.
Unlock Deck
k this deck
35
If a nation has a comparative advantage in the production of X, this means the nation
A) cannot benefit by producing and trading this product.
B) must give up less of other goods than other nations in producing a unit of X.
C) has a production possibilities curve identical to those of other nations.
D) is not subject to increasing opportunity costs.
A) cannot benefit by producing and trading this product.
B) must give up less of other goods than other nations in producing a unit of X.
C) has a production possibilities curve identical to those of other nations.
D) is not subject to increasing opportunity costs.
Unlock Deck
Unlock for access to all 339 flashcards in this deck.
Unlock Deck
k this deck
36
The tables give production possibilities data for two countries, Alpha and Beta, which have populations of equal size.
Assume the production possibilities in Beta double at alternatives A through E, while remaining as
Shown in the table for Alpha. As a result, Beta should
A) continue to specialize in producing chips.
B) continue to specialize in ?shing.
C) no longer specialize and trade.
D) specialize both in ?shing and in producing chips and sell the surplus to Alpha.
Unlock Deck
Unlock for access to all 339 flashcards in this deck.
Unlock Deck
k this deck
37
In the theory of comparative advantage, a good should be produced in that nation where
A) the production possibilities line lies further to the right than the trading possibilities line.
B) its cost is least in terms of alternative goods that might otherwise be produced.
C) its absolute cost in terms of real resources used is least.
D) its absolute money cost of production is least.
A) the production possibilities line lies further to the right than the trading possibilities line.
B) its cost is least in terms of alternative goods that might otherwise be produced.
C) its absolute cost in terms of real resources used is least.
D) its absolute money cost of production is least.
Unlock Deck
Unlock for access to all 339 flashcards in this deck.
Unlock Deck
k this deck
38
Refer to the graphs. These production possibilities curvesA) demonstrate that there can be gains from specialization and trade between the two nations.
B) reflect the law of increasing opportunity costs.
C) reflect the law of diminishing marginal utility.
D) imply that specialization will be incomplete.
Unlock Deck
Unlock for access to all 339 flashcards in this deck.
Unlock Deck
k this deck
39
The fact that international specialization and trade based on comparative advantage can increase world output is demonstrated by the reality that
A) the production possibilities curves of any two nations are identical.
B) a nation's production possibilities and trading possibilities lines coincide.
C) a nation's trading possibilities line lies to the right of its production possibilities line.
D) a nation's production possibilities line lies to the right of its trading possibilities line.
Unlock Deck
Unlock for access to all 339 flashcards in this deck.
Unlock Deck
k this deck
40
The tables give production possibilities data for two countries, Alpha and Beta, which have populations of equal size.
The domestic opportunity cost of
A) producing a ton of chips in Alpha is 1/5 of a ton of ?sh.
B) producing a ton of chips in Beta is 6 tons of ?sh.
C) catching a ton of ?sh in Alpha is 5 tons of chips.
D) catching a ton of ?sh in Beta is 6 tons of chips.
The domestic opportunity cost of
A) producing a ton of chips in Alpha is 1/5 of a ton of ?sh.
B) producing a ton of chips in Beta is 6 tons of ?sh.
C) catching a ton of ?sh in Alpha is 5 tons of chips.
D) catching a ton of ?sh in Beta is 6 tons of chips.
Unlock Deck
Unlock for access to all 339 flashcards in this deck.
Unlock Deck
k this deck
41
In a two-nation model, the equilibrium world price will occur where
A) one nation's export supply curve intersects the other nation's import demand curve.
B) exports are exactly twice the level of imports.
C) both nations' export supply curves are horizontal.
D) both nations' import demand curves are vertical.
A) one nation's export supply curve intersects the other nation's import demand curve.
B) exports are exactly twice the level of imports.
C) both nations' export supply curves are horizontal.
D) both nations' import demand curves are vertical.
Unlock Deck
Unlock for access to all 339 flashcards in this deck.
Unlock Deck
k this deck
42
A nation's import demand curve for a specific product
A) is upsloping.
B) shows the amount of the product it will import at prices below its domestic price.
C) lies above its export supply curve for the product.
D) depends on domestic demand for the product, but not on domestic supply.
A) is upsloping.
B) shows the amount of the product it will import at prices below its domestic price.
C) lies above its export supply curve for the product.
D) depends on domestic demand for the product, but not on domestic supply.
Unlock Deck
Unlock for access to all 339 flashcards in this deck.
Unlock Deck
k this deck
43
Suppose the domestic price (no-international-trade price) of copper is $1.20 a pound in the United States while the world price is $1.00 a pound. Assuming no transportation costs, the United States
Will
A) have a domestic surplus of copper.
B) export copper.
C) import copper.
D) neither export nor import copper.
Will
A) have a domestic surplus of copper.
B) export copper.
C) import copper.
D) neither export nor import copper.
Unlock Deck
Unlock for access to all 339 flashcards in this deck.
Unlock Deck
k this deck
44
The law of increasing opportunity costs
A) applies to land-intensive commodities but not to labor-intensive or capital-intensive commodities.
B) results in straight-line production possibilities curves rather than curves that are bowed outward from the origin.
C) refutes the principle of comparative advantage.
D) may limit the extent to which a nation specializes in producing a particular product.
Unlock Deck
Unlock for access to all 339 flashcards in this deck.
Unlock Deck
k this deck
45
Refer to the given diagram, in which line AB is the U.S. production possibilities curve and AC is its trading possibilities curve. The international exchange ratio between beef and cheese (terms ofTrade)
A) is the absolute value of the slope of line AB.
B) is the absolute value of the slope of line AC.
C) could lie anywhere between the absolute value of the slopes of lines AB and AC.
D) cannot be determined on the basis of this information.
Unlock Deck
Unlock for access to all 339 flashcards in this deck.
Unlock Deck
k this deck
46
The impact of increasing, as opposed to constant, costs is to
A) intensify and prolong the comparative advantages that any nation may have initially.
B) expand the limits of the terms of trade.
C) cause the bases for further specialization to disappear as nations specialize according to comparative advantage.
D) cause nations to realize economies of scale in those products in which they specialize.
Unlock Deck
Unlock for access to all 339 flashcards in this deck.
Unlock Deck
k this deck
47
Refer to the diagram, which shows the domestic demand and supply curves for a specific standardized product in a particular nation. If the world price for this product is $0.50, this nation willExperience a domestic
A) shortage of 160 units, which it will meet with 160 units of imports.
B) shortage of 160 units, which will increase the domestic price to $1.60.
C) surplus of 160 units, which it will export.
D) surplus of 160 units, which will reduce the world price to $1.00.
Unlock Deck
Unlock for access to all 339 flashcards in this deck.
Unlock Deck
k this deck
48
In the real world, specialization is rarely complete because
A) nations normally experience increasing opportunity costs in producing more of the product in which they are specializing.
B) production possibilities curves are straight lines rather than curves bowed outward as viewed from the origin.
C) one nation's imports are necessarily another nation's exports.
D) international law prohibits monopolies.
Unlock Deck
Unlock for access to all 339 flashcards in this deck.
Unlock Deck
k this deck
49
Refer to the diagram, which pertains to two nations and a specific product. Point G is theA) domestic price for the nation represented by lines FA and FC.
B) world equilibrium price.
C) domestic price for the nation represented by lines GB and GD.
D) price above the world equilibrium price.
Unlock Deck
Unlock for access to all 339 flashcards in this deck.
Unlock Deck
k this deck
50
Refer to the diagram, which shows the domestic demand and supply curves for a specific standardized product in a particular nation. If the world price of this product is $1, this nation willA) export all of the product.
B) import all of the product.
C) import some of the product and produce some of the product domestically.
D) neither export nor import the product.
Unlock Deck
Unlock for access to all 339 flashcards in this deck.
Unlock Deck
k this deck
51
Refer to the diagram pertaining to two nations and a specific product. Lines FA and GB areA) domestic supply curves for two countries.
B) domestic demand curves for two countries.
C) import demand curves for two countries.
D) export supply curves for two countries.
Unlock Deck
Unlock for access to all 339 flashcards in this deck.
Unlock Deck
k this deck
52
Refer to the diagram, which pertains to two nations and a specific product. Lines FC and GD areA) domestic supply curves for two countries.
B) domestic demand curves for two countries.
C) import demand curves for two countries.
D) export supply curves for two countries.
Unlock Deck
Unlock for access to all 339 flashcards in this deck.
Unlock Deck
k this deck
53
A nation will neither export nor import a specific product when its
A) domestic price equals the world price.
B) export supply curve lies above its import demand curve.
C) export supply curve is upsloping.
D) import demand curve is downsloping.
A) domestic price equals the world price.
B) export supply curve lies above its import demand curve.
C) export supply curve is upsloping.
D) import demand curve is downsloping.
Unlock Deck
Unlock for access to all 339 flashcards in this deck.
Unlock Deck
k this deck
54
A nation's export supply curve for a specific product
A) is upsloping.
B) shows the amount of the product it will export at prices below its domestic price.
C) lies below its import demand curve for the product.
D) depends on domestic supply of the product, but not on domestic demand.
A) is upsloping.
B) shows the amount of the product it will export at prices below its domestic price.
C) lies below its import demand curve for the product.
D) depends on domestic supply of the product, but not on domestic demand.
Unlock Deck
Unlock for access to all 339 flashcards in this deck.
Unlock Deck
k this deck
55
Suppose the domestic price (no-international-trade price) of wheat is $3.50 a bushel in the United States while the world price is $4.00 a bushel. Assuming no transportation costs, the United States
Will
A) have a domestic shortage of wheat.
B) export wheat.
C) import wheat.
D) neither export nor import wheat.
Will
A) have a domestic shortage of wheat.
B) export wheat.
C) import wheat.
D) neither export nor import wheat.
Unlock Deck
Unlock for access to all 339 flashcards in this deck.
Unlock Deck
k this deck
56
Refer to the diagram, which shows the domestic demand and supply curves for a specific standardized product in a particular nation. If the world price for this product is $1.60, this nation willExperience a domestic
A) shortage of 160 units, which it will meet with 160 units of imports.
B) shortage of 160 units, which will increase the domestic price to $1.60.
C) surplus of 160 units, which it will export.
D) surplus of 160 units, which will reduce the world price to $1.00.
Unlock Deck
Unlock for access to all 339 flashcards in this deck.
Unlock Deck
k this deck
57
Refer to the diagram, which pertains to two nations and a specific product. The equilibrium world price occurs atA) F.
B) I.
C) G.
D) J.
Unlock Deck
Unlock for access to all 339 flashcards in this deck.
Unlock Deck
k this deck
58
Refer to the diagram, which pertains to two nations and a specific product. In equilibrium, the nation represented by lines FA and FC willA) export H to the country represented by lines GB and GD.
B) import H from the country represented by lines GB and GD.
C) pay price F for its imports.
D) receive price G for its exports.
Unlock Deck
Unlock for access to all 339 flashcards in this deck.
Unlock Deck
k this deck
59
Export supply curves are __________________; import demand curves are ___________________.
A) horizontal; vertical
B) vertical; horizontal
C) downsloping; upsloping
D) upsloping; downsloping
A) horizontal; vertical
B) vertical; horizontal
C) downsloping; upsloping
D) upsloping; downsloping
Unlock Deck
Unlock for access to all 339 flashcards in this deck.
Unlock Deck
k this deck
60
Refer to the given diagram, in which line AB is the U.S. production possibilities curve and AC is its trading possibilities curve. We can conclude that the United StatesA) has chosen to specialize in the production of cheese.
B) has chosen to specialize in the production of beef.
C) has decided to trade beef for cheese.
D) is relatively more efficient than its trading partners in producing both cheese and beef.
Unlock Deck
Unlock for access to all 339 flashcards in this deck.
Unlock Deck
k this deck
61
The accompanying tables show data for the hypothetical nations of Alpha and Beta. is domestic
Quantity supplied, and
is domestic quantity demanded. Alpha's export supply is represented by
A)
B)
C)
D)
Unlock Deck
Unlock for access to all 339 flashcards in this deck.
Unlock Deck
k this deck
62
Refer to the diagram, where andare the domestic supply and demand for a product and
is
The world price of that product. If the economy is opened to free trade, the price and quantity sold of
This product would be
A)
B)
C)
D)
Unlock Deck
Unlock for access to all 339 flashcards in this deck.
Unlock Deck
k this deck
63
An excise tax on an imported good that is not produced domestically is called a
A) protective tariff.
B) import quota.
C) revenue tariff.
D) voluntary export restriction.
A) protective tariff.
B) import quota.
C) revenue tariff.
D) voluntary export restriction.
Unlock Deck
Unlock for access to all 339 flashcards in this deck.
Unlock Deck
k this deck
64
The accompanying tables show data for the hypothetical nations of Alpha and Beta. is domestic quantity supplied, and is domestic quantity demanded. Assuming that Alpha and Beta are the only two nations in the world, the equilibrium world price must be lower than because, at ,
A) both nations will export steel.
B) both nations will import steel.
C) Alpha will export steel and Beta will import steel.
D) Beta will export steel and Alpha will import steel.
Unlock Deck
Unlock for access to all 339 flashcards in this deck.
Unlock Deck
k this deck
65
In the past, Canada has agreed to set an upper limit on the total amount of softwood lumber sold to the United States. This is an example of a(n)
A) import quota.
B) export subsidy.
C) voluntary export restriction.
D) protective tariff.
A) import quota.
B) export subsidy.
C) voluntary export restriction.
D) protective tariff.
Unlock Deck
Unlock for access to all 339 flashcards in this deck.
Unlock Deck
k this deck
66
Country A limits other nation's exports to Country A to 1,000 tons of coal annually. This is an example of a(n)
A) protective tariff.
B) export subsidy.
C) import quota.
D) voluntary export restriction.
A) protective tariff.
B) export subsidy.
C) import quota.
D) voluntary export restriction.
Unlock Deck
Unlock for access to all 339 flashcards in this deck.
Unlock Deck
k this deck
67
Excise taxes on imported goods that help shield domestic producers of the good are called
A) protective tariffs.
B) import quotas.
C) revenue tariffs.
D) voluntary export restrictions.
A) protective tariffs.
B) import quotas.
C) revenue tariffs.
D) voluntary export restrictions.
Unlock Deck
Unlock for access to all 339 flashcards in this deck.
Unlock Deck
k this deck
68
Which is an example of a nontariff barrier (NTB)?
A) an export subsidy
B) an excise tax on the physical volume of imported goods
C) box-by-box inspection requirements for imported fruit
D) an excise tax on the dollar value of imported goods
A) an export subsidy
B) an excise tax on the physical volume of imported goods
C) box-by-box inspection requirements for imported fruit
D) an excise tax on the dollar value of imported goods
Unlock Deck
Unlock for access to all 339 flashcards in this deck.
Unlock Deck
k this deck
69
Refer to the diagram, where andare the domestic supply and demand for a product and
is
The world price of that product. With free trade, that is, assuming no tariff, the outputs produced by
Domestic and foreign producers, respectively, would be
A) v and vz.
B) w and wy.
C) w and wz.
D) vx and xz.
Unlock Deck
Unlock for access to all 339 flashcards in this deck.
Unlock Deck
k this deck
70
The accompanying tables show data for the hypothetical nations of Alpha and Beta. is domestic quantity supplied, and is domestic quantity demanded. Assuming that Alpha and Beta are the only two nations in the world, the equilibrium world price must be lower than because, at ,
A) both nations want to import steel.
B) both nations want to export steel.
C) Beta wants to export more than Alpha.
D) Alpha wants to import more than Beta.
Unlock Deck
Unlock for access to all 339 flashcards in this deck.
Unlock Deck
k this deck
71
The accompanying tables show data for the hypothetical nations of Alpha and Beta. is domestic quantity supplied, and is domestic quantity demanded. Assuming that Alpha and Beta are the only two nations in the world, the equilibrium world price must be lower than because, at ,
A) Beta wants to import more than Alpha.
B) Alpha wants to export more than Beta.
C) both nations want to export steel.
D) both nations want to import steel.
Unlock Deck
Unlock for access to all 339 flashcards in this deck.
Unlock Deck
k this deck
72
The accompanying tables show data for the hypothetical nations of Alpha and Beta. is domestic
Quantity supplied, and
is domestic quantity demanded. The domestic equilibrium prices of steel
In Alpha and Beta are
A) $5 and $4, respectively.
B) $2 and $4, respectively.
C) $3 and $2, respectively.
D) $1 and $2, respectively.
Unlock Deck
Unlock for access to all 339 flashcards in this deck.
Unlock Deck
k this deck
73
A tariff can best be described as
A) an excise tax on an imported good.
B) a government payment to domestic producers to enable them to sell competitively in world markets.
C) an excise tax on an exported good.
D) a law that sets a limit on the amount of a good that can be imported.
A) an excise tax on an imported good.
B) a government payment to domestic producers to enable them to sell competitively in world markets.
C) an excise tax on an exported good.
D) a law that sets a limit on the amount of a good that can be imported.
Unlock Deck
Unlock for access to all 339 flashcards in this deck.
Unlock Deck
k this deck
74
Tariffs
A) may be imposed either to raise revenue (revenue tariffs) or to shield domestic producers from foreign competition (protective tariffs).
B) are also called import quotas.
C) are excise taxes on goods exported abroad.
D) are per-unit subsidies designed to promote exports.
A) may be imposed either to raise revenue (revenue tariffs) or to shield domestic producers from foreign competition (protective tariffs).
B) are also called import quotas.
C) are excise taxes on goods exported abroad.
D) are per-unit subsidies designed to promote exports.
Unlock Deck
Unlock for access to all 339 flashcards in this deck.
Unlock Deck
k this deck
75
Refer to the diagram, which pertains to two nations and a specific product. The equilibrium level of exports and imports occurs atA) H, where GB and FC intersect.
B) J, where the vertical distance between A and B equals the vertical distance between C and D.
C) world price level F.
D) world price level G.
Unlock Deck
Unlock for access to all 339 flashcards in this deck.
Unlock Deck
k this deck
76
The accompanying tables show data for the hypothetical nations of Alpha and Beta. is domestic
Quantity supplied, and
is domestic quantity demanded. At a world price of $5,
A) Alpha will want to import 50 units of steel.
B) Beta will want to import 60 units of steel.
C) Alpha will want to export 50 units of steel.
D) neither country will want to export steel.
Unlock Deck
Unlock for access to all 339 flashcards in this deck.
Unlock Deck
k this deck
77
The accompanying tables show data for the hypothetical nations of Alpha and Beta. is domestic
Quantity supplied, and
is domestic quantity demanded. At a world price of $2,
A) Alpha will want to import 20 units of steel.
B) Beta will want to export 20 units of steel.
C) Alpha will want to export 20 units of steel.
D) neither country will want to import steel.
Unlock Deck
Unlock for access to all 339 flashcards in this deck.
Unlock Deck
k this deck
78
Suppose the United States sets a limit on the number of tons of sugar that can be imported each year. This is an example of a(n)
A) protective tariff.
B) revenue tariff.
C) voluntary export restriction.
D) import quota.
A) protective tariff.
B) revenue tariff.
C) voluntary export restriction.
D) import quota.
Unlock Deck
Unlock for access to all 339 flashcards in this deck.
Unlock Deck
k this deck
79
A)
B)
C)
D)
Unlock Deck
Unlock for access to all 339 flashcards in this deck.
Unlock Deck
k this deck
80
The accompanying tables show data for the hypothetical nations of Alpha and Beta. is domestic quantity supplied, and is domestic quantity demanded. Assuming that Alpha and Beta are the only two nations in the world, the equilibrium world price must be lower than because, at ,
A) $5 and $4.
B) $4 and $3.
C) $3 and $2.
D) $2 and $1.
Unlock Deck
Unlock for access to all 339 flashcards in this deck.
Unlock Deck
k this deck
Unlock Deck
Unlock for access to all 339 flashcards in this deck.


