Deck 2: Life on Land
Full screen (f)
Question
Question
Question
Question
Question
Question
Question
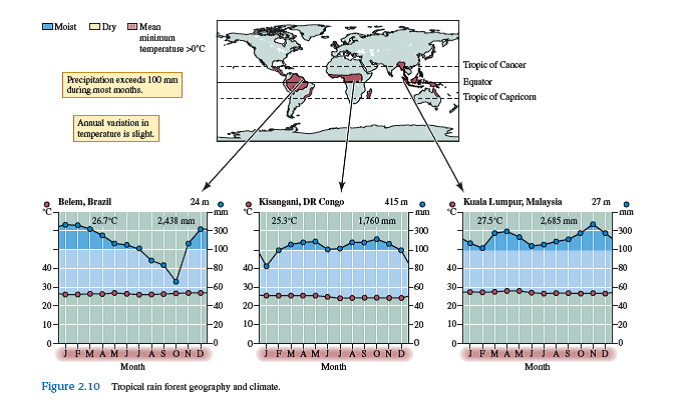
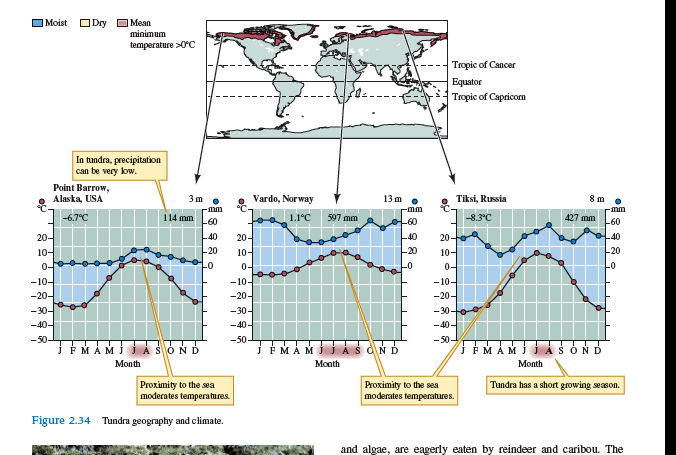
Biologists have observed much more similarity in species composition among boreal forests and among areas of tundra in Eurasia and North America than among tropical rain forests or among Mediterranean woodlands around the globe. Can you offer an explanation of this contrast based on the global distributions of these biomes shown in figures 2.10 , 2.22 , 2.31 , and 2.34


Question
Question
Question
Question
Question
Question
One of the most common and important steps in the processing of data is the production of summary statistics. First, what is a statistic A statistic is a number that is used by scientists to estimate a measurable characteristic of an entire population. Population characteristics of interest to an ecologist might include features such as average mass, growth rate, or, as in this chapter, air temperature. In order to determine the exact average value of such population characteristics, the ecologist would have to measure every individual in the population. Clearly, the opportunity to measure or test all the individuals in a population for any characteristic is extremely rare. For instance, an ecologist studying reproductive rate in a population of birds would be unlikely to locate and study all the nests in the population. As a consequence, ecologists generally estimate reproductive rates for birds, or other characteristics of any population, using samples drawn randomly from the population. An ecologist working with a population of rare plants, for example, might locate 11 seedlings and calculate the average height of these 11 individual plants. This average calculated from the sample of 11 seedlings would be the sample mean. The sample mean is a statistical estimate of the true population mean.
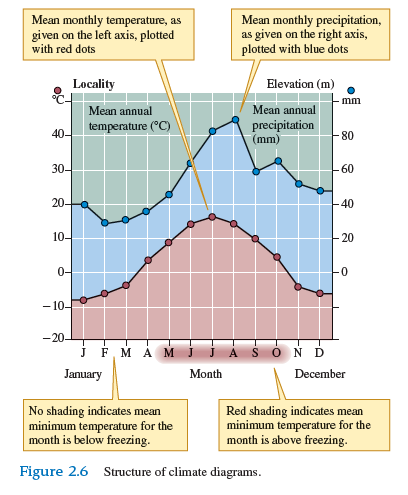
The sample mean is one of the most common and useful summary statistics. It is a statistic that we use extensively in this chapter as we discuss average temperature or average precipitation for biomes around the world (see fig 2.6 , p. 16). How is the sample mean calculated Consider the following sample of seedling height.

Again, 5.7 cm, the sample mean, is the ecologist's estimate of the true mean height of seedlings in the entire population at the time of the study
If you measured the heights of 100 seedlings randomly drawn from the hypothetical population, instead of the 11 measured in the example, would the sample mean be likely to be exactly 5.7 cm
The sample mean is one of the most common and useful summary statistics. It is a statistic that we use extensively in this chapter as we discuss average temperature or average precipitation for biomes around the world (see fig 2.6 , p. 16). How is the sample mean calculated Consider the following sample of seedling height.
Again, 5.7 cm, the sample mean, is the ecologist's estimate of the true mean height of seedlings in the entire population at the time of the study
If you measured the heights of 100 seedlings randomly drawn from the hypothetical population, instead of the 11 measured in the example, would the sample mean be likely to be exactly 5.7 cm
Question
Question
Question
One of the most common and important steps in the processing of data is the production of summary statistics. First, what is a statistic A statistic is a number that is used by scientists to estimate a measurable characteristic of an entire population. Population characteristics of interest to an ecologist might include features such as average mass, growth rate, or, as in this chapter, air temperature. In order to determine the exact average value of such population characteristics, the ecologist would have to measure every individual in the population. Clearly, the opportunity to measure or test all the individuals in a population for any characteristic is extremely rare. For instance, an ecologist studying reproductive rate in a population of birds would be unlikely to locate and study all the nests in the population. As a consequence, ecologists generally estimate reproductive rates for birds, or other characteristics of any population, using samples drawn randomly from the population. An ecologist working with a population of rare plants, for example, might locate 11 seedlings and calculate the average height of these 11 individual plants. This average calculated from the sample of 11 seedlings would be the sample mean. The sample mean is a statistical estimate of the true population mean.
The sample mean is one of the most common and useful summary statistics. It is a statistic that we use extensively in this chapter as we discuss average temperature or average precipitation for biomes around the world (see fig 2.6 , p. 16). How is the sample mean calculated Consider the following sample of seedling height.
Again, 5.7 cm, the sample mean, is the ecologist's estimate of the true mean height of seedlings in the entire population at the time of the study

Why does the annual rainy season in regions near 23 o N latitude begin in June
The sample mean is one of the most common and useful summary statistics. It is a statistic that we use extensively in this chapter as we discuss average temperature or average precipitation for biomes around the world (see fig 2.6 , p. 16). How is the sample mean calculated Consider the following sample of seedling height.
Again, 5.7 cm, the sample mean, is the ecologist's estimate of the true mean height of seedlings in the entire population at the time of the study
Why does the annual rainy season in regions near 23 o N latitude begin in June
Question

Unlock Deck
Sign up to unlock the cards in this deck!
Unlock Deck
Unlock Deck
1/17
Play
Full screen (f)
Deck 2: Life on Land
1
Describe global patterns of atmospheric heating and circulation. What mechanisms produce high precipitation in the tropics What mechanisms produce high precipitation at temperate latitudes What mechanisms produce low precipitation in the tropics
The solar energy is unevenly distributed across the earth's surface. The equatorial and the tropical regions receive much more solar heat than the mid latitudes and the polar regions. The heating of the surface of earth and the atmosphere drives circulation and in turn influences the precipitation patterns. The air circulation and the patterns of precipitation are described below.
The air at the equator is heated by the sun. Heating causes the air to expand and rise. This air cools as it rises. Because, cold air holds less water vapor than warm air, the water vapor carried by this rising air mass condenses and forms the clouds. The clouds produced in this way cause heavy precipitation associated with the tropics.
Once the equatorial air mass stops rising, it spreads towards the north and the south. This is now dry, as it has lost its moisture as the tropical rains. As it flows towards the north and the south, it cools and becomes denser. Higher density causes the air to sink back to the ground at about 30°latitude. Being dry, this air absorbs moisture from the lands over which it flows and thus, is responsible for the creation of the deserts.
Air moving from 30°latitude towards the equator completes one atmospheric circulation cell at the low latitudes. In all, there are three atmospheric circulation cells on each side of the equator. Air moves from 30° latitude towards the poles forms a part of the atmospheric circulation cell at the midlatitudes. A high precipitation at the temperate latitudes is produced when the warm water vapor containing subtropical air meets cold polar air, which leads to the condensation of the moisture in the air mass in the temperate regions.
When patterns of air circulation are observed from the earth's surface, it is found that:-
• At tropical latitudes, winds blow from southeast in the southern hemisphere
• Winds blow from the northeast in the northern hemisphere.
These winds are known as southeast and northeast trades. When studying winds in the temperate belt (between 30°-60° latitude), it is observed that winds blow mainly from the west. These winds are known as westerlies of temperate latitudes. When the winds were studied from the high altitudes, the predominant wind direction was found to be from the east. These winds are known as the polar easterlies.
The precipitation is dependent on the temperature of air. Air at a higher temperature holds more water vapor than cold air. The tropics are warmer and hence the warm air holds a great amount of moisture. This moisture would not be released as precipitation unless it is cooled by the cold air. The cold air is forced up by the sides of the mountains. Prevailing winds and mountain barriers can produce low precipitation in the tropics.
2
Use what you know about atmospheric circulation and seasonal changes in the sun's orientation to earth to explain the highly seasonal rainfall in the tropical dry forest and tropical savanna biomes. (Hint: Why does the rainy season in these biomes come during the warmer months )
Savanna biomes have two distinct seasons; winter and summer. These seasons are however, accompanied by the extreme rise and fall in temperature associated with these seasonal distinctions. The rainy season in the biome occurs during the summer season while the winter remains dry.
The topical dry forests are generally warm all round the year. There are alternating dry and wet seasons. Dry seasons last longer, while the rainy season is shorter than the dry season.
The seasonality in the rainfall of these two biomes is caused due to the shifts in the latitude at which the sun is directly overhead. As the earth revolves around the sun, this shift in the latitude occurs approximately betweeN₂3.5°N and 23.5°S. This shift in the latitudes is responsible for the generation of tropical storms.
In the tropical Savanna and the tropical dry forest biomes, the wet season occurs during the warm months of the year, which is the time during which the sun is almost overhead in these regions.
3
We focused much of our discussion of biomes on their latitudinal distribution. The reasonably predictable relationship among latitude and temperature and precipitation provides a link between latitude and biomes. What other geographic variable might affect the distribution of temperature and precipitation and, therefore, of biomes
The latitude of a place basically determines the amount of solar energy received by that place during a year. It describes the relation of the location with one of the global wind belts. Thus, latitude determines if a location is beneath a high or a low pressure cell. Hence, latitude is the most important determinant of distribution of temperature and precipitation.
However, altitude is another geographical factor that affects the distribution of temperature and precipitation. Altitude refers to the height of a location above the mean sea level. Altitude dramatically affects the distribution of temperature and precipitation. For each 1000 feet rise in altitude, there is a 4°F drop in the air temperature. Altitude affects air temperature because the air pressure drops as the altitude increases.
Altitude also significantly affects the precipitation. As humid air rises higher to pass over areas of high altitude, the low temperature at high altitudes causes it to cool and condense and eventually fall as rain. Hence, generally higher altitudes receive more rain (but it also depends on latitude).
Thus, altitude significantly affects the distribution of temperature and precipitation and hence biomes, which are large geographic areas with similar kind of communities and climates.
4
You probably suggested altitude in response to question 5 because of its important influence on climate. Some of the earliest studies of the geographic distribution of vegetation suggested a direct correspondence between latitudinal and altitudinal variation in climate, and our discussion in this chapter stressed the similarities in climatic changes with altitude and latitude. Now, what are some major climatic differences between high altitude at midlatitudes and high altitude at high latitudes
Question - 5. We focused much of our discussion of biomes on their latitudinal distribution. The reasonably predictable relationship among latitude and temperature and precipitation provides a link between latitude and biomes. What other geographic variable might affect the distribution of temperature and precipitation and, therefore, of biomes
Question - 5. We focused much of our discussion of biomes on their latitudinal distribution. The reasonably predictable relationship among latitude and temperature and precipitation provides a link between latitude and biomes. What other geographic variable might affect the distribution of temperature and precipitation and, therefore, of biomes
Unlock Deck
Unlock for access to all 17 flashcards in this deck.
Unlock Deck
k this deck
5
How is the physical environment on mountains at midlatitudes similar to that in tropical alpine zones How do these environments differ
Unlock Deck
Unlock for access to all 17 flashcards in this deck.
Unlock Deck
k this deck
6
English and other European languages have terms for four seasons: spring, summer, autumn, and winter. This vocabulary summarizes much of the annual climatic variation at midlatitudes in temperate regions. Are these four seasons useful for summarizing annual climatic changes across the rest of the globe Look back at the climate diagrams presented in this chapter. How many seasons would you propose for each of these environments What would you call these seasons
Unlock Deck
Unlock for access to all 17 flashcards in this deck.
Unlock Deck
k this deck
7
Biologists have observed much more similarity in species composition among boreal forests and among areas of tundra in Eurasia and North America than among tropical rain forests or among Mediterranean woodlands around the globe. Can you offer an explanation of this contrast based on the global distributions of these biomes shown in figures 2.10 , 2.22 , 2.31 , and 2.34
Unlock Deck
Unlock for access to all 17 flashcards in this deck.
Unlock Deck
k this deck
8
To date, which biomes have been the most heavily affected by humans Which seem to be the most lightly affected How would you assess human impact How might these patterns change during this century (You may need to consult the discussion of human population growth in the Applications section of chapter 11.)
Unlock Deck
Unlock for access to all 17 flashcards in this deck.
Unlock Deck
k this deck
9
How would seasonality in temperature and precipitation be affected if earth's rotation on its axis were perpendicular to its plane of orbit about the sun
Unlock Deck
Unlock for access to all 17 flashcards in this deck.
Unlock Deck
k this deck
10
Why does the annual rainy season in regions near 23 o N latitude begin in June
Unlock Deck
Unlock for access to all 17 flashcards in this deck.
Unlock Deck
k this deck
11
The organic horizon is generally absent from agricultural soils because tilling, e.g., plowing, buries organic matter. Why is an organic horizon generally absent from desert soils
Unlock Deck
Unlock for access to all 17 flashcards in this deck.
Unlock Deck
k this deck
12
Why do those regions, whether tropical, desert, or temperate, that include high mountains tend to be the most biologically diverse
Unlock Deck
Unlock for access to all 17 flashcards in this deck.
Unlock Deck
k this deck
13
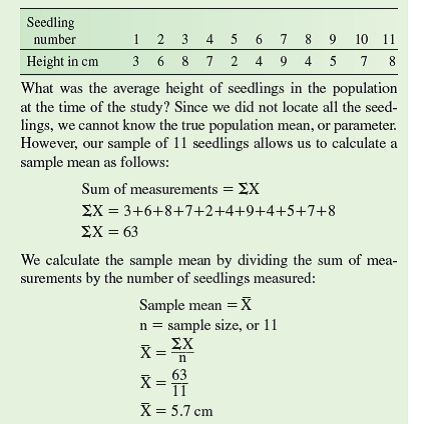
One of the most common and important steps in the processing of data is the production of summary statistics. First, what is a statistic A statistic is a number that is used by scientists to estimate a measurable characteristic of an entire population. Population characteristics of interest to an ecologist might include features such as average mass, growth rate, or, as in this chapter, air temperature. In order to determine the exact average value of such population characteristics, the ecologist would have to measure every individual in the population. Clearly, the opportunity to measure or test all the individuals in a population for any characteristic is extremely rare. For instance, an ecologist studying reproductive rate in a population of birds would be unlikely to locate and study all the nests in the population. As a consequence, ecologists generally estimate reproductive rates for birds, or other characteristics of any population, using samples drawn randomly from the population. An ecologist working with a population of rare plants, for example, might locate 11 seedlings and calculate the average height of these 11 individual plants. This average calculated from the sample of 11 seedlings would be the sample mean. The sample mean is a statistical estimate of the true population mean.
The sample mean is one of the most common and useful summary statistics. It is a statistic that we use extensively in this chapter as we discuss average temperature or average precipitation for biomes around the world (see fig 2.6 , p. 16). How is the sample mean calculated Consider the following sample of seedling height.
Again, 5.7 cm, the sample mean, is the ecologist's estimate of the true mean height of seedlings in the entire population at the time of the study
If you measured the heights of 100 seedlings randomly drawn from the hypothetical population, instead of the 11 measured in the example, would the sample mean be likely to be exactly 5.7 cm
Unlock Deck
Unlock for access to all 17 flashcards in this deck.
Unlock Deck
k this deck
14
Why would the soils in tropical rain forests generally be depleted of their nutrients more rapidly compared to the nutrients in temperate forest soils
Unlock Deck
Unlock for access to all 17 flashcards in this deck.
Unlock Deck
k this deck
15
Daniel Janzen (1981a, 1981b) proposed that the seeds of the guanacaste tree were once dispersed by several species of large mammals that became extinct following the end of the Pleistocene about 10,000 years ago. There may have been other plant species with a similar relationship with large herbivorous mammals. How do you think the distributions of these plant species may have changed from the time of the extinctions of Pleistocene mammals until the introduction of other large herbivores such as horses How might the introduction of horses about 500 years ago have affected the distribution of these species How could you test your ideas
Unlock Deck
Unlock for access to all 17 flashcards in this deck.
Unlock Deck
k this deck
16
One of the most common and important steps in the processing of data is the production of summary statistics. First, what is a statistic A statistic is a number that is used by scientists to estimate a measurable characteristic of an entire population. Population characteristics of interest to an ecologist might include features such as average mass, growth rate, or, as in this chapter, air temperature. In order to determine the exact average value of such population characteristics, the ecologist would have to measure every individual in the population. Clearly, the opportunity to measure or test all the individuals in a population for any characteristic is extremely rare. For instance, an ecologist studying reproductive rate in a population of birds would be unlikely to locate and study all the nests in the population. As a consequence, ecologists generally estimate reproductive rates for birds, or other characteristics of any population, using samples drawn randomly from the population. An ecologist working with a population of rare plants, for example, might locate 11 seedlings and calculate the average height of these 11 individual plants. This average calculated from the sample of 11 seedlings would be the sample mean. The sample mean is a statistical estimate of the true population mean.
The sample mean is one of the most common and useful summary statistics. It is a statistic that we use extensively in this chapter as we discuss average temperature or average precipitation for biomes around the world (see fig 2.6 , p. 16). How is the sample mean calculated Consider the following sample of seedling height.
Again, 5.7 cm, the sample mean, is the ecologist's estimate of the true mean height of seedlings in the entire population at the time of the study
Why does the annual rainy season in regions near 23 o N latitude begin in June
Unlock Deck
Unlock for access to all 17 flashcards in this deck.
Unlock Deck
k this deck
17
Draw a typical soil profile, indicating the principal layers, or horizons. Describe the characteristics of each layer.
Unlock Deck
Unlock for access to all 17 flashcards in this deck.
Unlock Deck
k this deck
Unlock Deck
Unlock for access to all 17 flashcards in this deck.


