Deck 10: Population Dynamics
Full screen (f)
Question
Question
Figure 10.11 and the upper portion of figure 21.13 show the relationship between meadow size and population size in two butterfly species. How are the patterns shown by the two graphs similar How do they differ (note 1 ha = 10,000 m 2 )
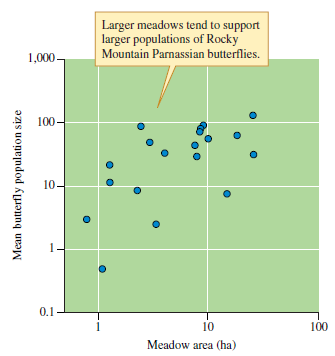
Figure 10.11 The relationship between meadow area and the size of Rocky Mountain Parnassian butterfly, Parnassius smintheus, populations. With forest encroachment into alpine meadows in the Rocky Mountains, populations of P. smintheus will likely decline (data from Roland, Keyghobadi, and Fownes 2000).
Figure 10.11 The relationship between meadow area and the size of Rocky Mountain Parnassian butterfly, Parnassius smintheus, populations. With forest encroachment into alpine meadows in the Rocky Mountains, populations of P. smintheus will likely decline (data from Roland, Keyghobadi, and Fownes 2000).
Question
Question
Question
Question
Question
Question
Question
Question
Question
Question
Question
Question
The last major natural reproduction by Rio Grande cottonwoods, which produced the large number of 40- and 50-year-old trees documented by Howe and Knopf (1991), occurred before the last major dam was built on the river. Is there any evidence for reproductive failure before that dam was built (see fig. 10.20)

Figure 10.20 Age distribution of a population of Rio Grande cottonwoods, Populus deltoides subsp. wislizenii, near Belen, New Mexico (data from Howe and Knopf 1991).
Figure 10.20 Age distribution of a population of Rio Grande cottonwoods, Populus deltoides subsp. wislizenii, near Belen, New Mexico (data from Howe and Knopf 1991).
Question
Question
Of the three populations pictured in figures 10.19, 10.20, and 10.21, which is most likely to have a stable age distribution
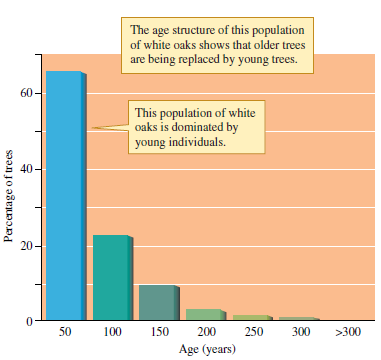
Figure 10.19 The age distribution of a white oak, Quercus alba, population in Illinois (data from Miller 1923).
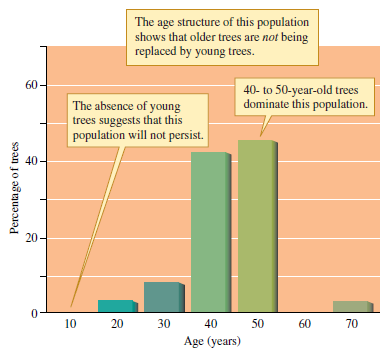
Figure 10.20 Age distribution of a population of Rio Grande cottonwoods, Populus deltoides subsp. wislizenii, near Belen, New Mexico (data from Howe and Knopf 1991).

Figure 10.21 Age distribution of a population of large cactus finches, Geospiza conirostris, on the island of Genovesa in the Galápagos Islands during 1983 ( a ) and 1987 ( b ) (data from Grant and Grant 1989).
Figure 10.19 The age distribution of a white oak, Quercus alba, population in Illinois (data from Miller 1923).
Figure 10.20 Age distribution of a population of Rio Grande cottonwoods, Populus deltoides subsp. wislizenii, near Belen, New Mexico (data from Howe and Knopf 1991).
Figure 10.21 Age distribution of a population of large cactus finches, Geospiza conirostris, on the island of Genovesa in the Galápagos Islands during 1983 ( a ) and 1987 ( b ) (data from Grant and Grant 1989).
Question
Question
Question
Question
Question
Question
Question
Question

Unlock Deck
Sign up to unlock the cards in this deck!
Unlock Deck
Unlock Deck
1/24
Play
Full screen (f)
Deck 10: Population Dynamics
1
Ecologists who have used clear plastic sheets coated with adhesive to trap the adults of aquatic insects flying over rivers have found that the side of the sheets facing downstream generally traps more of the flying adults than the upstream-facing side. Explain.
Population density of organisms is affected by dispersal. Dispersal in aquatic environments which is mainly controlled by the water currents that causes the flow of water downstream. Though aquatic organisms resist drifting down stream with the current by numerous mechanisms, drifting does occur to some extent and more so during floods.
This causes a decline in population of the organisms upstream and an increase in the organisms downstream.
The population upstream does not reduce to zero because organisms show active movement from downstream to upstream. Thus as per the colonization cycle proposed by scientist Karl Muller, the population of the organisms in aquatic environments is dynamic and controlled by the dispersal in upstream and down stream direction along with other factors such as reproduction.
In case of aquatic insects, some larvae may get drifted downstream. The adult flies formed in downstream region may move upstream. The plastic sheets with adhesive will trap the flying adult insects coming from the downstream side.
Hence the downstream side of the plastic sheet will show more flies trapped than the upstream side.
2
Figure 10.11 and the upper portion of figure 21.13 show the relationship between meadow size and population size in two butterfly species. How are the patterns shown by the two graphs similar How do they differ (note 1 ha = 10,000 m 2 )
Figure 10.11 The relationship between meadow area and the size of Rocky Mountain Parnassian butterfly, Parnassius smintheus, populations. With forest encroachment into alpine meadows in the Rocky Mountains, populations of P. smintheus will likely decline (data from Roland, Keyghobadi, and Fownes 2000).
Figure 10.11 The relationship between meadow area and the size of Rocky Mountain Parnassian butterfly, Parnassius smintheus, populations. With forest encroachment into alpine meadows in the Rocky Mountains, populations of P. smintheus will likely decline (data from Roland, Keyghobadi, and Fownes 2000).
The population of a species is usually divided into the number of separated subpopulations. The species may show dispersal between these subpopulations that connect the species into a metapopulation. The dispersal of species is affected by habitat size and population size.
The interrelationship between the habitat size and the population size has been studied between two butterfly species. The graphical representation of the study conducted by ecologists on the two butterfly species is depicted below.
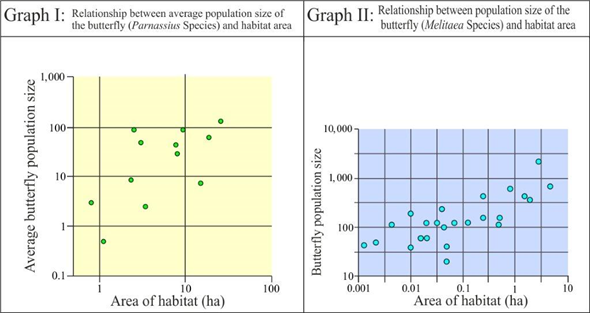 Graph I shows the relationship between average population size of the butterfly, Parnassius species, and the habitat area in hectares. Graph II shows the relationship between the population size of the butterfly Melitaea species and the habitat area in hectares.
Similarity in patterns of two graphs:
• Both of the graphs compare population sizes of butterfly with the habitat size.
• Both graphs show the similar pattern. As the habitat size increases, the population size of butterflies increases. One of the factors responsible for this is migrations from small populations to large populations in butterflies.
Differences in patterns of two graphs:
• Even though the two graphs depict the relationship between the same parameters of the population size and the habitat area, they are of two different species of butterflies. Graph I is based on Parnassius species and graph II on Melitaea species.
• The range of habitat size in two graphs is different. In graph I, the habitat size varies from 1 hectare to 100 hectares. In graph II, the habitat size varies from 0.001 hectares to 10 hectares. Hence, habitats of Parnassian species studied are larger than Melitaea species.
• The range of population sizes in two graphs is different. In graph I, the average population size of Parnassius species is within the range of 0.1 to 1000 individuals. In graph II, the population size of Melitaea species is within the range of 10 to 10,000 individuals. The population size of Melitaea species is greater than the Parnassian species per unit habitat area.
This indicates the difference in population size and abundance of species of butterflies.
The interrelationship between the habitat size and the population size has been studied between two butterfly species. The graphical representation of the study conducted by ecologists on the two butterfly species is depicted below.
Graph I shows the relationship between average population size of the butterfly, Parnassius species, and the habitat area in hectares. Graph II shows the relationship between the population size of the butterfly Melitaea species and the habitat area in hectares.Similarity in patterns of two graphs:
• Both of the graphs compare population sizes of butterfly with the habitat size.
• Both graphs show the similar pattern. As the habitat size increases, the population size of butterflies increases. One of the factors responsible for this is migrations from small populations to large populations in butterflies.
Differences in patterns of two graphs:
• Even though the two graphs depict the relationship between the same parameters of the population size and the habitat area, they are of two different species of butterflies. Graph I is based on Parnassius species and graph II on Melitaea species.
• The range of habitat size in two graphs is different. In graph I, the habitat size varies from 1 hectare to 100 hectares. In graph II, the habitat size varies from 0.001 hectares to 10 hectares. Hence, habitats of Parnassian species studied are larger than Melitaea species.
• The range of population sizes in two graphs is different. In graph I, the average population size of Parnassius species is within the range of 0.1 to 1000 individuals. In graph II, the population size of Melitaea species is within the range of 10 to 10,000 individuals. The population size of Melitaea species is greater than the Parnassian species per unit habitat area.
This indicates the difference in population size and abundance of species of butterflies.
3
The Rocky Mountain Parnassian butterfly tends to disperse from small to large meadows. Why is this direction of movement more advantageous than the reverse (Hint: See Glanville fritillary studies, chapter 4, p. 94.)
The Rocky Mountain Parnassian butterfly disperses from small habitats to large habitats.
This direction of dispersal of the butterfly species is more advantageous than in the reverse direction due to the following reasons:
1. Small habitats usually harbor small populations. Small populations show inbreeding or breeding between close relatives. This reduces the genetic variability in population, causing the population to become more homogenous.
2. Small, inbreeding butterfly populations are made up of members that show reduced reproductive capabilities, reduced life spans, and high mortality of offspring.
3. Members of small populations become vulnerable to predation. The forces of natural selection may act against a homogenous population, leading to extinction.
Thus, small populations are more vulnerable to extinction. By migrating in a large population, the genetic variability is increased. Interbreeding is favored, which may lead to offspring with improved fitness.
4
Contrast human influences on metapopulations of the Rocky Mountain Parnassian butterfly versus those of the lesser kestrels of the Ebro River valley.
Unlock Deck
Unlock for access to all 24 flashcards in this deck.
Unlock Deck
k this deck
5
When using a significance level of 0.05, how often will we reject hypotheses that are actually correct For instance, how often will we reject the hypothesis that the individuals in a study population are randomly distributed when, in fact, they really are randomly distributed
Unlock Deck
Unlock for access to all 24 flashcards in this deck.
Unlock Deck
k this deck
6
How would substantial emigration and immigration affect estimates of survivorship within a population, where estimates are based on age distributions
Unlock Deck
Unlock for access to all 24 flashcards in this deck.
Unlock Deck
k this deck
7
Outline Muller's (1954, 1974) colonization cycle. If you were studying the colonization cycle of the freshwater snail N. latissima, how would you follow colonization waves upstream How would you verify that these colonization waves gain individuals from local populations and contribute individuals to those same local populations
Unlock Deck
Unlock for access to all 24 flashcards in this deck.
Unlock Deck
k this deck
8
Female cottonwood trees ( Populus species) produce millions of seeds each year. Does this information give you a sound basis for predicting their survivorship pattern
Unlock Deck
Unlock for access to all 24 flashcards in this deck.
Unlock Deck
k this deck
9
Compare cohort and static life tables. What are the main assumptions of each In what situations or for what organisms would it be practical to use either
Unlock Deck
Unlock for access to all 24 flashcards in this deck.
Unlock Deck
k this deck
10
How would human mortality patterns have to change for our species to shift from type I to type II survivorship
Unlock Deck
Unlock for access to all 24 flashcards in this deck.
Unlock Deck
k this deck
11
Of the three survivorship curves, type III has been the least documented by empirical data. Why is that What makes this pattern of survivorship difficult to study
Unlock Deck
Unlock for access to all 24 flashcards in this deck.
Unlock Deck
k this deck
12
Can a healthy population that is not in danger of extinction have an age structure that shows years of reproductive failure
Unlock Deck
Unlock for access to all 24 flashcards in this deck.
Unlock Deck
k this deck
13
Population ecologists have assumed that populations of species with very high reproductive rates, those with offspring sometimes numbering in the millions per female, must have a type III survivorship curve even though very few survivorship data exist for such species. Why is this a reasonable assumption In general, what is the expected relationship between reproductive rate and patterns of survival
Unlock Deck
Unlock for access to all 24 flashcards in this deck.
Unlock Deck
k this deck
14
The last major natural reproduction by Rio Grande cottonwoods, which produced the large number of 40- and 50-year-old trees documented by Howe and Knopf (1991), occurred before the last major dam was built on the river. Is there any evidence for reproductive failure before that dam was built (see fig. 10.20)
Figure 10.20 Age distribution of a population of Rio Grande cottonwoods, Populus deltoides subsp. wislizenii, near Belen, New Mexico (data from Howe and Knopf 1991).
Figure 10.20 Age distribution of a population of Rio Grande cottonwoods, Populus deltoides subsp. wislizenii, near Belen, New Mexico (data from Howe and Knopf 1991).
Unlock Deck
Unlock for access to all 24 flashcards in this deck.
Unlock Deck
k this deck
15
Draw hypothetical age structures for growing, declining, and stable populations. Explain how the age structure of a population with highly episodic reproduction might be misinterpreted as indicating population decline. How might population ecologists avoid such misinterpretations
Unlock Deck
Unlock for access to all 24 flashcards in this deck.
Unlock Deck
k this deck
16
Of the three populations pictured in figures 10.19, 10.20, and 10.21, which is most likely to have a stable age distribution
Figure 10.19 The age distribution of a white oak, Quercus alba, population in Illinois (data from Miller 1923).
Figure 10.20 Age distribution of a population of Rio Grande cottonwoods, Populus deltoides subsp. wislizenii, near Belen, New Mexico (data from Howe and Knopf 1991).
Figure 10.21 Age distribution of a population of large cactus finches, Geospiza conirostris, on the island of Genovesa in the Galápagos Islands during 1983 ( a ) and 1987 ( b ) (data from Grant and Grant 1989).
Unlock Deck
Unlock for access to all 24 flashcards in this deck.
Unlock Deck
k this deck
17
Concept 10.5 says that we can use the information in life tables and fecundity schedules to estimate some characteristics of populations ( R 0 , T, r ). Why does Concept 10.5 use the word "estimate" rather than "calculate" In putting together your answer, think about the population of P. drummondii studied by Leverich and Levin (1979). We calculated R 0 for this population by summing the l x m x column. When we did, the number we got was R 0 = 2.4177. Assuming that Leverich and Levin accurately counted seeds and surviving plants, is 2.4177 an estimate of the average reproductive rate of the 996 individual P. drummondii in their study Right, 2.4177 is not an estimate; it's the actual average number of seeds produced by these 996 individuals. So, what's this estimate business about If Leverich and Levin had studied a second (or third, fourth, etc.) group of 996 individuals in their P. drummondii population, do you think it's likely that they would have gotten an R 0 exactly equal to 2.4177
Unlock Deck
Unlock for access to all 24 flashcards in this deck.
Unlock Deck
k this deck
18
Suppose that you are managing a population of an endangered species that has been reduced in numbers throughout its historic range and that your goal is to increase the size of the population. What values of R 0 would meet your management goals
Unlock Deck
Unlock for access to all 24 flashcards in this deck.
Unlock Deck
k this deck
19
What values of R 0 indicate that a population is growing, stable, or declining What values of r indicate a growing, stable, or declining population
Unlock Deck
Unlock for access to all 24 flashcards in this deck.
Unlock Deck
k this deck
20
Both R 0 and r indicate that the mud turtle population in Ellenton Bay is in decline. Is there any way that this population could be maintained for many generations even with such negative indicators
Unlock Deck
Unlock for access to all 24 flashcards in this deck.
Unlock Deck
k this deck
21
From a life table and a fecundity schedule, you can estimate the geometric rate of increase, , the average reproductive rate, R 0 , the generation time, T , and the per capita rate of increase, r. That is a lot of information about a population. What minimum information do you need to construct a life table and fecundity schedule
Unlock Deck
Unlock for access to all 24 flashcards in this deck.
Unlock Deck
k this deck
22
S. Holling (1959) observed predator numerical responses to changes in prey density. He attributed the numerical responses to changes in the reproductive rates of the predators. Discuss a hypothetical example of reproductive-rate numerical response by a population of predators in terms of changes in fecundity schedules and life tables. Include the terms R 0 , T, and r in your discussion.
Unlock Deck
Unlock for access to all 24 flashcards in this deck.
Unlock Deck
k this deck
23
In our discussions of the research of Baird, Soares, and their colleagues (Baird, Barber, Calow 1990, Soares, Baird, Calow 1992), we focused on the effects of a residue of an organic pesticide, dichloroaniline (DCA), on the per capita rate of increase, r , of D. magna. These researchers also found that the r of D. magna responds significantly to a variety of inorganic pollutants. What do these results indicate about the usefulness of r as an indicator of the ecological impact of potential pollutants
Unlock Deck
Unlock for access to all 24 flashcards in this deck.
Unlock Deck
k this deck
24
Why might a species such as the Eurasian collared dove be less threatened by rapid climate change than hemlock or maple trees
Unlock Deck
Unlock for access to all 24 flashcards in this deck.
Unlock Deck
k this deck
Unlock Deck
Unlock for access to all 24 flashcards in this deck.


