Deck 9: Forecasting and Demand Planning
Full screen (f)
Question
Question
Question
Question
Question
Question
Question
Question
Question
Question
Question
Question
Question
The following table shows the sales data of server computers of Ziffcore Inc. for the past 5 years. The management plotted the data on a chart. The chart suggested that the sales appear to be increasing in a fairly predictable linear fashion and that the sales are related to time by a linear function Y t =240+340t. Using simple linear regression, calculate the forecast for sales in year 6. 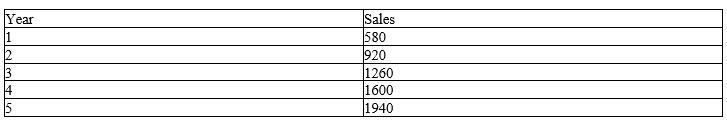
A) The forecast for sales in year 6 is more than 1800 but less than or equal to 2000.
B) The forecast for sales in year 6 is more than 2000 but less than or equal to 2200.
C) The forecast for sales in year 6 is more than 2200 but less than or equal to 2400.
D) The forecast for sales in year 6 is more than 2400 but less than or equal to 2600.
Question
Question
Question
The following table shows the sales data of a particular model of a DVD player. If the forecast sales for May is 36.25, calculate the sales forecast for July using the simple exponential smoothing (SES) model with a smoothing constant of 0.40. 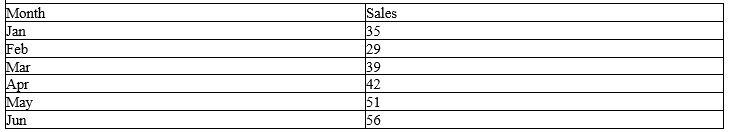
A) The sales forecast for July is more than 30 but less than or equal to 35.
B) The sales forecast for July is more than 35 but less than or equal to 40.
C) The sales forecast for July is more than 40 but less than or equal to 50.
D) The sales forecast for July is more than 50 but less than or equal to 55.
Question
Question
Question
Question
The mean absolute percentage error (MAPE) for the forecasts shown in the following table is: 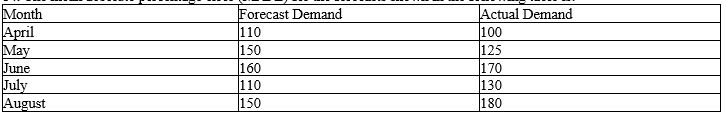
A) less than or equal to 5 percent.
B) more than 5 percent but less than or equal to 10 percent.
C) more than 10 percent but less than or equal to 15 percent.
D) more than 15 percent.
A) less than or equal to 5 percent.
B) more than 5 percent but less than or equal to 10 percent.
C) more than 10 percent but less than or equal to 15 percent.
D) more than 15 percent.
Question
Question
Question
Question
The following table shows the data for the sales of tennis rackets at a store for 4 consecutive months. Find the forecast error in month 4 using a 3-month moving average. 
A) The forecast error in month 4 is less than or equal to 5.
B) The forecast error in month 4 is more than 5 but less than or equal to 10.
C) The forecast error in month 4 is more than 10 but less than or equal to 15.
D) The forecast error in month 4 is more than 15.
A) The forecast error in month 4 is less than or equal to 5.
B) The forecast error in month 4 is more than 5 but less than or equal to 10.
C) The forecast error in month 4 is more than 10 but less than or equal to 15.
D) The forecast error in month 4 is more than 15.
Question
Question
Question
The following table shows the data for the sales of a new music album at a store for 4 consecutive months. Find the forecast for the next month using a 3-month moving average. 
A) The forecast for the next month is more than 90 but less than or equal to 100.
B) The forecast for the next month is more than 100 but less than or equal to 110.
C) The forecast for the next month is more than 110 but less than or equal to 120.
D) The forecast for the next month is more than 120 but less than or equal to 130.
Question
Question
Question
The mean absolute deviation (MAD) for the forecasts shown in the following table is: 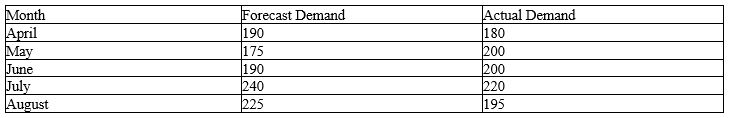
A) more than 10 but less than or equal to 20.
B) more than 20 but less than or equal to 30.
C) more than 30 but less than or equal to 40.
D) more than 40 but less than or equal to 50.
A) more than 10 but less than or equal to 20.
B) more than 20 but less than or equal to 30.
C) more than 30 but less than or equal to 40.
D) more than 40 but less than or equal to 50.
Question
Question
The mean square error (MSE) for the forecasts shown in the following table is: 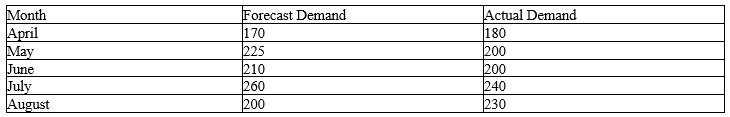
A) more than 250 but less than or equal to 300.
B) more than 300 but less than or equal to 350.
C) more than 350 but less than or equal to 400.
D) more than 400 but less than or equal to 450.
A) more than 250 but less than or equal to 300.
B) more than 300 but less than or equal to 350.
C) more than 350 but less than or equal to 400.
D) more than 400 but less than or equal to 450.
Question
Question
Question

Unlock Deck
Sign up to unlock the cards in this deck!
Unlock Deck
Unlock Deck
1/35
Play
Full screen (f)
Deck 9: Forecasting and Demand Planning
1
In the context of data patterns and variations in a time series, _____ are characterized by repeatable periods of ups and downs over short periods of time.
A) random variations
B) seasonal patterns
C) cyclical patterns
D) irregular variations
A) random variations
B) seasonal patterns
C) cyclical patterns
D) irregular variations
seasonal patterns
2
A__________is the underlying pattern of growth or decline in a time series.
A) trend
B) planning horizon
C) forecast error
D) bias
A) trend
B) planning horizon
C) forecast error
D) bias
trend
3
Forecasting is a key component in customer relationship management.
True
4
Call center service training is a preproduction service that requires forecasts to create value in a value chain.
Unlock Deck
Unlock for access to all 35 flashcards in this deck.
Unlock Deck
k this deck
5
A moving average (MA) method is most appropriate for data with major identifiable trends.
Unlock Deck
Unlock for access to all 35 flashcards in this deck.
Unlock Deck
k this deck
6
_____ are necessary to plan for facility expansion.
A) Long-range forecasts
B) Intermediate-range forecasts
C) Make-to-order operations
D) Make-to-stock operations
A) Long-range forecasts
B) Intermediate-range forecasts
C) Make-to-order operations
D) Make-to-stock operations
Unlock Deck
Unlock for access to all 35 flashcards in this deck.
Unlock Deck
k this deck
7
_____ is a common approach to gather data for judgmental forecasts.
A) A moving average model
B) Regression analysis
C) A survey questionnaire
D) Single exponential smoothing
A) A moving average model
B) Regression analysis
C) A survey questionnaire
D) Single exponential smoothing
Unlock Deck
Unlock for access to all 35 flashcards in this deck.
Unlock Deck
k this deck
8
In the context of causal forecasting models with multiple regression, an R-squared (R2) value of 0.70 means that 30 percent of the variation in the dependent variable is explained by the independent variable.
Unlock Deck
Unlock for access to all 35 flashcards in this deck.
Unlock Deck
k this deck
9
Moving average (MA) methods work best when:
A) a long planning horizon is involved.
B) a cyclical pattern is observed in a time series.
C) demand is relatively stable and consistent.
D) there is a major trend in a time series.
A) a long planning horizon is involved.
B) a cyclical pattern is observed in a time series.
C) demand is relatively stable and consistent.
D) there is a major trend in a time series.
Unlock Deck
Unlock for access to all 35 flashcards in this deck.
Unlock Deck
k this deck
10
__________is the difference between the observed value of the time series and the forecast.
A) Forecast error
B) Forecast consumption
C) Forecast precision
D) Forecast density
A) Forecast error
B) Forecast consumption
C) Forecast precision
D) Forecast density
Unlock Deck
Unlock for access to all 35 flashcards in this deck.
Unlock Deck
k this deck
11
In the context of demand planning, customers' wants and needs define the customer benefit package.
Unlock Deck
Unlock for access to all 35 flashcards in this deck.
Unlock Deck
k this deck
12
In the context of forecasting errors, _____ eliminates the measurement scale factor.
A) normalized mean signed deviation
B) mean absolute deviation
C) normalized root mean square error
D) mean absolute percentage error
A) normalized mean signed deviation
B) mean absolute deviation
C) normalized root mean square error
D) mean absolute percentage error
Unlock Deck
Unlock for access to all 35 flashcards in this deck.
Unlock Deck
k this deck
13
The following table shows the sales data of server computers of Ziffcore Inc. for the past 5 years. The management plotted the data on a chart. The chart suggested that the sales appear to be increasing in a fairly predictable linear fashion and that the sales are related to time by a linear function Y t =240+340t. Using simple linear regression, calculate the forecast for sales in year 6.
A) The forecast for sales in year 6 is more than 1800 but less than or equal to 2000.
B) The forecast for sales in year 6 is more than 2000 but less than or equal to 2200.
C) The forecast for sales in year 6 is more than 2200 but less than or equal to 2400.
D) The forecast for sales in year 6 is more than 2400 but less than or equal to 2600.
Unlock Deck
Unlock for access to all 35 flashcards in this deck.
Unlock Deck
k this deck
14
If the time series in an exponential smoothing model exhibits a negative trend, the _____.
A) mean square error will be negative
B) value of smoothing constant will either be less than zero or greater than one
C) forecast will overshoot the actual values
D) future forecasts will rely solely upon expertise of people in developing forecasts
A) mean square error will be negative
B) value of smoothing constant will either be less than zero or greater than one
C) forecast will overshoot the actual values
D) future forecasts will rely solely upon expertise of people in developing forecasts
Unlock Deck
Unlock for access to all 35 flashcards in this deck.
Unlock Deck
k this deck
15
__________is a forecasting technique that uses a weighted average of past time-series values to forecast the value of the time series in the next period.
A) A moving average forecast
B) Single exponential smoothing
C) A grassroots forecast
D) Regression analysis
A) A moving average forecast
B) Single exponential smoothing
C) A grassroots forecast
D) Regression analysis
Unlock Deck
Unlock for access to all 35 flashcards in this deck.
Unlock Deck
k this deck
16
The following table shows the sales data of a particular model of a DVD player. If the forecast sales for May is 36.25, calculate the sales forecast for July using the simple exponential smoothing (SES) model with a smoothing constant of 0.40.
A) The sales forecast for July is more than 30 but less than or equal to 35.
B) The sales forecast for July is more than 35 but less than or equal to 40.
C) The sales forecast for July is more than 40 but less than or equal to 50.
D) The sales forecast for July is more than 50 but less than or equal to 55.
Unlock Deck
Unlock for access to all 35 flashcards in this deck.
Unlock Deck
k this deck
17
Judgmental forecasting relies upon historical data in developing forecasts.
Unlock Deck
Unlock for access to all 35 flashcards in this deck.
Unlock Deck
k this deck
18
In the context of data patterns in a time series, a(n) _____ is a one-time variation that is explainable.
A) cyclical variation
B) random variation
C) irregular variation
D) seasonal variation
A) cyclical variation
B) random variation
C) irregular variation
D) seasonal variation
Unlock Deck
Unlock for access to all 35 flashcards in this deck.
Unlock Deck
k this deck
19
In the context of forecasting, the term__________refers to the tendency of forecasts to consistently be larger or smaller than the actual values of the time series.
A) trend
B) bias
C) fad
D) variability
A) trend
B) bias
C) fad
D) variability
Unlock Deck
Unlock for access to all 35 flashcards in this deck.
Unlock Deck
k this deck
20
The mean absolute percentage error (MAPE) for the forecasts shown in the following table is:
A) less than or equal to 5 percent.
B) more than 5 percent but less than or equal to 10 percent.
C) more than 10 percent but less than or equal to 15 percent.
D) more than 15 percent.
A) less than or equal to 5 percent.
B) more than 5 percent but less than or equal to 10 percent.
C) more than 10 percent but less than or equal to 15 percent.
D) more than 15 percent.
Unlock Deck
Unlock for access to all 35 flashcards in this deck.
Unlock Deck
k this deck
21
In the context of a fairly stable time series with relatively little random variability, which of the following statements is true of single exponential smoothing (SES)
A) Values of the smoothing constant larger than 0.5 place more emphasis on recent data.
B) Exponential smoothing models completely forget past data if the smoothing constant is strictly between 0 and 1.
C) Typical values for the smoothing constant are in the range of 1 to 1.5.
D) Values of the smoothing constant smaller than 0.1 allow a forecast to react faster to changing conditions.
Unlock Deck
Unlock for access to all 35 flashcards in this deck.
Unlock Deck
k this deck
22
A tracking signal provides a method for monitoring a forecast by quantifying _____.
A) bias
B) throughput
C) probability
D) validity
A) bias
B) throughput
C) probability
D) validity
Unlock Deck
Unlock for access to all 35 flashcards in this deck.
Unlock Deck
k this deck
23
__________is a method for building a statistical model that defines a relationship between a single dependent variable and one or more independent variables, all of which are numerical.
A) The Delphi method
B) Regression analysis
C) Judgmental forecasting
D) The Cooke method
A) The Delphi method
B) Regression analysis
C) Judgmental forecasting
D) The Cooke method
Unlock Deck
Unlock for access to all 35 flashcards in this deck.
Unlock Deck
k this deck
24
The following table shows the data for the sales of tennis rackets at a store for 4 consecutive months. Find the forecast error in month 4 using a 3-month moving average.
A) The forecast error in month 4 is less than or equal to 5.
B) The forecast error in month 4 is more than 5 but less than or equal to 10.
C) The forecast error in month 4 is more than 10 but less than or equal to 15.
D) The forecast error in month 4 is more than 15.
A) The forecast error in month 4 is less than or equal to 5.
B) The forecast error in month 4 is more than 5 but less than or equal to 10.
C) The forecast error in month 4 is more than 10 but less than or equal to 15.
D) The forecast error in month 4 is more than 15.
Unlock Deck
Unlock for access to all 35 flashcards in this deck.
Unlock Deck
k this deck
25
An exponential smoothing model must have a smoothing constant (α) _____ to be roughly equivalent to a moving average model with a seven-month moving average.
A) less than or equal to 0.10
B) more than 0.10 but less than or equal to 0.15
C) more than 0.15 but less than or equal to 0.20
D) more than 0.20
A) less than or equal to 0.10
B) more than 0.10 but less than or equal to 0.15
C) more than 0.15 but less than or equal to 0.20
D) more than 0.20
Unlock Deck
Unlock for access to all 35 flashcards in this deck.
Unlock Deck
k this deck
26
Alex, a manager at Symbic Inc., plotted the company's total energy costs of 1 billion dollars over the past 10 years on a chart. The chart suggested that the energy costs appear to be increasing in a fairly predictable linear fashion and that the energy costs are related to time by a linear function Y t =3+5t, where Y trepresents the estimate of the energy cost in year t. Given the equation, which of the following is the value of the intercept of the straight line that best fits the time series
A) 1
B) 3
C) 5
D) 10
A) 1
B) 3
C) 5
D) 10
Unlock Deck
Unlock for access to all 35 flashcards in this deck.
Unlock Deck
k this deck
27
The following table shows the data for the sales of a new music album at a store for 4 consecutive months. Find the forecast for the next month using a 3-month moving average.
A) The forecast for the next month is more than 90 but less than or equal to 100.
B) The forecast for the next month is more than 100 but less than or equal to 110.
C) The forecast for the next month is more than 110 but less than or equal to 120.
D) The forecast for the next month is more than 120 but less than or equal to 130.
Unlock Deck
Unlock for access to all 35 flashcards in this deck.
Unlock Deck
k this deck
28
In the Delphi method of judgmental forecasting, _____.
A) predictions are based on the assumption that the future will be an extrapolation of the past
B) predictions are based on one or more independent variables, all of which are numerical
C) people from outside an organization are not eligible to make predictions
D) experts are not consulted as a group to make predictions
Unlock Deck
Unlock for access to all 35 flashcards in this deck.
Unlock Deck
k this deck
29
_____ are used by operations managers to plan production schedules and assign workers to jobs.
A) Balanced scorecards
B) Intermediate-range forecasts
C) Short-range forecasts
D) Credit scorecards
A) Balanced scorecards
B) Intermediate-range forecasts
C) Short-range forecasts
D) Credit scorecards
Unlock Deck
Unlock for access to all 35 flashcards in this deck.
Unlock Deck
k this deck
30
The mean absolute deviation (MAD) for the forecasts shown in the following table is:
A) more than 10 but less than or equal to 20.
B) more than 20 but less than or equal to 30.
C) more than 30 but less than or equal to 40.
D) more than 40 but less than or equal to 50.
A) more than 10 but less than or equal to 20.
B) more than 20 but less than or equal to 30.
C) more than 30 but less than or equal to 40.
D) more than 40 but less than or equal to 50.
Unlock Deck
Unlock for access to all 35 flashcards in this deck.
Unlock Deck
k this deck
31
In the context of data patterns in a time series, regular patterns in a data series that take place over long periods of time are called _____.
A) orthographic patterns
B) seasonal patterns
C) cyclical patterns
D) parallel patterns
A) orthographic patterns
B) seasonal patterns
C) cyclical patterns
D) parallel patterns
Unlock Deck
Unlock for access to all 35 flashcards in this deck.
Unlock Deck
k this deck
32
The mean square error (MSE) for the forecasts shown in the following table is:
A) more than 250 but less than or equal to 300.
B) more than 300 but less than or equal to 350.
C) more than 350 but less than or equal to 400.
D) more than 400 but less than or equal to 450.
A) more than 250 but less than or equal to 300.
B) more than 300 but less than or equal to 350.
C) more than 350 but less than or equal to 400.
D) more than 400 but less than or equal to 450.
Unlock Deck
Unlock for access to all 35 flashcards in this deck.
Unlock Deck
k this deck
33
__________is based on the assumption that the future will be an extrapolation of the past.
A) Judgmental forecasting
B) Statistical forecasting
C) The Delphi method
D) The Cooke method
A) Judgmental forecasting
B) Statistical forecasting
C) The Delphi method
D) The Cooke method
Unlock Deck
Unlock for access to all 35 flashcards in this deck.
Unlock Deck
k this deck
34
_____ are needed to plan workforce levels, allocate budgets among divisions, and schedule jobs and resources.
A) Make-to-order operations
B) Intermediate-range forecasts
C) Short-range forecasts
D) Make-to-stock operations
A) Make-to-order operations
B) Intermediate-range forecasts
C) Short-range forecasts
D) Make-to-stock operations
Unlock Deck
Unlock for access to all 35 flashcards in this deck.
Unlock Deck
k this deck
35
When no historical data are available, _____ is the sole basis for predicting future demands.
A) statistical forecasting
B) regression analysis
C) judgmental forecasting
D) exponential smoothing
A) statistical forecasting
B) regression analysis
C) judgmental forecasting
D) exponential smoothing
Unlock Deck
Unlock for access to all 35 flashcards in this deck.
Unlock Deck
k this deck
Unlock Deck
Unlock for access to all 35 flashcards in this deck.


