Deck 10: Linear Optimization Models
Full screen (f)
Question
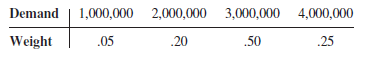
OuRx, a retail pharmacy chain, is faced with the decision of how much flu vaccine to order for the next flu season. OuRx has to place a single order for the flu vaccine several months before the beginning of the season because it takes four to five months for the supplier to create the vaccine. OuRx wants to more closely examine the ordering decision because, over the past few years, the company has ordered too much vaccine and too little. OuRx pays a wholesale price of $12 per dose to obtain the flu vaccine from the supplier and then sells the flu shot to their customers at a retail price of $20. Based on industry trends as feedback from their marketing managers, OuRx has generated a rough estimate of flu vaccine demand at their retail pharmacies. OuRx is confident that demand will range from 800,000 doses to 4,500,000 doses. The following table lists weights for demand values within this range.
the appropriate profit computation depends on whether demand exceeds the order quantity or vice versa. Similarly, the number of lost sales and excess doses depends on whether demand exceeds the order quantity or vice versa.
a. Construct a spreadsheet model that computes net profit corresponding to a given level of demand and specified order quantity. Model demand as a random variable with ASP's custom general distribution.
b. Using simulation optimization, determine the order quantity that maximizes expected profit. What is the probability of running out of flu vaccine at this order quantity
c. How many doses does OuRx need to order so that the probability of running out of flu vaccine is only 25 percent How much expected profit will OuRx lose if it orders this amount rather than the amount from part b
Question
Question
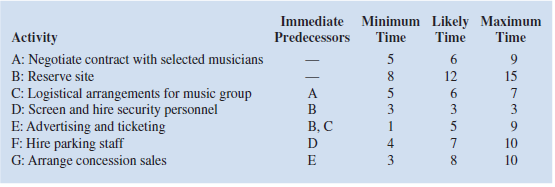
At a local university, the Student Commission on Programming and Entertainment (SCOPE) is preparing to host its first rock concert of the school year. To successfully produce this rock concert, SCOPE has to complete several activities. The following table lists information regarding each activity. An activity's immediate predecessors are those activities that must be completed before the considered activity can begin. The table also lists duration estimates (in days) for each activity.
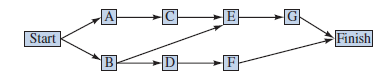
The following network illustrates the precedence relationships in the SCOPE project. Theproject begins with activities A and B, which can start immediately (time 0) because they have no predecessors. On the other hand, activity E cannot be started until activities B and C are both completed. The project is not complete until all activities are completed.
a. Using the PERT distribution in ASP to represent the duration of each activity, construct a simulation model to compute the total time to complete the concert preparations.
b. What is the expected duration of the entire project What is the standard deviation of the project duration
c. What is the likelihood that the project will be complete in 23 days
Question
Four Corners
What will your portfolio be worth in 10 years In 20 years When you stop working The Human Resources Department at Four Corners Corporation was asked to develop a financial planning model that would help employees address these questions. Tom Gifford was asked to lead this effort and decided to begin by developing a financial plan for himself. Tom has a degree in business and, at the age of 40, is making $85,000 per year. Through contributions to his company's retirement program and the receipt of a small inheritance, Tom has accumulated a portfolio valued at $50,000. Tom plans to work 20 more years and hopes to accumulate a portfolio valued at $1,000,000. Can he do it
Tom began with a few assumptions about his future salary, his new investment contributions, and his portfolio growth rate. He assumed a 5 percent annual salary growth rate and plans to make new investment contributions at 6 percent of his salary. After some research on historical stock market performance, Tom decided that a 10 percent annual portfolio growth rate was reasonable. Using these assumptions, Tom developed the following Excel worksheet:
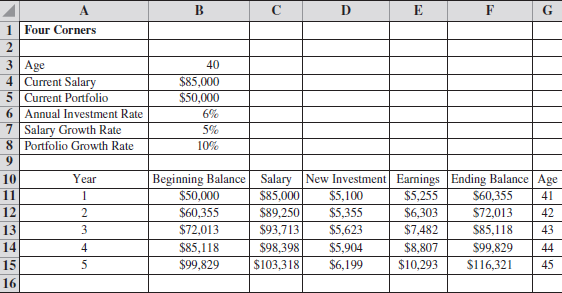
The worksheet provides a financial projection for the next five years. In computing the portfolio earnings for a given year, Tom assumed that his new investment contribution would occur evenly throughout the year, and thus half of the new investment could be included in the computation of the portfolio earnings for the year. From the worksheet, we see that, at age 45, Tom is projected to have a portfolio valued at $116,321.
Tom's plan was to use this worksheet as a template to develop financial plans for the company's employees. The data in the spreadsheet would be tailored for each employee, and rows would be added to it to reflect the employee's planning horizon. After adding another 15 rows to the worksheet, Tom found that he could expect to have a portfolio of $772,722 after 20 years. Tom then took his results to show his boss, Kate Krystkowiak.
Although Kate was pleased with Tom's progress, she voiced several criticisms. One of the criticisms was the assumption of a constant annual salary growth rate. She noted that most employees experience some variation in the annual salary growth rate from year to year. In addition, she pointed out that the constant annual portfolio growth rate was unrealistic and that the actual growth rate would vary considerably from year to year. She further suggested that a simulation model for the portfolio projection might allow Tom to account for the random variability in the salary growth rate and the portfolio growth rate.
After some research, Tom and Kate decided to assume that the annual salary growth rate would vary from 0 to 5 percent and that a uniform probability distribution would provide a realistic approximation. Four Corner's accountants suggested that the annual portfolio growth rate could be approximated by a normal probability distribution with a mean of 10 percent and a standard deviation of 5 percent. With this information, Tom set off to redesign his spreadsheet so that it could be used by the company's employees for financial planning.
Managerial Report
Play the role of Tom Gifford, and develop a simulation model for financial planning. Write a report for Tom's boss and, at a minimum, include the following:
1. Without considering the random variability, extend the current worksheet to 20 years. Confirm that by using the constant annual salary growth rate and the constant annual portfolio growth rate, Tom can expect to have a 20-year portfolio of $772,722. What would Tom's annual investment rate have to increase to in order for his portfolio to reach a 20-year, $1,000,000 goal (hint: Use Goal Seek.)
2. Redesign the spreadsheet model to incorporate the random variability of the annual salary growth rate and the annual portfolio growth rate into a simulation model. Assume that Tom is willing to use the annual investment rate that predicted a 20-year, $1,000,000 portfolio in part 1. Show how to simulate Tom's 20-year financial plan. Use results from the simulation model to comment on the uncertainty associated with Tom reaching the 20-year, $1,000,000 goal.
3. What recommendations do you have for employees with a current profile similar to Tom's after seeing the impact of the uncertainty in the annual salary growth rate and the annual portfolio growth rate
4. Assume that Tom is willing to consider working 25 more years instead of 20 years. What is your assessment of this strategy if Tom's goal is to have a portfolio worth $1,000,000
5. Discuss how the financial planning model developed for Tom Gifford can be used as a template to develop a financial plan for any of the company's employees.
What will your portfolio be worth in 10 years In 20 years When you stop working The Human Resources Department at Four Corners Corporation was asked to develop a financial planning model that would help employees address these questions. Tom Gifford was asked to lead this effort and decided to begin by developing a financial plan for himself. Tom has a degree in business and, at the age of 40, is making $85,000 per year. Through contributions to his company's retirement program and the receipt of a small inheritance, Tom has accumulated a portfolio valued at $50,000. Tom plans to work 20 more years and hopes to accumulate a portfolio valued at $1,000,000. Can he do it
Tom began with a few assumptions about his future salary, his new investment contributions, and his portfolio growth rate. He assumed a 5 percent annual salary growth rate and plans to make new investment contributions at 6 percent of his salary. After some research on historical stock market performance, Tom decided that a 10 percent annual portfolio growth rate was reasonable. Using these assumptions, Tom developed the following Excel worksheet:
The worksheet provides a financial projection for the next five years. In computing the portfolio earnings for a given year, Tom assumed that his new investment contribution would occur evenly throughout the year, and thus half of the new investment could be included in the computation of the portfolio earnings for the year. From the worksheet, we see that, at age 45, Tom is projected to have a portfolio valued at $116,321.
Tom's plan was to use this worksheet as a template to develop financial plans for the company's employees. The data in the spreadsheet would be tailored for each employee, and rows would be added to it to reflect the employee's planning horizon. After adding another 15 rows to the worksheet, Tom found that he could expect to have a portfolio of $772,722 after 20 years. Tom then took his results to show his boss, Kate Krystkowiak.
Although Kate was pleased with Tom's progress, she voiced several criticisms. One of the criticisms was the assumption of a constant annual salary growth rate. She noted that most employees experience some variation in the annual salary growth rate from year to year. In addition, she pointed out that the constant annual portfolio growth rate was unrealistic and that the actual growth rate would vary considerably from year to year. She further suggested that a simulation model for the portfolio projection might allow Tom to account for the random variability in the salary growth rate and the portfolio growth rate.
After some research, Tom and Kate decided to assume that the annual salary growth rate would vary from 0 to 5 percent and that a uniform probability distribution would provide a realistic approximation. Four Corner's accountants suggested that the annual portfolio growth rate could be approximated by a normal probability distribution with a mean of 10 percent and a standard deviation of 5 percent. With this information, Tom set off to redesign his spreadsheet so that it could be used by the company's employees for financial planning.
Managerial Report
Play the role of Tom Gifford, and develop a simulation model for financial planning. Write a report for Tom's boss and, at a minimum, include the following:
1. Without considering the random variability, extend the current worksheet to 20 years. Confirm that by using the constant annual salary growth rate and the constant annual portfolio growth rate, Tom can expect to have a 20-year portfolio of $772,722. What would Tom's annual investment rate have to increase to in order for his portfolio to reach a 20-year, $1,000,000 goal (hint: Use Goal Seek.)
2. Redesign the spreadsheet model to incorporate the random variability of the annual salary growth rate and the annual portfolio growth rate into a simulation model. Assume that Tom is willing to use the annual investment rate that predicted a 20-year, $1,000,000 portfolio in part 1. Show how to simulate Tom's 20-year financial plan. Use results from the simulation model to comment on the uncertainty associated with Tom reaching the 20-year, $1,000,000 goal.
3. What recommendations do you have for employees with a current profile similar to Tom's after seeing the impact of the uncertainty in the annual salary growth rate and the annual portfolio growth rate
4. Assume that Tom is willing to consider working 25 more years instead of 20 years. What is your assessment of this strategy if Tom's goal is to have a portfolio worth $1,000,000
5. Discuss how the financial planning model developed for Tom Gifford can be used as a template to develop a financial plan for any of the company's employees.
Question
Question
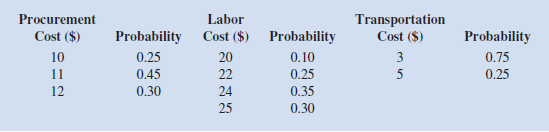
The management of Brinkley Corporation is interested in using simulation to estimate the profit per unit for a new product. The selling price for the product will be $45 per unit. Probability distributions for the purchase cost, the labor cost, and the transportation cost are estimated as follows:
a. Compute profit per unit for the base case, worst case, and best case.
b. Construct a simulation model to estimate the mean profit per unit.
c. Why is the simulation approach to risk analysis preferable to generating a variety of what-if scenarios
d. Management believes the project may not be sustainable if the profit per unit is less than $5. Use simulation to estimate the probability the profit per unit will be less than $5
Question
Question
Question
Question
Question
Question
Question
Question
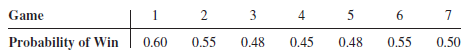
Baseball's World Series is a maximum of seven games, with the winner being the first team to win four games. Assume that the Atlanta Braves are playing the Minnesota Twins in the World Series and that the first two games are to be played in Atlanta, the next three games at the Twins' ballpark, and the last two games, if necessary, back in Atlanta. Taking into account the projected starting pitchers for each game and the home field advantage, the probabilities of Atlanta winning each game are as follows:
a. Set up a spreadsheet simulation model in which whether Atlanta wins each game is a random variable.
b. What is the probability that the Atlanta Braves win the World Series
c. What is the average number of games played regardless of winner
a. Set up a spreadsheet simulation model in which whether Atlanta wins each game is a random variable.
b. What is the probability that the Atlanta Braves win the World Series
c. What is the average number of games played regardless of winner
Question
Question
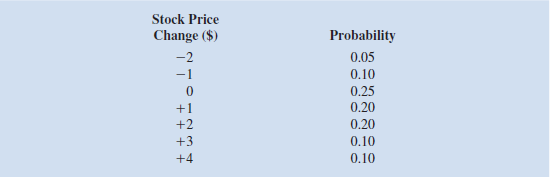
The price of a share of a particular stock listed on the New York Stock Exchange is currently $39. The following probability distribution shows how the price per share is expected to change over a three-month period:
a. Construct a spreadsheet simulation model that computes the value of the stock price in 3 months, 6 months, 9 months, and 12 months under the assumption that the change in stock price over any 3-month period is independent of the change in stock price over any other 3-month period.
b. With the current price of $39 per share, simulate the price per share for the next four 3-month periods. What is the average stock price per share in 12 months What is the standard deviation of the stock price in 12 months c. Based on the model assumptions, what are the lowest and highest possible prices for this
stock in 12 months Based on your knowledge of the stock market, how valid do you think this is Propose an alternative to modeling how stock prices evolve over 3-month periods.
Question
Question
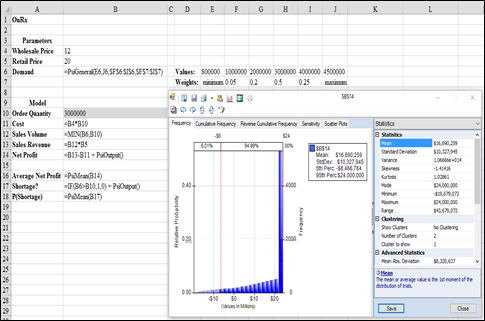
The Iowa Energy are scheduled to play against the Maine Red Claws in an upcoming game in the National Basketball Association Developmental League (NBA-DL). Because a player in the NBA-DL is still developing his skills, the number of points he scores in a game can vary. Assume that each player's point production can be represented as an integer uniform variable with the ranges provided in the following table:
![The Iowa Energy are scheduled to play against the Maine Red Claws in an upcoming game in the National Basketball Association Developmental League (NBA-DL). Because a player in the NBA-DL is still developing his skills, the number of points he scores in a game can vary. Assume that each player's point production can be represented as an integer uniform variable with the ranges provided in the following table: a. Develop a spreadsheet model that simulates the points scored by each team. b. What are the average and standard deviation of points scored by the Iowa Energy What is the shape of the distribution of points scored by the Iowa Energy c. What is the average and standard deviation of points scored by the Maine Red Claws What is the shape of the distribution of points scored by the Maine Red Claws d. Let Point Differential 5 Iowa Energy points - Maine Red Claw points. What is the average point differential between the Iowa Energy and Maine Red Claws What is the standard deviation in the point differential What is the shape of the point differential distribution e. What is the probability that the Iowa Energy scores more points than the Maine Red Claws f. The coach of the Iowa Energy feels that they are the underdog and is considering a riskier game strategy. The effect of this strategy is that the range of each Energy player's point production increases symmetrically so that the new range is [0, original upper bound 1 original lower bound]. For example, Energy player 1's range with the risky strategy is [0,25]. How does the new strategy affect the average and standard deviation of the Energy point total How does that affect the probability of the Iowa Energy scoring more points that the Maine Red Claws<div style=padding-top: 35px>](https://d2lvgg3v3hfg70.cloudfront.net/SM2433/11eba100_aeea_88d5_9c44_59007d3f8be9_SM2433_00.jpg)
a. Develop a spreadsheet model that simulates the points scored by each team.
b. What are the average and standard deviation of points scored by the Iowa Energy What is the shape of the distribution of points scored by the Iowa Energy
c. What is the average and standard deviation of points scored by the Maine Red Claws What is the shape of the distribution of points scored by the Maine Red Claws
d. Let Point Differential 5 Iowa Energy points - Maine Red Claw points. What is the average point differential between the Iowa Energy and Maine Red Claws What is the standard deviation in the point differential What is the shape of the point differential distribution
e. What is the probability that the Iowa Energy scores more points than the Maine Red Claws
f. The coach of the Iowa Energy feels that they are the underdog and is considering a riskier game strategy. The effect of this strategy is that the range of each Energy player's point production increases symmetrically so that the new range is [0, original upper bound 1 original lower bound]. For example, Energy player 1's range with the risky strategy is [0,25]. How does the new strategy affect the average and standard deviation of the Energy point total How does that affect the probability of the Iowa Energy scoring more points that the Maine Red Claws
Question
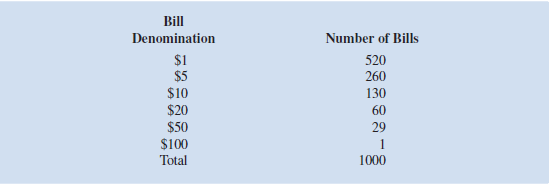
A creative entrepreneur has created a novelty soap called jackpot. Inside each bar of jackpot soap is a rolled-up bill of U.S. currency. There are 1000 bars of soap in the initial offering of the soap. Although the denomination of the bill inside a bar of soap is unknown, the distribution of bills in these first 1000 bars is given in the following table:
How many bars of soap does a customer have to buy so that, on average, she has purchased two containing a $50 or $100 bill ( hint: Use the hypergeometric distribution in ASP to answer this question.)
How many bars of soap does a customer have to buy so that, on average, she has purchased two containing a $50 or $100 bill ( hint: Use the hypergeometric distribution in ASP to answer this question.)
Question
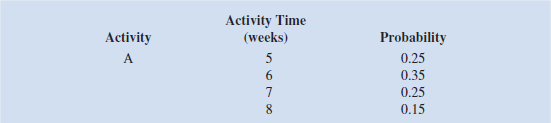
A project has four activities (A, B, C, and D) that must be performed sequentially. The probability distributions for the time required to complete each of the activities are as follows:
a. Construct a spreadsheet simulation model to estimate the average length of the project and the standard deviation of the project length.
b. What is the estimated probability that the project will be completed in 35 weeks or less
a. Construct a spreadsheet simulation model to estimate the average length of the project and the standard deviation of the project length.
b. What is the estimated probability that the project will be completed in 35 weeks or less
Question
Question
Question
Question
Question
South Central Airlines (SCA) operates a commuter flight between Atlanta and Charlotte. The regional jet holds 50 passengers and currently SCA books only up to 50 reservations. Past data shows that SCA always sells all 50 reservations but that, on average, two passengers do not show up. As a result, with 50 reservations, the flight is often being flown with
empty seats. To capture additional profit, SCA is considering an overbooking strategy in which they would accept 52 reservations even though the airplane holds only 50 passengers. SCA believes that it will be able to always book all 52 reservations. The probability
distribution for the number of passengers showing up when 52 reservations are accepted is estimated as follows:

SCA receives a marginal profit of $100 for each passenger who books a reservation (regardless whether they show up). The airline will also incur a cost for any passenger denied seating on the flight. This cost covers added expenses of rescheduling the passenger as well as loss of goodwill, estimated to be $150 per passenger. Develop a spreadsheet
simulation model for this overbooking system. Simulate the number of passengers showing up for a flight.
a. What is the average net profit for each flight with the overbooking strategy
b. What is the probability that the net profit with the overbooking strategy will be less than the net profit without overbooking (50*$100 5 $5,000)
c. Explain how your simulation model could be used to evaluate other overbooking levels such as 51, 53, and 54 and for recommending a best overbooking strategy
empty seats. To capture additional profit, SCA is considering an overbooking strategy in which they would accept 52 reservations even though the airplane holds only 50 passengers. SCA believes that it will be able to always book all 52 reservations. The probability
distribution for the number of passengers showing up when 52 reservations are accepted is estimated as follows:
SCA receives a marginal profit of $100 for each passenger who books a reservation (regardless whether they show up). The airline will also incur a cost for any passenger denied seating on the flight. This cost covers added expenses of rescheduling the passenger as well as loss of goodwill, estimated to be $150 per passenger. Develop a spreadsheet
simulation model for this overbooking system. Simulate the number of passengers showing up for a flight.
a. What is the average net profit for each flight with the overbooking strategy
b. What is the probability that the net profit with the overbooking strategy will be less than the net profit without overbooking (50*$100 5 $5,000)
c. Explain how your simulation model could be used to evaluate other overbooking levels such as 51, 53, and 54 and for recommending a best overbooking strategy
Question
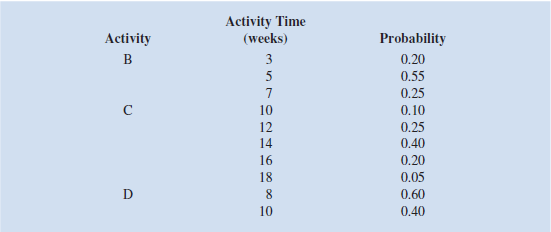
The wedding date for a couple is quickly approaching, and the wedding planner must provide the caterer an estimate of how many people will attend the reception so thatthe appropriate quantity of food is prepared for the buffet. The following table contains information on the number of RSVP'ed guests for the 145 invitations. Unfortunately, the number of guests does not always correspond to the number of RSVP'ed guests. Based on her experience, the wedding planner knows it is extremely rare for guests to attend a wedding if they affirmed that they will not be attending. Therefore, the wedding planner will assume that no one from these 50 invitations will attend. The wedding planner estimates that the each of the 25 guests planning to come solo has a 75 percent chance of attending alone, a 20 percent chance of not attending, and a 5 percent chance of bringing a companion. For each of the 60 RSVPs who plan to bring a companion, there is a 90 percent chance that she or he will attend with a companion, a 5 percent chance of attending solo, and a 5 percent chance of not attending at all. For the 10 people who have not responded, the wedding planner assumes that there is an 80 percent chance that each will not attend, a 15 percent chance they will attend alone, and a 5 percent chance they will attend with a companion.
a. Assist the wedding planner by constructing a spreadsheet simulation model to determine the expected number of guests who will attend the reception.
b. To be accommodating hosts, the couple has instructed the wedding planner to use the Monte Carlo simulation model to determine X , the minimum number of guests for which the caterer should prepare the meal, so that there is at least a 90 percent chance that the actual attendance is less than or equal to X. What is the best estimate for the value of X

Unlock Deck
Sign up to unlock the cards in this deck!
Unlock Deck
Unlock Deck
1/26
Play
Full screen (f)
Deck 10: Linear Optimization Models
1
OuRx, a retail pharmacy chain, is faced with the decision of how much flu vaccine to order for the next flu season. OuRx has to place a single order for the flu vaccine several months before the beginning of the season because it takes four to five months for the supplier to create the vaccine. OuRx wants to more closely examine the ordering decision because, over the past few years, the company has ordered too much vaccine and too little. OuRx pays a wholesale price of $12 per dose to obtain the flu vaccine from the supplier and then sells the flu shot to their customers at a retail price of $20. Based on industry trends as feedback from their marketing managers, OuRx has generated a rough estimate of flu vaccine demand at their retail pharmacies. OuRx is confident that demand will range from 800,000 doses to 4,500,000 doses. The following table lists weights for demand values within this range.
the appropriate profit computation depends on whether demand exceeds the order quantity or vice versa. Similarly, the number of lost sales and excess doses depends on whether demand exceeds the order quantity or vice versa.
a. Construct a spreadsheet model that computes net profit corresponding to a given level of demand and specified order quantity. Model demand as a random variable with ASP's custom general distribution.
b. Using simulation optimization, determine the order quantity that maximizes expected profit. What is the probability of running out of flu vaccine at this order quantity
c. How many doses does OuRx need to order so that the probability of running out of flu vaccine is only 25 percent How much expected profit will OuRx lose if it orders this amount rather than the amount from part b
the appropriate profit computation depends on whether demand exceeds the order quantity or vice versa. Similarly, the number of lost sales and excess doses depends on whether demand exceeds the order quantity or vice versa.
a. Construct a spreadsheet model that computes net profit corresponding to a given level of demand and specified order quantity. Model demand as a random variable with ASP's custom general distribution.
b. Using simulation optimization, determine the order quantity that maximizes expected profit. What is the probability of running out of flu vaccine at this order quantity
c. How many doses does OuRx need to order so that the probability of running out of flu vaccine is only 25 percent How much expected profit will OuRx lose if it orders this amount rather than the amount from part b
a.
The procedure in Analytic Solver Platform to determine the expected net profit corresponding to an order of quantity of 3,000,000 is written below:
1. Click the Analytic Solver Platform tab in the Ribbon.
2. Select the target cell.
3. Click Parameters in the Parameters group
 Select Simulation
 Enter the values into Values_or_lower.
4. Click OK.
5. Click Options in the Options group
 Enter the required simulation value in the box next to Simulations to Run:
6. Click OK.
7. Select the target cell for results.
8. Click Results in the simulation model group
 Select Statistic and click Mean
 Select the range accordingly for mean.
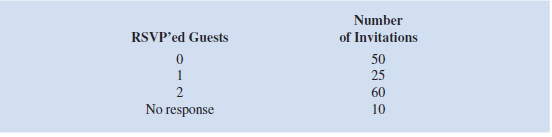
The formulas used in Analytic Solver Platform to determine the expected net profit corresponding to an order of quantity of 3,000,000 is as shown below:
 Thus, for an order quantity of $3,000,000, the expected net profit is $16,690,259.
b.The formulas used in Analytic Solver Platform to determine the order quantity that maximizes expected is as shown below:
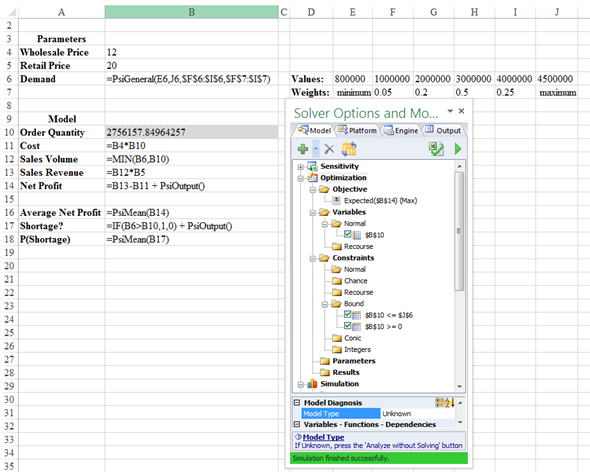 An order quantity of about 2,756,000 doses maximizes the expected profit at a value of approximately $16,983,000. There is a 60% chance of running out of flu vaccine at this order quantity.
c.The results obtained for the percentiles are as shown below:
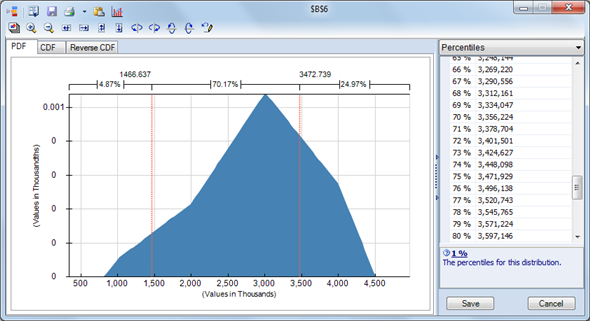 As shown in the above figure, the 75 th percentile of demand is 3,472,000. Therefore an order quantity of 3,472,000 doses confirms only a 25% chance of successively out of flu vaccine. Re-running the simulation with this order amount results in a predictable profit of $14,410,000. Thus, OuRx will be trailing down $2,573,000 in expected profit if it decides to attain a 75% service level rather than making the most of expected profit.
The procedure in Analytic Solver Platform to determine the expected net profit corresponding to an order of quantity of 3,000,000 is written below:
1. Click the Analytic Solver Platform tab in the Ribbon.
2. Select the target cell.
3. Click Parameters in the Parameters group
Select Simulation Enter the values into Values_or_lower.4. Click OK.
5. Click Options in the Options group
Enter the required simulation value in the box next to Simulations to Run: 6. Click OK.
7. Select the target cell for results.
8. Click Results in the simulation model group
Select Statistic and click Mean Select the range accordingly for mean.The formulas used in Analytic Solver Platform to determine the expected net profit corresponding to an order of quantity of 3,000,000 is as shown below:
Thus, for an order quantity of $3,000,000, the expected net profit is $16,690,259. b.The formulas used in Analytic Solver Platform to determine the order quantity that maximizes expected is as shown below:
An order quantity of about 2,756,000 doses maximizes the expected profit at a value of approximately $16,983,000. There is a 60% chance of running out of flu vaccine at this order quantity. c.The results obtained for the percentiles are as shown below:
As shown in the above figure, the 75 th percentile of demand is 3,472,000. Therefore an order quantity of 3,472,000 doses confirms only a 25% chance of successively out of flu vaccine. Re-running the simulation with this order amount results in a predictable profit of $14,410,000. Thus, OuRx will be trailing down $2,573,000 in expected profit if it decides to attain a 75% service level rather than making the most of expected profit. 2
Recall the Land Shark example within the chapter.
a. Use ASP to apply simulation optimization to determine Land Shark's bid amount that
would maximize its expected return on the upcoming auction.
b. What is Land Shark's probability of winning the auction at the bid amount from part a
a. Use ASP to apply simulation optimization to determine Land Shark's bid amount that
would maximize its expected return on the upcoming auction.
b. What is Land Shark's probability of winning the auction at the bid amount from part a
a.The procedure in Analytic Solver Platform to determine the Land Shark's bid amount that would maximize its expected return on the upcoming auction is as written below:
1. Click the Analytic Solver Platform tab in the Ribbon.
2. Select cell B18 which contains Land Shark's bid amount.
3. Click Parameters in the Parameters group. Select Simulation. When the Analytic Solver Platform Options dialog box appears in the box next to Values_or_lower enter the required values.
4. Click OK.
5. Click Options in the Options group. When the Analytic Solver Platform Options dialog box appears, enter 10 in the box next to Simulations to Run.
6. Click OK.
7. Select cell B21 which contains Landshark's return.
8. Click Results in the Simulation Model group. Select Statistic and click Mean. When the dialog bubble =PsiMean (B21). Select the cell where the statistic will be placed appears.
The output from Analytic Solver Platform is as shown below:
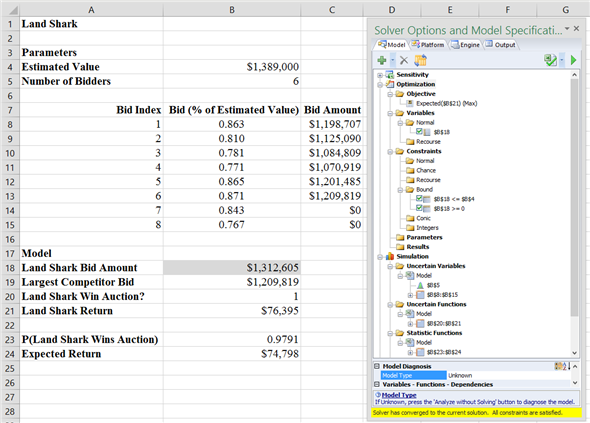 Thus, a bid amount of about $1,312,600 maximizes the expected return on the auction to a value of approximately $74,800.
b.The probability of winning the auction at a bid amount of $1,312,600 is approximately 0.98.
1. Click the Analytic Solver Platform tab in the Ribbon.
2. Select cell B18 which contains Land Shark's bid amount.
3. Click Parameters in the Parameters group. Select Simulation. When the Analytic Solver Platform Options dialog box appears in the box next to Values_or_lower enter the required values.
4. Click OK.
5. Click Options in the Options group. When the Analytic Solver Platform Options dialog box appears, enter 10 in the box next to Simulations to Run.
6. Click OK.
7. Select cell B21 which contains Landshark's return.
8. Click Results in the Simulation Model group. Select Statistic and click Mean. When the dialog bubble =PsiMean (B21). Select the cell where the statistic will be placed appears.
The output from Analytic Solver Platform is as shown below:
Thus, a bid amount of about $1,312,600 maximizes the expected return on the auction to a value of approximately $74,800.b.The probability of winning the auction at a bid amount of $1,312,600 is approximately 0.98.
3
At a local university, the Student Commission on Programming and Entertainment (SCOPE) is preparing to host its first rock concert of the school year. To successfully produce this rock concert, SCOPE has to complete several activities. The following table lists information regarding each activity. An activity's immediate predecessors are those activities that must be completed before the considered activity can begin. The table also lists duration estimates (in days) for each activity.
The following network illustrates the precedence relationships in the SCOPE project. Theproject begins with activities A and B, which can start immediately (time 0) because they have no predecessors. On the other hand, activity E cannot be started until activities B and C are both completed. The project is not complete until all activities are completed.
a. Using the PERT distribution in ASP to represent the duration of each activity, construct a simulation model to compute the total time to complete the concert preparations.
b. What is the expected duration of the entire project What is the standard deviation of the project duration
c. What is the likelihood that the project will be complete in 23 days
Not Answer
4
Four Corners
What will your portfolio be worth in 10 years In 20 years When you stop working The Human Resources Department at Four Corners Corporation was asked to develop a financial planning model that would help employees address these questions. Tom Gifford was asked to lead this effort and decided to begin by developing a financial plan for himself. Tom has a degree in business and, at the age of 40, is making $85,000 per year. Through contributions to his company's retirement program and the receipt of a small inheritance, Tom has accumulated a portfolio valued at $50,000. Tom plans to work 20 more years and hopes to accumulate a portfolio valued at $1,000,000. Can he do it
Tom began with a few assumptions about his future salary, his new investment contributions, and his portfolio growth rate. He assumed a 5 percent annual salary growth rate and plans to make new investment contributions at 6 percent of his salary. After some research on historical stock market performance, Tom decided that a 10 percent annual portfolio growth rate was reasonable. Using these assumptions, Tom developed the following Excel worksheet:
The worksheet provides a financial projection for the next five years. In computing the portfolio earnings for a given year, Tom assumed that his new investment contribution would occur evenly throughout the year, and thus half of the new investment could be included in the computation of the portfolio earnings for the year. From the worksheet, we see that, at age 45, Tom is projected to have a portfolio valued at $116,321.
Tom's plan was to use this worksheet as a template to develop financial plans for the company's employees. The data in the spreadsheet would be tailored for each employee, and rows would be added to it to reflect the employee's planning horizon. After adding another 15 rows to the worksheet, Tom found that he could expect to have a portfolio of $772,722 after 20 years. Tom then took his results to show his boss, Kate Krystkowiak.
Although Kate was pleased with Tom's progress, she voiced several criticisms. One of the criticisms was the assumption of a constant annual salary growth rate. She noted that most employees experience some variation in the annual salary growth rate from year to year. In addition, she pointed out that the constant annual portfolio growth rate was unrealistic and that the actual growth rate would vary considerably from year to year. She further suggested that a simulation model for the portfolio projection might allow Tom to account for the random variability in the salary growth rate and the portfolio growth rate.
After some research, Tom and Kate decided to assume that the annual salary growth rate would vary from 0 to 5 percent and that a uniform probability distribution would provide a realistic approximation. Four Corner's accountants suggested that the annual portfolio growth rate could be approximated by a normal probability distribution with a mean of 10 percent and a standard deviation of 5 percent. With this information, Tom set off to redesign his spreadsheet so that it could be used by the company's employees for financial planning.
Managerial Report
Play the role of Tom Gifford, and develop a simulation model for financial planning. Write a report for Tom's boss and, at a minimum, include the following:
1. Without considering the random variability, extend the current worksheet to 20 years. Confirm that by using the constant annual salary growth rate and the constant annual portfolio growth rate, Tom can expect to have a 20-year portfolio of $772,722. What would Tom's annual investment rate have to increase to in order for his portfolio to reach a 20-year, $1,000,000 goal (hint: Use Goal Seek.)
2. Redesign the spreadsheet model to incorporate the random variability of the annual salary growth rate and the annual portfolio growth rate into a simulation model. Assume that Tom is willing to use the annual investment rate that predicted a 20-year, $1,000,000 portfolio in part 1. Show how to simulate Tom's 20-year financial plan. Use results from the simulation model to comment on the uncertainty associated with Tom reaching the 20-year, $1,000,000 goal.
3. What recommendations do you have for employees with a current profile similar to Tom's after seeing the impact of the uncertainty in the annual salary growth rate and the annual portfolio growth rate
4. Assume that Tom is willing to consider working 25 more years instead of 20 years. What is your assessment of this strategy if Tom's goal is to have a portfolio worth $1,000,000
5. Discuss how the financial planning model developed for Tom Gifford can be used as a template to develop a financial plan for any of the company's employees.
Unlock Deck
Unlock for access to all 26 flashcards in this deck.
Unlock Deck
k this deck
5
Burger Dome is a fast-food restaurant currently appraising its customer service. In its current operation, an employee takes a customer's order, tabulates the cost, receives payment from the customer, and then fills the order. Once the customer's order is filled, the employee takes the order of the next customer waiting for service. Assume that time between each customer's arrival is an exponential random variable with a mean of
1.35 minutes. Assume that the time for the employee to complete the customer's service is an exponential random variable with mean of 1 minute. Use the Burgerdome file to complete a simulation model for the waiting line at Burger Dome for a 14-hour workday. Note that you will need to use native Excel functionality to solve this problem because
the educational version of ASP has a limit of 100 random variables. Recall the formula 5LN(RAND())*(- m ) generates a value for an exponential random variable with mean m.
Using the summary statistics gathered at the bottom of the spreadsheet model, answer the following questions.
a. What is the average wait time experienced by a customer
b. What is the longest wait time experienced by a customer
c. What is the probability that a customer waits more than 2 minutes
d. Create a histogram depicting the wait time distribution.
e. By pressing the F9 key to generate a new set of simulation trials, one can observe the variability in the summary statistics from simulation to simulation. Typically, this variability can be reduced by increasing the number of trials. Why is this approach not appropriate for this problem
Unlock Deck
Unlock for access to all 26 flashcards in this deck.
Unlock Deck
k this deck
6
The management of Brinkley Corporation is interested in using simulation to estimate the profit per unit for a new product. The selling price for the product will be $45 per unit. Probability distributions for the purchase cost, the labor cost, and the transportation cost are estimated as follows:
a. Compute profit per unit for the base case, worst case, and best case.
b. Construct a simulation model to estimate the mean profit per unit.
c. Why is the simulation approach to risk analysis preferable to generating a variety of what-if scenarios
d. Management believes the project may not be sustainable if the profit per unit is less than $5. Use simulation to estimate the probability the profit per unit will be less than $5
a. Compute profit per unit for the base case, worst case, and best case.
b. Construct a simulation model to estimate the mean profit per unit.
c. Why is the simulation approach to risk analysis preferable to generating a variety of what-if scenarios
d. Management believes the project may not be sustainable if the profit per unit is less than $5. Use simulation to estimate the probability the profit per unit will be less than $5
Unlock Deck
Unlock for access to all 26 flashcards in this deck.
Unlock Deck
k this deck
7
One advantage of simulation is that a simulation model can be altered easily to reflect a change in the assumptions. Refer to the Burger Dome analysis in Problem 16. Assume that the service time is more accurately described by a normal distribution with a mean of 1 minute and a standard deviation of 0.2 minute. This distribution has less variability than the exponential distribution originally used. What is the impact of this change on the output measures
Unlock Deck
Unlock for access to all 26 flashcards in this deck.
Unlock Deck
k this deck
8
Using Analytic Solver Platform, develop a simulation model for the Sanotronics problem that was presented in Section 11.2 using native Excel functionality.
a. Obtain estimates for the mean profit, maximum profit, minimum profit, and standard deviation of profit.
b. What is your estimate of the probability of a loss
a. Obtain estimates for the mean profit, maximum profit, minimum profit, and standard deviation of profit.
b. What is your estimate of the probability of a loss
Unlock Deck
Unlock for access to all 26 flashcards in this deck.
Unlock Deck
k this deck
9
Refer to the Burger Dome analysis in Problem 16. Burger Dome wants to consider the effect of hiring a second employee to serve customers (in parallel with the first employee). Use the Burgerdometwoservers file to complete a simulation model that accounts for the second employee. ( hint: The time that a customer begins service will depend on the availability of employees.) What is the impact of this change on the output measures
Unlock Deck
Unlock for access to all 26 flashcards in this deck.
Unlock Deck
k this deck
10
Grear Tire Company has produced a new tire with an estimated mean lifetime mileage of 36,500 miles. Management also believes that the standard deviation is 5000 miles and that tire mileage is normally distributed. To promote the new tire, Great has offered to refund some money if the tire fails to reach 30,000 miles before the tire needs to be replaced. Specifically, for tires with a lifetime below 30,000 miles, Grear will refund a customer $1 per 100 miles short of 25,000.
a. For each tire sold, what is the expected cost of the promotion
b. What is the probability that Grear will refund more than $50 for a tire
c. What mileage should Grear set the promotion claim if it wants the expected cost to be $2
a. For each tire sold, what is the expected cost of the promotion
b. What is the probability that Grear will refund more than $50 for a tire
c. What mileage should Grear set the promotion claim if it wants the expected cost to be $2
Unlock Deck
Unlock for access to all 26 flashcards in this deck.
Unlock Deck
k this deck
11
Land Shark is investigating the sensitivity of its model to the assumptions it made on the random variables. In particular, Land Shark is interested in modeling how it generates its competitor's bid percentages.
a. Rather than generating a competitor's bid percentage by resampling from the 72 observed bid amounts, use ASP to fit an appropriate distribution using these 72 data points and rerun the simulation model. In addition to considering the fit of the distribution to the data, when selecting a distribution, keep in mind the range of bid amounts
that would be reasonable.
b. For Land Shark's bid amount of $1,250,000, how does the estimate of its probability of winning the auction differ from the model developed in Section 11.3
c. Comment on the implications of modeling random variables and which approach you feel is more appropriate in this case.
Unlock Deck
Unlock for access to all 26 flashcards in this deck.
Unlock Deck
k this deck
12
To generate leads for new business, Gustin Investment Services offers free financial planning seminars at major hotels in Southwest Florida. Gustin conducts seminars for groups of 25 individuals. Each seminar costs Gustin $3,500 and the average first-year commission for each new account opened is $5,000. Gustin estimates that for each individual attending the seminar, there is a 0.01 probability that he/she will open a new account.
a. Determine the equation for computing Gustin's profit per seminar, given values of the relevant parameters.
b. What type of random variable is the number of new accounts opened ( hint: Review Appendix 11.2 for descriptions of various types of probability distributions.)
c. Construct a spreadsheet simulation model to analyze the profitability of Gustin's seminars. Would you recommend that Gustin continue running the seminars
d. How large of an audience does Gustin need before a seminar's expected profit is greater than zero
Unlock Deck
Unlock for access to all 26 flashcards in this deck.
Unlock Deck
k this deck
13
For this problem, use the Land Shark simulation model from Problem 19 that fits a distribution to data in order to simulate competitor bid amounts.
a. Use ASP to apply simulation optimization to determine Land Shark's bid amount (rounded to the nearest $1,000) that maximizes its expected return. To reduce the time to solve this model, you may want to reduce the number of trials per simulation to 1000. What is the probability that Land Shark wins the auction
b. If Land Shark bids $5,000 more than the amount in part a, what is the likelihood that it wins the auction How much expected return does Land Shark sacrifice by increasing its bid in this manner
Unlock Deck
Unlock for access to all 26 flashcards in this deck.
Unlock Deck
k this deck
14
Baseball's World Series is a maximum of seven games, with the winner being the first team to win four games. Assume that the Atlanta Braves are playing the Minnesota Twins in the World Series and that the first two games are to be played in Atlanta, the next three games at the Twins' ballpark, and the last two games, if necessary, back in Atlanta. Taking into account the projected starting pitchers for each game and the home field advantage, the probabilities of Atlanta winning each game are as follows:
a. Set up a spreadsheet simulation model in which whether Atlanta wins each game is a random variable.
b. What is the probability that the Atlanta Braves win the World Series
c. What is the average number of games played regardless of winner
a. Set up a spreadsheet simulation model in which whether Atlanta wins each game is a random variable.
b. What is the probability that the Atlanta Braves win the World Series
c. What is the average number of games played regardless of winner
Unlock Deck
Unlock for access to all 26 flashcards in this deck.
Unlock Deck
k this deck
15
Orange Tech (OT) is a software company providing a suite of programs that are essential to everyday business computing. OT has just enhanced its software and released a new version of its programs. For financial planning purposes, OT needs to forecast its revenue over the next few years. To begin this analysis, OT is considering one of its largest customers. This customer always eventually upgrades to the newest software version, but the number of years that pass before the customer purchases an upgrade varies. Up to the year that the customer actually upgrades, assume there is a 0.50 probability that the customer upgrades in any particular year. In other words, the upgrade year of the customer is a random variable. For guidance on an appropriate way to model upgrade year, refer to Appendix 11.1. Furthermore, the revenue that OT earns from the customer's upgrade also varies (depending on the number of programs the customer decides to upgrade). Assume that the revenue from an upgrade obeys a normal distribution with a mean of $100,000 and a standard deviation of $25,000. Using the template in the file orangetech , complete a simulation model that analyzes the net present value of the revenue from the customer upgrade. Use an annual discount rate of 10 percent.
a. What is the average net present value that OT earns from this customer
b. What is the standard deviation of net present value How does this compare to the standard deviation of the revenue Explain
a. What is the average net present value that OT earns from this customer
b. What is the standard deviation of net present value How does this compare to the standard deviation of the revenue Explain
Unlock Deck
Unlock for access to all 26 flashcards in this deck.
Unlock Deck
k this deck
16
The price of a share of a particular stock listed on the New York Stock Exchange is currently $39. The following probability distribution shows how the price per share is expected to change over a three-month period:
a. Construct a spreadsheet simulation model that computes the value of the stock price in 3 months, 6 months, 9 months, and 12 months under the assumption that the change in stock price over any 3-month period is independent of the change in stock price over any other 3-month period.
b. With the current price of $39 per share, simulate the price per share for the next four 3-month periods. What is the average stock price per share in 12 months What is the standard deviation of the stock price in 12 months c. Based on the model assumptions, what are the lowest and highest possible prices for this
stock in 12 months Based on your knowledge of the stock market, how valid do you think this is Propose an alternative to modeling how stock prices evolve over 3-month periods.
a. Construct a spreadsheet simulation model that computes the value of the stock price in 3 months, 6 months, 9 months, and 12 months under the assumption that the change in stock price over any 3-month period is independent of the change in stock price over any other 3-month period.
b. With the current price of $39 per share, simulate the price per share for the next four 3-month periods. What is the average stock price per share in 12 months What is the standard deviation of the stock price in 12 months c. Based on the model assumptions, what are the lowest and highest possible prices for this
stock in 12 months Based on your knowledge of the stock market, how valid do you think this is Propose an alternative to modeling how stock prices evolve over 3-month periods.
Unlock Deck
Unlock for access to all 26 flashcards in this deck.
Unlock Deck
k this deck
17
To boost holiday sales, Ginsberg jewelry store is advertising the following promotion: "If more than 7 inches of snow fall in the first 7 days of the year (january 1 through january 7), purchases made between Thanksgiving and Christmas are free!" manager believes that the total holiday sales between Thanksgiving and Christmas could range anywhere between $200,000 and $400,000 but is unsure of anything more specific. Ginsberg has collected data on snowfall from December 17 to january 16 for the past several winters.
a. Construct a simulation model to assess potential refund amounts so that Ginsberg can evaluate the option of purchasing an insurance policy to cover potential losses. Be sure to account for the correlation in snowfall on consecutive days. Refer to Appendix 11.2 for instructions on how to incorporate correlation using ASP. To aid the computation of correlation in consecutive days, the data in the file ginsberg has
been organized so that one column contains the snowfall amount on the day corresponding to the Day column and another column contains snowfall amount on the following day. You may safely ignore any correlation between every second day, every third day, and so on.
b. What is the probability that Ginsberg will have to refund sales
c. What is the expected refund Why is this a poor measure to use to assess risk
d. What is the expected refund if snowfall exceeds 7 inches
Unlock Deck
Unlock for access to all 26 flashcards in this deck.
Unlock Deck
k this deck
18
The Iowa Energy are scheduled to play against the Maine Red Claws in an upcoming game in the National Basketball Association Developmental League (NBA-DL). Because a player in the NBA-DL is still developing his skills, the number of points he scores in a game can vary. Assume that each player's point production can be represented as an integer uniform variable with the ranges provided in the following table:
a. Develop a spreadsheet model that simulates the points scored by each team.
b. What are the average and standard deviation of points scored by the Iowa Energy What is the shape of the distribution of points scored by the Iowa Energy
c. What is the average and standard deviation of points scored by the Maine Red Claws What is the shape of the distribution of points scored by the Maine Red Claws
d. Let Point Differential 5 Iowa Energy points - Maine Red Claw points. What is the average point differential between the Iowa Energy and Maine Red Claws What is the standard deviation in the point differential What is the shape of the point differential distribution
e. What is the probability that the Iowa Energy scores more points than the Maine Red Claws
f. The coach of the Iowa Energy feels that they are the underdog and is considering a riskier game strategy. The effect of this strategy is that the range of each Energy player's point production increases symmetrically so that the new range is [0, original upper bound 1 original lower bound]. For example, Energy player 1's range with the risky strategy is [0,25]. How does the new strategy affect the average and standard deviation of the Energy point total How does that affect the probability of the Iowa Energy scoring more points that the Maine Red Claws
Unlock Deck
Unlock for access to all 26 flashcards in this deck.
Unlock Deck
k this deck
19
A creative entrepreneur has created a novelty soap called jackpot. Inside each bar of jackpot soap is a rolled-up bill of U.S. currency. There are 1000 bars of soap in the initial offering of the soap. Although the denomination of the bill inside a bar of soap is unknown, the distribution of bills in these first 1000 bars is given in the following table:
How many bars of soap does a customer have to buy so that, on average, she has purchased two containing a $50 or $100 bill ( hint: Use the hypergeometric distribution in ASP to answer this question.)
How many bars of soap does a customer have to buy so that, on average, she has purchased two containing a $50 or $100 bill ( hint: Use the hypergeometric distribution in ASP to answer this question.)
Unlock Deck
Unlock for access to all 26 flashcards in this deck.
Unlock Deck
k this deck
20
A project has four activities (A, B, C, and D) that must be performed sequentially. The probability distributions for the time required to complete each of the activities are as follows:
a. Construct a spreadsheet simulation model to estimate the average length of the project and the standard deviation of the project length.
b. What is the estimated probability that the project will be completed in 35 weeks or less
a. Construct a spreadsheet simulation model to estimate the average length of the project and the standard deviation of the project length.
b. What is the estimated probability that the project will be completed in 35 weeks or less
Unlock Deck
Unlock for access to all 26 flashcards in this deck.
Unlock Deck
k this deck
21
Refer to the jackpot soap scenario in Problem 23. After the sale of the original 1000 bars of soap, jackpot soap went viral, and the soap has become wildly popular. Production of the soap has been ramped up so that now millions of bars have been produced. However, the distribution of the bills in the soap obeys the same distribution as outlined in Problem 23. On average, how many bars of soap will a customer have to buy before purchasing three bars of soap each containing a bill of at least $20 value Use the negative binomial distribution in ASP to answer this question.
Unlock Deck
Unlock for access to all 26 flashcards in this deck.
Unlock Deck
k this deck
22
Over the past year, a financial analyst has tracked the daily change in the price per share of common stock for a major oil company. Using ASP, develop a simulation model to analyze the stock price at the end of the next quarter. Assume 63 trading days and a current price per share of $51.60.
a. Using the data in the datatofit worksheet of the dailystock file, fit a distribution to represent the daily change in stock price. Assume that the each day's change in stock price is independent of every other day's change in stock price. You can justify this assumption by estimating the correlation of consecutive days' change in stock price using the command CORREL(B3:B313, B4:B314) and observing that this quantity is relatively small.
b. What is the expected price per share at the end of the quarter
c. What is the probability that the stock price will be below $26.55
d. The WhatReallyhappened worksheet of dailystock file contains the 63 values of the daily change in stock price that actually occurred during the quarter. (You can plug these 63 values into your model to confirm the calculations.) What does this reveal about the limitations of simulation modeling
e. Based on the observation that many distributions underestimate the possibility of extreme values, some experts suggest the use of a "heavy-tailed" distribution to model the change in stock price. The Cauchy distribution is one such heavy-tailed distribution in which the likelihood of extreme daily changes in stock price are much more likely
than with other distributions (such as the normal distribution). Fit a Cauchy distribution to the data in the datatofit worksheet and observe the impact on the analysis. hint: To avoid unrealistic swings in stock price, truncate the possible values from the Cauchy distribution by setting the lower cutoff and upper cutoff values to 21 and 1, respectively.
Unlock Deck
Unlock for access to all 26 flashcards in this deck.
Unlock Deck
k this deck
23
Press Teag Worldwide (PTW) has investments around the world that generate revenue in the British pound, the New Zealand kiwi, and the japanese yen. At the end of each quarter, PTW converts the revenue from these three international operations back into U.S. dollars, exposing PTW to exchange rate risk. The current exchange rates are US$1.60 per £1, US$0.82 per NZD$1, and US$0.01 per ¥1. PTW wants to construct a simulation model to assess its vulnerability to uncertain exchange rate fluctuations. The quarterly revenues generated in British pounds, New Zealand kiwis, and japanese yen are £100,000, NZD$250,000, and ¥10,000,000, respectively.
a. If exchange rates stay at their current values, what is the total quarterly revenue in U.S. dollars
b. Following the instructions in Appendix 11.1, model the uncertainty in the quarterly changes of the exchange rates between U.S. dollars and British pounds, New Zealand kiwis, and japanese yen using a SLURP.
c. Use your simulation model to estimate the average total quarterly revenue in U.S. dollars. What is the probability that the total quarterly revenue will be lower than the answer in part a
Unlock Deck
Unlock for access to all 26 flashcards in this deck.
Unlock Deck
k this deck
24
In preparing for the upcoming holiday season, Fresh Toy Company (FTC) designed a new doll called The Dougie that teaches children how to dance. The fixed cost to produce the doll is $100,000. The variable cost, which includes material, labor, and shipping costs, is $34 per doll. During the holiday selling season, FTC will sell the dolls for $42 each. If
FTC overproduces the dolls, the excess dolls will be sold in january through a distributor who has agreed to pay FTC $10 per doll. Demand for new toys during the holiday selling season is extremely uncertain. Forecasts are for expected sales of 60,000 dolls with a standard deviation of 15,000. The normal probability distribution is assumed to be a good description of the demand. FTC has tentatively decided to produce 60,000 units (the same as average demand), but it wants to conduct an analysis regarding this production quantity before finalizing the decision.
a. Create a what-if spreadsheet model using formula that relate the values of production quantity, demand, sales, revenue from sales, amount of surplus, revenue from sales of surplus, total cost, and net profit. What is the profit corresponding to average demand (60,000 units)
b. Modeling demand as a normal random variable with a mean of 60,000 and a standard deviation of 15,000, simulate the sales of The Dougie doll using a production quantity of 60,000 units. What is the estimate of the average profit associated with the production quantity of 60,000 dolls How does this compare to the profit corresponding to
the average demand (as computed in part a)
c. Before making a final decision on the production quantity, management wants an analysis of a more aggressive 70,000-unit production quantity and a more conservative 50,000-unit production quantity. Run your simulation with these two production quantities. What is the mean profit associated with each
d. Besides mean profit, what other factors should FTC consider in determining a production quantity Compare the three production quantities (50,000, 60,000. and 70,000) using all these factors. What trade-offs occur What is your recommendation
Unlock Deck
Unlock for access to all 26 flashcards in this deck.
Unlock Deck
k this deck
25
South Central Airlines (SCA) operates a commuter flight between Atlanta and Charlotte. The regional jet holds 50 passengers and currently SCA books only up to 50 reservations. Past data shows that SCA always sells all 50 reservations but that, on average, two passengers do not show up. As a result, with 50 reservations, the flight is often being flown with
empty seats. To capture additional profit, SCA is considering an overbooking strategy in which they would accept 52 reservations even though the airplane holds only 50 passengers. SCA believes that it will be able to always book all 52 reservations. The probability
distribution for the number of passengers showing up when 52 reservations are accepted is estimated as follows:
SCA receives a marginal profit of $100 for each passenger who books a reservation (regardless whether they show up). The airline will also incur a cost for any passenger denied seating on the flight. This cost covers added expenses of rescheduling the passenger as well as loss of goodwill, estimated to be $150 per passenger. Develop a spreadsheet
simulation model for this overbooking system. Simulate the number of passengers showing up for a flight.
a. What is the average net profit for each flight with the overbooking strategy
b. What is the probability that the net profit with the overbooking strategy will be less than the net profit without overbooking (50*$100 5 $5,000)
c. Explain how your simulation model could be used to evaluate other overbooking levels such as 51, 53, and 54 and for recommending a best overbooking strategy
Unlock Deck
Unlock for access to all 26 flashcards in this deck.
Unlock Deck
k this deck
26
The wedding date for a couple is quickly approaching, and the wedding planner must provide the caterer an estimate of how many people will attend the reception so thatthe appropriate quantity of food is prepared for the buffet. The following table contains information on the number of RSVP'ed guests for the 145 invitations. Unfortunately, the number of guests does not always correspond to the number of RSVP'ed guests. Based on her experience, the wedding planner knows it is extremely rare for guests to attend a wedding if they affirmed that they will not be attending. Therefore, the wedding planner will assume that no one from these 50 invitations will attend. The wedding planner estimates that the each of the 25 guests planning to come solo has a 75 percent chance of attending alone, a 20 percent chance of not attending, and a 5 percent chance of bringing a companion. For each of the 60 RSVPs who plan to bring a companion, there is a 90 percent chance that she or he will attend with a companion, a 5 percent chance of attending solo, and a 5 percent chance of not attending at all. For the 10 people who have not responded, the wedding planner assumes that there is an 80 percent chance that each will not attend, a 15 percent chance they will attend alone, and a 5 percent chance they will attend with a companion.
a. Assist the wedding planner by constructing a spreadsheet simulation model to determine the expected number of guests who will attend the reception.
b. To be accommodating hosts, the couple has instructed the wedding planner to use the Monte Carlo simulation model to determine X , the minimum number of guests for which the caterer should prepare the meal, so that there is at least a 90 percent chance that the actual attendance is less than or equal to X. What is the best estimate for the value of X
a. Assist the wedding planner by constructing a spreadsheet simulation model to determine the expected number of guests who will attend the reception.
b. To be accommodating hosts, the couple has instructed the wedding planner to use the Monte Carlo simulation model to determine X , the minimum number of guests for which the caterer should prepare the meal, so that there is at least a 90 percent chance that the actual attendance is less than or equal to X. What is the best estimate for the value of X
Unlock Deck
Unlock for access to all 26 flashcards in this deck.
Unlock Deck
k this deck
Unlock Deck
Unlock for access to all 26 flashcards in this deck.


