Deck 2: Marketing Metrics and Marketing Profitability
Full screen (f)
Question
Question
Question
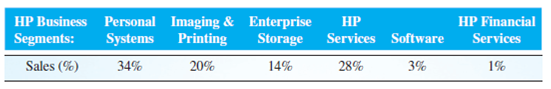
Shown here are HP's six major business segments and their percentages of sales for 2009. How would a marketing profitability portfolio (similar to Figure 2-17) help the HP chief marketing officer communicate to senior management the relative performance of each business segment when compared to the HP average?
Question
Question
Question
Question
Question
Question
Question
Question
Question
Question
Question
Question
Question
Question
Question
Question

Unlock Deck
Sign up to unlock the cards in this deck!
Unlock Deck
Unlock Deck
1/19
Play
Full screen (f)
Deck 2: Marketing Metrics and Marketing Profitability
1
How would Procter Gamble use a product-level measure of net marketing contribution for the Tide brand in the U.S. market?
A marketing profitability metric forms a significant step towards communicating the contribution of any product or service offering towards the company's business and profits.
Net Marketing contribution displays the profitability of the business post the marketing and sales expenses, which gives a true picture of the contribution to the overall profitability. Therefore, it is an indicator of the returns over the investment made towards the particular offering. Also, this metric should serve as a strategic tool; enabling the determination of the marketing profitability of the marketing strategy and report the same as a measure of financial profitability.
P G can make use of this metric to improve the returns on the Tide brand and further improve the returns by modifying the marketing expenses. This would help improve the market share and also boos the overall profitability of the company.
2
How could Apple's chief marketing officer use Figure 2-23 to explain to Apple's CFO the value of marketing ROS and marketing ROI as corporate performance metrics?
The Marketing ROS and ROI ratios help a company to compare its marketing efficiency with that of the competitors. These ratios give a good indication of the relationship between the marketing profitability and the operating income of any company.
Figure 2-23 gives an idea that there is a direct relationship between the Marketing ROI and ROS and the Operating income of a company. Thus, an improvement in the marketing metrics should increase the overall profitability of the company. The figure shows that Apple has better operating income than the competitors.
Thus, the point from the Chief Marketing Officer should that the marketing metrics help in directly improving the overall profitability of the company and that would be an important point for the Chief Financial Officer.
3
Shown here are HP's six major business segments and their percentages of sales for 2009. How would a marketing profitability portfolio (similar to Figure 2-17) help the HP chief marketing officer communicate to senior management the relative performance of each business segment when compared to the HP average?
Marketing Profitability Portfolio
A marketing profitability metric is a prime step towards communicating the contribution and profitability of the business unit and the company. Two profitability metrics that serve the function include marketing ROS and marketing ROI. They give a broad picture of the contribution of each business division or unit.
A marketing profitability portfolio helps project the products or business units that provide the best returns over sales and investment and thereby contributing the maximum towards the company profitability. The marketing ratios can be compared to the company average and ratios of competitive to bring out a conclusion of the profitability of the particular product.
It would give an idea regarding which particular division can be more focused and improved upon to increase the overall company profitability and which of the divisions can be less concentrated upon, as the company is not attaining required marketing profitability over the same.
4
How could marketing metrics help General Motors turn around its decline in sales and profits?
Unlock Deck
Unlock for access to all 19 flashcards in this deck.
Unlock Deck
k this deck
5
In 2009, Netflix had a marketing ROI of 178 percent. What does this mean in terms of the company's investment in marketing and sales?
Unlock Deck
Unlock for access to all 19 flashcards in this deck.
Unlock Deck
k this deck
6
The four interactive marketing performance tools and application exercises outlined here will strengthen your understanding of the profit impact of managing marketing profitability. To access the tools, go to www.MBMBEST.com. You may enter the data presented in each exercise to obtain the answers to the questions. You may also enter other data to see the results, and you may save your work. The figure numbers in parentheses are related examples in Chapter 2, but the lettered instructions pertain to the online exercises.
Company-Level Net Marketing Contribution (Figure 2-15)
A. Evaluate the profit impact of eliminating the casual shorts and knitted sweaters product lines.
B. What would be the profit impact of increasing market share from 2 to 3 percent for the casual shorts product line if marketing and sales expenses were doubled (from $1.5 million to $3 million)?
Unlock Deck
Unlock for access to all 19 flashcards in this deck.
Unlock Deck
k this deck
7
For any airline of interest, compute its 2010 marketing ROS, marketing ROI, and operating income (as a percentage of sales) using the airline's 2010 income statement in its annual report. Assume marketing and sales expenses are 75 percent of SGA expenses. Then plot the results in Figure 2-24 and interpret the airline's performance.
Unlock Deck
Unlock for access to all 19 flashcards in this deck.
Unlock Deck
k this deck
8
If a company dominates a market the way Microsoft, Google, and Intel dominate their markets, why should that company bother to track marketing metrics?
Unlock Deck
Unlock for access to all 19 flashcards in this deck.
Unlock Deck
k this deck
9
Why would companies that sell energy and raw materials, such as ExxonMobil and Alcoa, have very large marketing ROIs?
Unlock Deck
Unlock for access to all 19 flashcards in this deck.
Unlock Deck
k this deck
10
The four interactive marketing performance tools and application exercises outlined here will strengthen your understanding of the profit impact of managing marketing profitability. To access the tools, go to www.MBMBEST.com. You may enter the data presented in each exercise to obtain the answers to the questions. You may also enter other data to see the results, and you may save your work. The figure numbers in parentheses are related examples in Chapter 2, but the lettered instructions pertain to the online exercises.
Market-Level NMC, Marketing ROS, and Marketing ROI (Figure 2-18)
A. Evaluate the profit impact of exiting the fashion-buyer segment.
B. In the fashion-buyer segment, how much market share would the business have to obtain to keep the same level of marketing profits if the business doubled marketing and sales expenses in that segment?
Unlock Deck
Unlock for access to all 19 flashcards in this deck.
Unlock Deck
k this deck
11
How would marketing metrics help a company like McDonald's better manage its profitability?
Unlock Deck
Unlock for access to all 19 flashcards in this deck.
Unlock Deck
k this deck
12
The four interactive marketing performance tools and application exercises outlined here will strengthen your understanding of the profit impact of managing marketing profitability. To access the tools, go to www.MBMBEST.com. You may enter the data presented in each exercise to obtain the answers to the questions. You may also enter other data to see the results, and you may save your work. The figure numbers in parentheses are related examples in Chapter 2, but the lettered instructions pertain to the online exercises.
Company Net Marketing Contribution and Marketing ROI (Figure 2-13)
A. For a company of interest, obtain the required input from a company annual report. Evaluate the company's marketing profitability and how it contributes to net profit before taxes.
B. How would marketing profits and net profit change if sales increase by 25 percent?
C. Evaluate the profit impact of a strategy in which the percent margin is increased by 5 points and marketing and sales expenses are increased by 2 percentage points.
Unlock Deck
Unlock for access to all 19 flashcards in this deck.
Unlock Deck
k this deck
13
How would Toyota use forward-looking marketing metrics to better understand future sales and profits in the U.S. market?
Unlock Deck
Unlock for access to all 19 flashcards in this deck.
Unlock Deck
k this deck
14
The four interactive marketing performance tools and application exercises outlined here will strengthen your understanding of the profit impact of managing marketing profitability. To access the tools, go to www.MBMBEST.com. You may enter the data presented in each exercise to obtain the answers to the questions. You may also enter other data to see the results, and you may save your work. The figure numbers in parentheses are related examples in Chapter 2, but the lettered instructions pertain to the online exercises.
Benchmarking Marketing ROI versus Operating Income as a Percentage of Sales (Figure 2-23)
A. For a company of interest, go online and obtain the operating income and the data needed to estimate the company's marketing ROI. You will probably need to use 75 percent of SGA expenses as your estimate of marketing and sales expenses, because companies rarely report marketing and sales expenses separately in their financial statements.
B. Next, collect the same data for a major competitor. How does the first company compare with this competitor in terms of the marketing profitability metrics (marketing ROS and marketing ROI) and operating income as a percentage of sales? How would these results compare with the average performance shown in Figure 2-24?
Unlock Deck
Unlock for access to all 19 flashcards in this deck.
Unlock Deck
k this deck
15
How could a Wall Street analyst benefit from access to a company's marketing metrics for a company like BioTronics?
Unlock Deck
Unlock for access to all 19 flashcards in this deck.
Unlock Deck
k this deck
16
Why are most financial metrics backward-looking metrics?
Unlock Deck
Unlock for access to all 19 flashcards in this deck.
Unlock Deck
k this deck
17
Why would chief financial officers and senior management be comfortable with net marketing contribution as a financial measure of marketing profitability?
Unlock Deck
Unlock for access to all 19 flashcards in this deck.
Unlock Deck
k this deck
18
Compute Apple's net marketing contribution for the company's last fiscal year and add it to Figure 2-22. Then explain how this level of net marketing contribution could be used in Apple's marketing plans to project Apple's operating income for the current year.
Unlock Deck
Unlock for access to all 19 flashcards in this deck.
Unlock Deck
k this deck
19
How would Vizio use net marketing contribution at the market level to increase its knowledge of the U.S. flat-panel television market?
Unlock Deck
Unlock for access to all 19 flashcards in this deck.
Unlock Deck
k this deck
Unlock Deck
Unlock for access to all 19 flashcards in this deck.


