Deck 6: Heads or Tails: the Role of Chance
Full screen (f)
Question
Question
Question
Question
Question
You wish to conduct a case‐control study investigating the association between chewing betel quid (from the areca nut) and oral cancer in Kerala.You estimate that
The prevalence of betel quid use in the general population is 20% and based on
Previous studies you expect an odds ratio (OR) for oral cancer of OR=2.0 associated
With betel quid chewing compared to no betel quid chewing.Using the table below,
How large a sample (cases and controls) would you want for this study?
Table: Number of cases required for a case‐control study to detect a statistically
Significant association with varying levels of exposure prevalence1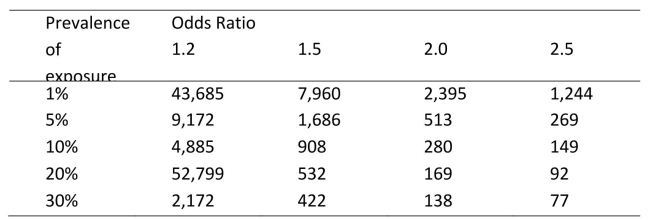
 Number of cases required (assuming 1 control per case), to achieve 80% power at
  =
=
0)05.
A)169
B)338
C)513
D)1026
The prevalence of betel quid use in the general population is 20% and based on
Previous studies you expect an odds ratio (OR) for oral cancer of OR=2.0 associated
With betel quid chewing compared to no betel quid chewing.Using the table below,
How large a sample (cases and controls) would you want for this study?
Table: Number of cases required for a case‐control study to detect a statistically
Significant association with varying levels of exposure prevalence1
Number of cases required (assuming 1 control per case), to achieve 80% power at =0)05.
A)169
B)338
C)513
D)1026
Question
Question
Question
Question
Question

Unlock Deck
Sign up to unlock the cards in this deck!
Unlock Deck
Unlock Deck
1/10
Play
Full screen (f)
Deck 6: Heads or Tails: the Role of Chance
1
The data from the studies in the figure come from randomised trials of drug treatments.Which RR estimate(s) is/are most likely to be clinically significant? (Select
All that apply)
A)Study 1
B)Study 2
C)Study 3
D)Study 4
E)Study 5
All that apply)
A)Study 1
B)Study 2
C)Study 3
D)Study 4
E)Study 5
Study 3
Study 4
Study 4
2
A large study sample size is important because it:
A)Reduces selection bias in the study
B)Increases study precision
C)Reduces confounding in the study
D)Increases study accuracy
E)None of the above
A)Reduces selection bias in the study
B)Increases study precision
C)Reduces confounding in the study
D)Increases study accuracy
E)None of the above
Increases study precision
3
A study found that the relative risk (RR) for the association between air pollution and asthma was RR=1.5, 95%CI (1.2-1.9) with a P value of 0.001.The likelihood that this
Association occurred by chance is:
A)1 in 20
B)1 in 100
C)1 in 1000
D)None of the above
Association occurred by chance is:
A)1 in 20
B)1 in 100
C)1 in 1000
D)None of the above
1 in 1000
4
Which of the following relative risks (and 95% confidence intervals) is the most precise?
A)1.5 (1.2-1.9)
B)2.1 (0.9-5.3)
C)1.1 (1.0-1.2)
D)0.6 (0.3-0.9)
A)1.5 (1.2-1.9)
B)2.1 (0.9-5.3)
C)1.1 (1.0-1.2)
D)0.6 (0.3-0.9)
Unlock Deck
Unlock for access to all 10 flashcards in this deck.
Unlock Deck
k this deck
5
You wish to conduct a case‐control study investigating the association between chewing betel quid (from the areca nut) and oral cancer in Kerala.You estimate that
The prevalence of betel quid use in the general population is 20% and based on
Previous studies you expect an odds ratio (OR) for oral cancer of OR=2.0 associated
With betel quid chewing compared to no betel quid chewing.Using the table below,
How large a sample (cases and controls) would you want for this study?
Table: Number of cases required for a case‐control study to detect a statistically
Significant association with varying levels of exposure prevalence1 Number of cases required (assuming 1 control per case), to achieve 80% power at =
0)05.
A)169
B)338
C)513
D)1026
The prevalence of betel quid use in the general population is 20% and based on
Previous studies you expect an odds ratio (OR) for oral cancer of OR=2.0 associated
With betel quid chewing compared to no betel quid chewing.Using the table below,
How large a sample (cases and controls) would you want for this study?
Table: Number of cases required for a case‐control study to detect a statistically
Significant association with varying levels of exposure prevalence1
Number of cases required (assuming 1 control per case), to achieve 80% power at =0)05.
A)169
B)338
C)513
D)1026
Unlock Deck
Unlock for access to all 10 flashcards in this deck.
Unlock Deck
k this deck
6
Which relative risk (RR) estimate(s) in the figure above is/are statistically significant? (Select all that apply)
A)Study 1
B)Study 2
C)Study 3
D)Study 4
E)Study 5
A)Study 1
B)Study 2
C)Study 3
D)Study 4
E)Study 5
Unlock Deck
Unlock for access to all 10 flashcards in this deck.
Unlock Deck
k this deck
7
A study that is able to detect a relative risk of 2.0 between an exposure and an outcome 4 times out of 5 has:
A)Power of 80%
B)An alpha level of 0.05
C)A high probability of Type I error
D)A high probability of Type II error
E)None of the above
A)Power of 80%
B)An alpha level of 0.05
C)A high probability of Type I error
D)A high probability of Type II error
E)None of the above
Unlock Deck
Unlock for access to all 10 flashcards in this deck.
Unlock Deck
k this deck
8
Which RR estimate could be considered both statistically and clinically significant?
A)Study 1
B)Study 2
C)Study 3
D)Study 4
E)Study 5
A)Study 1
B)Study 2
C)Study 3
D)Study 4
E)Study 5
Unlock Deck
Unlock for access to all 10 flashcards in this deck.
Unlock Deck
k this deck
9
When we conduct an hypothesis test we:
A)Assess the probability that the null hypothesis 'there is no association between exposure and outcome' is true
B)Assess the probability that the null hypothesis 'there is no association between exposure and outcome' is false
C)Assess the probability that the alternative hypothesis 'there is an association between exposure and outcome' is true
D)Assess the probability that the alternative hypothesis 'there is an association between exposure and outcome' is false
Unlock Deck
Unlock for access to all 10 flashcards in this deck.
Unlock Deck
k this deck
10
Which of the following statements best describes the advantages of confidence intervals over p‐values?
A)Confidence intervals provide an estimate of the likelihood that the association occurred by chance
B)Confidence intervals provide information about the precision of the measure of association
C)Confidence intervals provide an estimate of statistical significance
D)All of the above
E)None of the above
Unlock Deck
Unlock for access to all 10 flashcards in this deck.
Unlock Deck
k this deck
Unlock Deck
Unlock for access to all 10 flashcards in this deck.


