Deck 10: Two-Sample Tests
Full screen (f)
Question
SCENARIO 10-1 Are Japanese managers more motivated than American managers? A randomly selected group of each were administered the Sarnoff Survey of Attitudes Toward Life (SSATL), which measures motivation for upward mobility.The SSATL scores are summarized below. 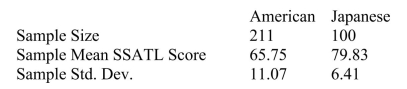
Referring to Scenario 10-1, find the p-value if we assume that the alternative hypothesis was a two-tail test.
A)Smaller than 0.01
B)Between 0.01 and 0.05
C)Between 0.05 and 0.10
D)Greater than 0.10
Referring to Scenario 10-1, find the p-value if we assume that the alternative hypothesis was a two-tail test.
A)Smaller than 0.01
B)Between 0.01 and 0.05
C)Between 0.05 and 0.10
D)Greater than 0.10
Question
Question
In testing for differences between the means of two independent populations, the null hypothesis is:
A)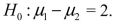
B)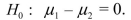
C)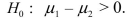
D)
A)
B)
C)
D)
Question
Given the following information, calculate the degrees of freedom that should be used in the pooled-variance t test. 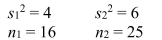
A)df = 41
B)df = 39
C)df = 16
D)df = 25
A)df = 41
B)df = 39
C)df = 16
D)df = 25
Question
Question
Question
SCENARIO 10-2 A researcher randomly sampled 30 graduates of an MBA program and recorded data concerning their starting salaries.Of primary interest to the researcher was the effect of gender on starting salaries.The result of the pooled-variance t-test of the mean salaries of the females (Population 1)and males (Population 2)in the sample is given below. 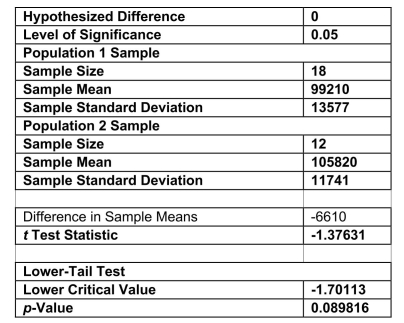
Referring to Scenario 10-2, the researcher was attempting to show statistically that the female MBA graduates have a significantly lower mean starting salary than the male MBA graduates.Which of the following is an appropriate alternative hypothesis?
A)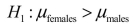
B)
C)
D)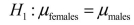
Referring to Scenario 10-2, the researcher was attempting to show statistically that the female MBA graduates have a significantly lower mean starting salary than the male MBA graduates.Which of the following is an appropriate alternative hypothesis?
A)
B)
C)
D)
Question
Question
Question
A researcher randomly sampled 30 graduates of an MBA program and recorded data concerning
their starting salaries. Of primary interest to the researcher was the effect of gender on starting
salaries. The result of the pooled-variance t-test of the mean salaries of the females (Population
1) and males (Population 2) in the sample is given below.
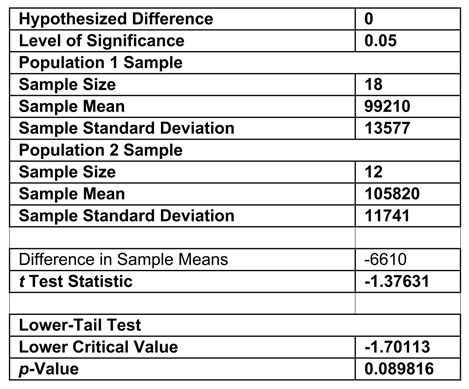
Referring to Scenario 10-2, the researcher was attempting to show statistically that the female MBA graduates have a significantly lower mean starting salary than the male MBA graduates.The proper conclusion for this test is:
A)At the = 0.10 level, there is sufficient evidence to indicate a difference in the mean starting salaries of male and female MBA graduates.
B)At the = 0.10 level, there is sufficient evidence to indicate that females have a lower mean starting salary than male MBA graduates.
C)At the = 0.10 level, there is sufficient evidence to indicate that females have a higher mean starting salary than male MBA graduates.
D)At the = 0.10 level, there is insufficient evidence to indicate any difference in the mean starting salaries of male and female MBA graduates.
their starting salaries. Of primary interest to the researcher was the effect of gender on starting
salaries. The result of the pooled-variance t-test of the mean salaries of the females (Population
1) and males (Population 2) in the sample is given below.
Referring to Scenario 10-2, the researcher was attempting to show statistically that the female MBA graduates have a significantly lower mean starting salary than the male MBA graduates.The proper conclusion for this test is:
A)At the
= 0.10 level, there is sufficient evidence to indicate a difference in the mean starting salaries of male and female MBA graduates.B)At the
= 0.10 level, there is sufficient evidence to indicate that females have a lower mean starting salary than male MBA graduates.C)At the
= 0.10 level, there is sufficient evidence to indicate that females have a higher mean starting salary than male MBA graduates.D)At the
= 0.10 level, there is insufficient evidence to indicate any difference in the mean starting salaries of male and female MBA graduates. Question
Question
Given the following information, calculate  the pooled sample variance that should be used in the pooled-variance t test.
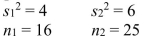
A) = 6.00
B) = 5.00
C) = 5.23
D) = 4.00
the pooled sample variance that should be used in the pooled-variance t test. A)
= 6.00B)
= 5.00C)
= 5.23D)
= 4.00 Question
Question
SCENARIO 10-1 Are Japanese managers more motivated than American managers? A randomly selected group of each were administered the Sarnoff Survey of Attitudes Toward Life (SSATL), which measures motivation for upward mobility.The SSATL scores are summarized below.
Referring to Scenario 10-1, what is the value of the test statistic?
A)-14.08
B)-11.8092
C)-1.9677
D)96.4471
Referring to Scenario 10-1, what is the value of the test statistic?
A)-14.08
B)-11.8092
C)-1.9677
D)96.4471
Question
Question
Question
A researcher randomly sampled 30 graduates of an MBA program and recorded data concerning
their starting salaries. Of primary interest to the researcher was the effect of gender on starting
salaries. The result of the pooled-variance t-test of the mean salaries of the females (Population
1) and males (Population 2) in the sample is given below.
Referring to Scenario 10-2, the researcher was attempting to show statistically that the female MBA graduates have a significantly lower mean starting salary than the male MBA graduates.What assumptions were necessary to conduct this hypothesis test?
A)Both populations of salaries (male and female)must have approximate normal distributions.
B)The population variances are approximately equal.
C)The samples were randomly and independently selected.
D)All of the above assumptions were necessary.
Question
Question
SCENARIO 10-1 Are Japanese managers more motivated than American managers? A randomly selected group of each were administered the Sarnoff Survey of Attitudes Toward Life (SSATL), which measures motivation for upward mobility.The SSATL scores are summarized below.
Referring to Scenario 10-1, give the null and alternative hypotheses to determine if the mean SSATL score of Japanese managers differs from the mean SSATL score of American managers.
A)
B)
C)
D)
Referring to Scenario 10-1, give the null and alternative hypotheses to determine if the mean SSATL score of Japanese managers differs from the mean SSATL score of American managers.
A)
B)
C)
D)
Question
SCENARIO 10-1 Are Japanese managers more motivated than American managers? A randomly selected group of each were administered the Sarnoff Survey of Attitudes Toward Life (SSATL), which measures motivation for upward mobility.The SSATL scores are summarized below.
Referring to Scenario 10-1, judging from the way the data were collected, which test would likely be most appropriate to employ?
A)Paired t test
B)Pooled-variance t test for the difference between two means
C)F test for the ratio of two variances
D)Z test for the difference between two proportions
Referring to Scenario 10-1, judging from the way the data were collected, which test would likely be most appropriate to employ?
A)Paired t test
B)Pooled-variance t test for the difference between two means
C)F test for the ratio of two variances
D)Z test for the difference between two proportions
Question
SCENARIO 10-3 A real estate company is interested in testing whether the mean time that families in Gotham have been living in their current homes is less than families in Metropolis.Assume that the two population variances are equal.A random sample of 100 families from Gotham and a random sample of 150 families in Metropolis yield the following data on length of residence in current homes. 
Referring to Scenario 10-3, what is(are)the critical value(s)of the relevant hypothesis test if the level of significance is 0.01?
A) = - 1.96
B) 1.96
1.96
C) = - 2.080
D) = - 2.33
Referring to Scenario 10-3, what is(are)the critical value(s)of the relevant hypothesis test if the level of significance is 0.01?
A)
= - 1.96B)
1.96C)
= - 2.080D)
= - 2.33 Question
Question
SCENARIO 10-3 A real estate company is interested in testing whether the mean time that families in Gotham have been living in their current homes is less than families in Metropolis.Assume that the two population variances are equal.A random sample of 100 families from Gotham and a random sample of 150 families in Metropolis yield the following data on length of residence in current homes.
Referring to Scenario 10-3, what is a point estimate in months of residence for the mean of the sampling distribution of the difference between the two sample means?
A)- 22
B)- 10
C)- 15
D)0
Referring to Scenario 10-3, what is a point estimate in months of residence for the mean of the sampling distribution of the difference between the two sample means?
A)- 22
B)- 10
C)- 15
D)0
Question
SCENARIO 10-3 A real estate company is interested in testing whether the mean time that families in Gotham have been living in their current homes is less than families in Metropolis.Assume that the two population variances are equal.A random sample of 100 families from Gotham and a random sample of 150 families in Metropolis yield the following data on length of residence in current homes.
Referring to Scenario 10-3, what is the estimated standard error of the difference between the 2 sample means?
A)4.06
B)5.61
C)8.01
D)16.00
Referring to Scenario 10-3, what is the estimated standard error of the difference between the 2 sample means?
A)4.06
B)5.61
C)8.01
D)16.00
Question
A researcher randomly sampled 30 graduates of an MBA program and recorded data concerning
their starting salaries. Of primary interest to the researcher was the effect of gender on starting
salaries. The result of the pooled-variance t-test of the mean salaries of the females (Population
1) and males (Population 2) in the sample is given below.
Referring to Scenario 10-2, what is the 99% confidence interval estimate for the difference between two means?
Question
Question
SCENARIO 10-3 A real estate company is interested in testing whether the mean time that families in Gotham have been living in their current homes is less than families in Metropolis.Assume that the two population variances are equal.A random sample of 100 families from Gotham and a random sample of 150 families in Metropolis yield the following data on length of residence in current homes.
Referring to Scenario 10-3, suppose = 0.01.Which of the following represents the correct conclusion?
A)There is not enough evidence that the mean amount of time families in Gotham have been living in their current homes is less than families in Metropolis.
B)There is enough evidence that the mean amount of time families in Gotham have been living in their current homes is less than families in Metropolis.
C)There is not enough evidence that the mean amount of time families in Gotham have been living in their current homes is not less than families in Metropolis.
D)There is enough evidence that the mean amount of time families in Gotham have been living in their current homes is not less than families in Metropolis.
Referring to Scenario 10-3, suppose
= 0.01.Which of the following represents the correct conclusion?A)There is not enough evidence that the mean amount of time families in Gotham have been living in their current homes is less than families in Metropolis.
B)There is enough evidence that the mean amount of time families in Gotham have been living in their current homes is less than families in Metropolis.
C)There is not enough evidence that the mean amount of time families in Gotham have been living in their current homes is not less than families in Metropolis.
D)There is enough evidence that the mean amount of time families in Gotham have been living in their current homes is not less than families in Metropolis.
Question
Question
SCENARIO 10-3 A real estate company is interested in testing whether the mean time that families in Gotham have been living in their current homes is less than families in Metropolis.Assume that the two population variances are equal.A random sample of 100 families from Gotham and a random sample of 150 families in Metropolis yield the following data on length of residence in current homes.
Referring to Scenario 10-3, suppose = 0.01.Which of the following represents the result of the relevant hypothesis test?
A)The alternative hypothesis is rejected.
B)The null hypothesis is rejected.
C)The null hypothesis is not rejected.
D)Insufficient information exists on which to decide.
Referring to Scenario 10-3, suppose
= 0.01.Which of the following represents the result of the relevant hypothesis test?A)The alternative hypothesis is rejected.
B)The null hypothesis is rejected.
C)The null hypothesis is not rejected.
D)Insufficient information exists on which to decide.
Question
SCENARIO 10-3 A real estate company is interested in testing whether the mean time that families in Gotham have been living in their current homes is less than families in Metropolis.Assume that the two population variances are equal.A random sample of 100 families from Gotham and a random sample of 150 families in Metropolis yield the following data on length of residence in current homes.
Referring to Scenario 10-3, which of the following represents the relevant hypotheses tested by the real estate company?
A)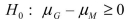 versus
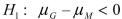
B) versus
C) versus
D)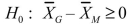 versus
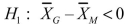
Referring to Scenario 10-3, which of the following represents the relevant hypotheses tested by the real estate company?
A)
versus B)
versus C)
versus D)
versus Question
SCENARIO 10-3 A real estate company is interested in testing whether the mean time that families in Gotham have been living in their current homes is less than families in Metropolis.Assume that the two population variances are equal.A random sample of 100 families from Gotham and a random sample of 150 families in Metropolis yield the following data on length of residence in current homes.
Referring to Scenario 10-3, suppose = 0.05.Which of the following represents the result of the relevant hypothesis test?
A)The alternative hypothesis is rejected.
B)The null hypothesis is rejected.
C)The null hypothesis is not rejected.
D)Insufficient information exists on which to decide.
Referring to Scenario 10-3, suppose
= 0.05.Which of the following represents the result of the relevant hypothesis test?A)The alternative hypothesis is rejected.
B)The null hypothesis is rejected.
C)The null hypothesis is not rejected.
D)Insufficient information exists on which to decide.
Question
SCENARIO 10-4 Two samples each of size 25 are taken from independent populations assumed to be normally distributed with equal variances.The first sample has a mean of 35.5 and standard deviation of 3.0 while the second sample has a mean of 33.0 and standard deviation of 4.0.
Referring to Scenario 10-4, the critical values for a two-tail test of the null hypothesis of no difference in the population means at the = 0.05 level of significance are _______.
Referring to Scenario 10-4, the critical values for a two-tail test of the null hypothesis of no difference in the population means at the
= 0.05 level of significance are _______. Question
SCENARIO 10-3 A real estate company is interested in testing whether the mean time that families in Gotham have been living in their current homes is less than families in Metropolis.Assume that the two population variances are equal.A random sample of 100 families from Gotham and a random sample of 150 families in Metropolis yield the following data on length of residence in current homes.
Referring to Scenario 10-3, suppose = 0.10.Which of the following represents the result of the relevant hypothesis test?
A)The alternative hypothesis is rejected.
B)The null hypothesis is rejected.
C)The null hypothesis is not rejected.
D)Insufficient information exists on which to decide.
Referring to Scenario 10-3, suppose
= 0.10.Which of the following represents the result of the relevant hypothesis test?A)The alternative hypothesis is rejected.
B)The null hypothesis is rejected.
C)The null hypothesis is not rejected.
D)Insufficient information exists on which to decide.
Question
SCENARIO 10-3 A real estate company is interested in testing whether the mean time that families in Gotham have been living in their current homes is less than families in Metropolis.Assume that the two population variances are equal.A random sample of 100 families from Gotham and a random sample of 150 families in Metropolis yield the following data on length of residence in current homes.
Referring to Scenario 10-3, suppose = 0.05.Which of the following represents the correct conclusion?
A)There is not enough evidence that the mean amount of time families in Gotham have been living in their current homes is less than families in Metropolis.
B)There is enough evidence that the mean amount of time families in Gotham have been living in their current homes is less than families in Metropolis.
C)There is not enough evidence that the mean amount of time families in Gotham have been living in their current homes is not less than families in Metropolis.
D)There is enough evidence that the mean amount of time families in Gotham have been living in their current homes is not less than families in Metropolis.
Referring to Scenario 10-3, suppose
= 0.05.Which of the following represents the correct conclusion?A)There is not enough evidence that the mean amount of time families in Gotham have been living in their current homes is less than families in Metropolis.
B)There is enough evidence that the mean amount of time families in Gotham have been living in their current homes is less than families in Metropolis.
C)There is not enough evidence that the mean amount of time families in Gotham have been living in their current homes is not less than families in Metropolis.
D)There is enough evidence that the mean amount of time families in Gotham have been living in their current homes is not less than families in Metropolis.
Question
SCENARIO 10-3 A real estate company is interested in testing whether the mean time that families in Gotham have been living in their current homes is less than families in Metropolis.Assume that the two population variances are equal.A random sample of 100 families from Gotham and a random sample of 150 families in Metropolis yield the following data on length of residence in current homes.
Referring to Scenario 10-3, what is the 95% confidence interval estimate for the difference in the two means?
Referring to Scenario 10-3, what is the 95% confidence interval estimate for the difference in the two means?
Question
A researcher randomly sampled 30 graduates of an MBA program and recorded data concerning
their starting salaries. Of primary interest to the researcher was the effect of gender on starting
salaries. The result of the pooled-variance t-test of the mean salaries of the females (Population
1) and males (Population 2) in the sample is given below.
Referring to Scenario 10-2, what is the 95% confidence interval estimate for the difference between two means?
Question
SCENARIO 10-3 A real estate company is interested in testing whether the mean time that families in Gotham have been living in their current homes is less than families in Metropolis.Assume that the two population variances are equal.A random sample of 100 families from Gotham and a random sample of 150 families in Metropolis yield the following data on length of residence in current homes.
Referring to Scenario 10-3, what is the 99% confidence interval estimate for the difference in the two means?
Referring to Scenario 10-3, what is the 99% confidence interval estimate for the difference in the two means?
Question
A researcher randomly sampled 30 graduates of an MBA program and recorded data concerning
their starting salaries. Of primary interest to the researcher was the effect of gender on starting
salaries. The result of the pooled-variance t-test of the mean salaries of the females (Population
1) and males (Population 2) in the sample is given below.
Referring to Scenario 10-2, what is the 90% confidence interval estimate for the difference between two means?
Question
SCENARIO 10-3 A real estate company is interested in testing whether the mean time that families in Gotham have been living in their current homes is less than families in Metropolis.Assume that the two population variances are equal.A random sample of 100 families from Gotham and a random sample of 150 families in Metropolis yield the following data on length of residence in current homes.
Referring to Scenario 10-3, suppose = 0.10.Which of the following represents the correct conclusion?
A)There is not enough evidence that the mean amount of time families in Gotham have been living in their current homes is less than families in Metropolis.
B)There is enough evidence that the mean amount of time families in Gotham have been living in their current homes is less than families in Metropolis.
C)There is not enough evidence that the mean amount of time families in Gotham have been living in their current homes is not less than families in Metropolis.
D)There is enough evidence that the mean amount of time families in Gotham have been living in their current homes is not less than families in Metropolis.
Referring to Scenario 10-3, suppose
= 0.10.Which of the following represents the correct conclusion?A)There is not enough evidence that the mean amount of time families in Gotham have been living in their current homes is less than families in Metropolis.
B)There is enough evidence that the mean amount of time families in Gotham have been living in their current homes is less than families in Metropolis.
C)There is not enough evidence that the mean amount of time families in Gotham have been living in their current homes is not less than families in Metropolis.
D)There is enough evidence that the mean amount of time families in Gotham have been living in their current homes is not less than families in Metropolis.
Question
SCENARIO 10-3 A real estate company is interested in testing whether the mean time that families in Gotham have been living in their current homes is less than families in Metropolis.Assume that the two population variances are equal.A random sample of 100 families from Gotham and a random sample of 150 families in Metropolis yield the following data on length of residence in current homes.
Referring to Scenario 10-3, what is the test statistic for the difference between sample means?
A)- 8.75
B)- 3.69
C)- 2.33
D)- 1.96
Referring to Scenario 10-3, what is the test statistic for the difference between sample means?
A)- 8.75
B)- 3.69
C)- 2.33
D)- 1.96
Question
Question
Question
In testing for differences between the means of two related populations, the null hypothesis is
A)
B)
C)
D)
A)
B)
C)
D)
Question
SCENARIO 10-4 Two samples each of size 25 are taken from independent populations assumed to be normally distributed with equal variances.The first sample has a mean of 35.5 and standard deviation of 3.0 while the second sample has a mean of 33.0 and standard deviation of 4.0.
Referring to Scenario 10-4, if you were interested in testing against the one-tail alternative that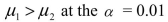 level of significance, the null hypothesis would ______ (be rejected/not be rejected).
Referring to Scenario 10-4, if you were interested in testing against the one-tail alternative that
level of significance, the null hypothesis would ______ (be rejected/not be rejected). Question
Question
Question
Question
Question
Question
Question
SCENARIO 10-5 To test the effectiveness of a business school preparation course, 8 students took a general business test before and after the course.The results are given below. 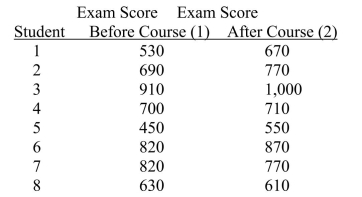
Referring to Scenario 10-5, the number of degrees of freedom is
A)14.
B)13.
C)8.
D)7.
Referring to Scenario 10-5, the number of degrees of freedom is
A)14.
B)13.
C)8.
D)7.
Question
Question
Question
Question
Question
Question
Question
Question
SCENARIO 10-4 Two samples each of size 25 are taken from independent populations assumed to be normally distributed with equal variances.The first sample has a mean of 35.5 and standard deviation of 3.0 while the second sample has a mean of 33.0 and standard deviation of 4.0.
Referring to Scenario 10-4, a two-tail test of the null hypothesis of no difference would _______ (be rejected/not be rejected)at the = 0.05 level of significance.
Referring to Scenario 10-4, a two-tail test of the null hypothesis of no difference would _______ (be rejected/not be rejected)at the
= 0.05 level of significance. Question
Question
SCENARIO 10-6 To investigate the efficacy of a diet, a random sample of 16 male patients is selected from a population of adult males using the diet.The weight of each individual in the sample is taken at the start of the diet and at a medical follow-up 4 weeks later.Assuming that the population of differences in weight before versus after the diet follow a normal distribution, the t-test for related samples can be used to determine if there was a significant decrease in the mean weight during this period.Suppose the mean decrease in weights over all 16 subjects in the study is 3.0 pounds with the standard deviation of differences computed as 6.0 pounds.
Referring to Scenario 10-6, the critical value for a one-tail test of the null hypothesis of no difference at the = 0.05 level of significance is _______.
Referring to Scenario 10-6, the critical value for a one-tail test of the null hypothesis of no difference at the
= 0.05 level of significance is _______. Question
Question
Question
SCENARIO 10-6 To investigate the efficacy of a diet, a random sample of 16 male patients is selected from a population of adult males using the diet.The weight of each individual in the sample is taken at the start of the diet and at a medical follow-up 4 weeks later.Assuming that the population of differences in weight before versus after the diet follow a normal distribution, the t-test for related samples can be used to determine if there was a significant decrease in the mean weight during this period.Suppose the mean decrease in weights over all 16 subjects in the study is 3.0 pounds with the standard deviation of differences computed as 6.0 pounds.
Referring to Scenario 10-6, a one-tail test of the null hypothesis of no difference would _______ (be rejected/not be rejected)at the = 0.05 level of significance.
Referring to Scenario 10-6, a one-tail test of the null hypothesis of no difference would _______ (be rejected/not be rejected)at the
= 0.05 level of significance. Question
SCENARIO 10-5 To test the effectiveness of a business school preparation course, 8 students took a general business test before and after the course.The results are given below.
Referring to Scenario 10-5, what is the critical value for testing at the 5% level of significance whether the business school preparation course is effective in improving exam scores?
A)2.365
B)2.145
C)1.761
D)1.895
Referring to Scenario 10-5, what is the critical value for testing at the 5% level of significance whether the business school preparation course is effective in improving exam scores?
A)2.365
B)2.145
C)1.761
D)1.895
Question
SCENARIO 10-5 To test the effectiveness of a business school preparation course, 8 students took a general business test before and after the course.The results are given below.
Referring to Scenario 10-5, in examining the differences between related samples we are essentially sampling from an underlying population of difference "scores."
Referring to Scenario 10-5, in examining the differences between related samples we are essentially sampling from an underlying population of difference "scores."
Question
Question
SCENARIO 10-5 To test the effectiveness of a business school preparation course, 8 students took a general business test before and after the course.The results are given below.
Referring to Scenario 10-5, the p-value of the test statistic is ________.
Referring to Scenario 10-5, the p-value of the test statistic is ________.
Question
Question
Question
SCENARIO 10-5 To test the effectiveness of a business school preparation course, 8 students took a general business test before and after the course.The results are given below.
Referring to Scenario 10-5, at the 0.05 level of significance, the conclusion for this hypothesis test is that there is sufficient evidence that:
A)the business school preparation course does improve exam score.
B)the business school preparation course does not improve exam score.
C)the business school preparation course has no impact on exam score.
D)no conclusion can be drawn from the information given.
Question
SCENARIO 10-6 To investigate the efficacy of a diet, a random sample of 16 male patients is selected from a population of adult males using the diet.The weight of each individual in the sample is taken at the start of the diet and at a medical follow-up 4 weeks later.Assuming that the population of differences in weight before versus after the diet follow a normal distribution, the t-test for related samples can be used to determine if there was a significant decrease in the mean weight during this period.Suppose the mean decrease in weights over all 16 subjects in the study is 3.0 pounds with the standard deviation of differences computed as 6.0 pounds.
Referring to Scenario 10-6, if we were interested in testing against the two-tail alternative that ϻD is not equal to zero at the = 0.05 level of significance, the null hypothesis would _______ (be rejected/not be rejected).
Referring to Scenario 10-6, if we were interested in testing against the two-tail alternative that ϻD is not equal to zero at the
= 0.05 level of significance, the null hypothesis would _______ (be rejected/not be rejected). Question
SCENARIO 10-5 To test the effectiveness of a business school preparation course, 8 students took a general business test before and after the course.The results are given below.
Referring to Scenario 10-5, the calculated value of the test statistic is ________.
Referring to Scenario 10-5, the calculated value of the test statistic is ________.
Question
SCENARIO 10-7 A buyer for a manufacturing plant suspects that his primary supplier of raw materials is overcharging.In order to determine if his suspicion is correct, he contacts a second supplier and asks for the prices on various identical materials.He wants to compare these prices with those of his primary supplier.The data collected is presented in the table below, with some summary statistics presented (all of these might not be necessary to answer the questions which follow). The buyer believes that the differences are normally distributed and will use this sample to perform an appropriate test at a level of significance of 0.01. 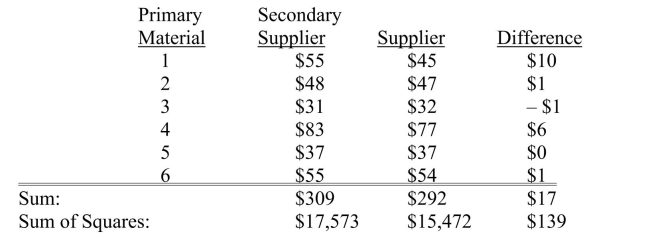
Referring to Scenario 10-7, the test to perform is a
A)pooled-variance t test for differences between two means.
B)separate-variance t test for differences between two means.
C)Z test for the difference between two proportions.
D)paired t-test for the mean difference.
Referring to Scenario 10-7, the test to perform is a
A)pooled-variance t test for differences between two means.
B)separate-variance t test for differences between two means.
C)Z test for the difference between two proportions.
D)paired t-test for the mean difference.
Question
SCENARIO 10-5 To test the effectiveness of a business school preparation course, 8 students took a general business test before and after the course.The results are given below.
Referring to Scenario 10-5, you must assume that the population of difference scores is normally distributed.
Referring to Scenario 10-5, you must assume that the population of difference scores is normally distributed.
Question
SCENARIO 10-5 To test the effectiveness of a business school preparation course, 8 students took a general business test before and after the course.The results are given below.
Referring to Scenario 10-5, the value of the standard error of the difference scores is
A)65.027
B)60.828
C)22.991
D)14.696
Referring to Scenario 10-5, the value of the standard error of the difference scores is
A)65.027
B)60.828
C)22.991
D)14.696
Question
Question
SCENARIO 10-7 A buyer for a manufacturing plant suspects that his primary supplier of raw materials is overcharging.In order to determine if his suspicion is correct, he contacts a second supplier and asks for the prices on various identical materials.He wants to compare these prices with those of his primary supplier.The data collected is presented in the table below, with some summary statistics presented (all of these might not be necessary to answer the questions which follow). The buyer believes that the differences are normally distributed and will use this sample to perform an appropriate test at a level of significance of 0.01.
Referring to Scenario 10-7, the hypotheses that the buyer should test are a null hypothesis that ________ versus an alternative hypothesis that ________.
Referring to Scenario 10-7, the hypotheses that the buyer should test are a null hypothesis that ________ versus an alternative hypothesis that ________.
Question
SCENARIO 10-5 To test the effectiveness of a business school preparation course, 8 students took a general business test before and after the course.The results are given below.
Referring to Scenario 10-5, at the 0.05 level of significance, the decision for this hypothesis test would be:
A)reject the null hypothesis.
B)do not reject the null hypothesis.
C)reject the alternative hypothesis.
D)It cannot be determined from the information given.
Referring to Scenario 10-5, at the 0.05 level of significance, the decision for this hypothesis test would be:
A)reject the null hypothesis.
B)do not reject the null hypothesis.
C)reject the alternative hypothesis.
D)It cannot be determined from the information given.
Question
SCENARIO 10-5 To test the effectiveness of a business school preparation course, 8 students took a general business test before and after the course.The results are given below.
Referring to Scenario 10-5, the value of the sample mean difference is _______ if the difference scores reflect the results of the exam after the course minus the results of the exam before the course.
A)0
B)50
C)68
D)400
Referring to Scenario 10-5, the value of the sample mean difference is _______ if the difference scores reflect the results of the exam after the course minus the results of the exam before the course.
A)0
B)50
C)68
D)400

Unlock Deck
Sign up to unlock the cards in this deck!
Unlock Deck
Unlock Deck
1/208
Play
Full screen (f)
Deck 10: Two-Sample Tests
1
SCENARIO 10-1 Are Japanese managers more motivated than American managers? A randomly selected group of each were administered the Sarnoff Survey of Attitudes Toward Life (SSATL), which measures motivation for upward mobility.The SSATL scores are summarized below.
Referring to Scenario 10-1, find the p-value if we assume that the alternative hypothesis was a two-tail test.
A)Smaller than 0.01
B)Between 0.01 and 0.05
C)Between 0.05 and 0.10
D)Greater than 0.10
Referring to Scenario 10-1, find the p-value if we assume that the alternative hypothesis was a two-tail test.
A)Smaller than 0.01
B)Between 0.01 and 0.05
C)Between 0.05 and 0.10
D)Greater than 0.10
Smaller than 0.01
2
If we are testing for the difference between the means of 2 independent populations presuming equal variances with samples of n₁ = 20 and n₂ = 20, the number of degrees of freedom is equal to
A)39.
B)38.
C)19.
D)18.
A)39.
B)38.
C)19.
D)18.
38.
3
In testing for differences between the means of two independent populations, the null hypothesis is:
A)
B)
C)
D)
A)
B)
C)
D)
4
Given the following information, calculate the degrees of freedom that should be used in the pooled-variance t test.
A)df = 41
B)df = 39
C)df = 16
D)df = 25
A)df = 41
B)df = 39
C)df = 16
D)df = 25
Unlock Deck
Unlock for access to all 208 flashcards in this deck.
Unlock Deck
k this deck
5
In testing for the differences between the means of two independent populations, you assume that the 2 populations each follow a _______ distribution.
Unlock Deck
Unlock for access to all 208 flashcards in this deck.
Unlock Deck
k this deck
6
A statistics professor wanted to test whether the grades on a statistics test were the same for upper and lower classmen.The professor took a random sample of size 10 from each, conducted a test and found out that the variances were equal.For this situation, the professor should use a t test with related samples.
Unlock Deck
Unlock for access to all 208 flashcards in this deck.
Unlock Deck
k this deck
7
SCENARIO 10-2 A researcher randomly sampled 30 graduates of an MBA program and recorded data concerning their starting salaries.Of primary interest to the researcher was the effect of gender on starting salaries.The result of the pooled-variance t-test of the mean salaries of the females (Population 1)and males (Population 2)in the sample is given below.
Referring to Scenario 10-2, the researcher was attempting to show statistically that the female MBA graduates have a significantly lower mean starting salary than the male MBA graduates.Which of the following is an appropriate alternative hypothesis?
A)
B)
C)
D)
Referring to Scenario 10-2, the researcher was attempting to show statistically that the female MBA graduates have a significantly lower mean starting salary than the male MBA graduates.Which of the following is an appropriate alternative hypothesis?
A)
B)
C)
D)
Unlock Deck
Unlock for access to all 208 flashcards in this deck.
Unlock Deck
k this deck
8
The t test for the difference between the means of 2 independent populations assumes that the respective
A)sample sizes are equal.
B)sample variances are equal.
C)populations are approximately normal.
D)All the above.
A)sample sizes are equal.
B)sample variances are equal.
C)populations are approximately normal.
D)All the above.
Unlock Deck
Unlock for access to all 208 flashcards in this deck.
Unlock Deck
k this deck
9
The sample size in each independent sample must be the same if we are to test for differences between the means of two independent populations.
Unlock Deck
Unlock for access to all 208 flashcards in this deck.
Unlock Deck
k this deck
10
A researcher randomly sampled 30 graduates of an MBA program and recorded data concerning
their starting salaries. Of primary interest to the researcher was the effect of gender on starting
salaries. The result of the pooled-variance t-test of the mean salaries of the females (Population
1) and males (Population 2) in the sample is given below.
Referring to Scenario 10-2, the researcher was attempting to show statistically that the female MBA graduates have a significantly lower mean starting salary than the male MBA graduates.The proper conclusion for this test is:
A)At the = 0.10 level, there is sufficient evidence to indicate a difference in the mean starting salaries of male and female MBA graduates.
B)At the = 0.10 level, there is sufficient evidence to indicate that females have a lower mean starting salary than male MBA graduates.
C)At the = 0.10 level, there is sufficient evidence to indicate that females have a higher mean starting salary than male MBA graduates.
D)At the = 0.10 level, there is insufficient evidence to indicate any difference in the mean starting salaries of male and female MBA graduates.
their starting salaries. Of primary interest to the researcher was the effect of gender on starting
salaries. The result of the pooled-variance t-test of the mean salaries of the females (Population
1) and males (Population 2) in the sample is given below.
Referring to Scenario 10-2, the researcher was attempting to show statistically that the female MBA graduates have a significantly lower mean starting salary than the male MBA graduates.The proper conclusion for this test is:
A)At the
= 0.10 level, there is sufficient evidence to indicate a difference in the mean starting salaries of male and female MBA graduates.B)At the
= 0.10 level, there is sufficient evidence to indicate that females have a lower mean starting salary than male MBA graduates.C)At the
= 0.10 level, there is sufficient evidence to indicate that females have a higher mean starting salary than male MBA graduates.D)At the
= 0.10 level, there is insufficient evidence to indicate any difference in the mean starting salaries of male and female MBA graduates. Unlock Deck
Unlock for access to all 208 flashcards in this deck.
Unlock Deck
k this deck
11
A statistics professor wanted to test whether the grades on a statistics test were the same for upper and lower classmen.The professor took a random sample of size 10 from each, conducted a test and found out that the variances were equal.For this situation, the professor should use a t test with independent samples.
Unlock Deck
Unlock for access to all 208 flashcards in this deck.
Unlock Deck
k this deck
12
Given the following information, calculate the pooled sample variance that should be used in the pooled-variance t test.
A) = 6.00
B) = 5.00
C) = 5.23
D) = 4.00
the pooled sample variance that should be used in the pooled-variance t test. A)
= 6.00B)
= 5.00C)
= 5.23D)
= 4.00 Unlock Deck
Unlock for access to all 208 flashcards in this deck.
Unlock Deck
k this deck
13
In testing for the differences between the means of 2 independent populations where the variances in each population are unknown but assumed equal, the degrees of freedom are
A)n - 1.
B)n₁ + n₂ - 1.
C)n₁ + n₂ - 2.
D)n - 2.
A)n - 1.
B)n₁ + n₂ - 1.
C)n₁ + n₂ - 2.
D)n - 2.
Unlock Deck
Unlock for access to all 208 flashcards in this deck.
Unlock Deck
k this deck
14
SCENARIO 10-1 Are Japanese managers more motivated than American managers? A randomly selected group of each were administered the Sarnoff Survey of Attitudes Toward Life (SSATL), which measures motivation for upward mobility.The SSATL scores are summarized below.
Referring to Scenario 10-1, what is the value of the test statistic?
A)-14.08
B)-11.8092
C)-1.9677
D)96.4471
Referring to Scenario 10-1, what is the value of the test statistic?
A)-14.08
B)-11.8092
C)-1.9677
D)96.4471
Unlock Deck
Unlock for access to all 208 flashcards in this deck.
Unlock Deck
k this deck
15
For all two-sample tests, the sample sizes must be equal in the two groups.
Unlock Deck
Unlock for access to all 208 flashcards in this deck.
Unlock Deck
k this deck
16
When you test for differences between the means of two independent populations, you can only use a two-tail test.
Unlock Deck
Unlock for access to all 208 flashcards in this deck.
Unlock Deck
k this deck
17
A researcher randomly sampled 30 graduates of an MBA program and recorded data concerning
their starting salaries. Of primary interest to the researcher was the effect of gender on starting
salaries. The result of the pooled-variance t-test of the mean salaries of the females (Population
1) and males (Population 2) in the sample is given below.
Referring to Scenario 10-2, the researcher was attempting to show statistically that the female MBA graduates have a significantly lower mean starting salary than the male MBA graduates.What assumptions were necessary to conduct this hypothesis test?
A)Both populations of salaries (male and female)must have approximate normal distributions.
B)The population variances are approximately equal.
C)The samples were randomly and independently selected.
D)All of the above assumptions were necessary.
Unlock Deck
Unlock for access to all 208 flashcards in this deck.
Unlock Deck
k this deck
18
When the sample sizes are equal, the pooled variance of the two groups is the average of the 2 sample variances.
Unlock Deck
Unlock for access to all 208 flashcards in this deck.
Unlock Deck
k this deck
19
SCENARIO 10-1 Are Japanese managers more motivated than American managers? A randomly selected group of each were administered the Sarnoff Survey of Attitudes Toward Life (SSATL), which measures motivation for upward mobility.The SSATL scores are summarized below.
Referring to Scenario 10-1, give the null and alternative hypotheses to determine if the mean SSATL score of Japanese managers differs from the mean SSATL score of American managers.
A)
B)
C)
D)
Referring to Scenario 10-1, give the null and alternative hypotheses to determine if the mean SSATL score of Japanese managers differs from the mean SSATL score of American managers.
A)
B)
C)
D)
Unlock Deck
Unlock for access to all 208 flashcards in this deck.
Unlock Deck
k this deck
20
SCENARIO 10-1 Are Japanese managers more motivated than American managers? A randomly selected group of each were administered the Sarnoff Survey of Attitudes Toward Life (SSATL), which measures motivation for upward mobility.The SSATL scores are summarized below.
Referring to Scenario 10-1, judging from the way the data were collected, which test would likely be most appropriate to employ?
A)Paired t test
B)Pooled-variance t test for the difference between two means
C)F test for the ratio of two variances
D)Z test for the difference between two proportions
Referring to Scenario 10-1, judging from the way the data were collected, which test would likely be most appropriate to employ?
A)Paired t test
B)Pooled-variance t test for the difference between two means
C)F test for the ratio of two variances
D)Z test for the difference between two proportions
Unlock Deck
Unlock for access to all 208 flashcards in this deck.
Unlock Deck
k this deck
21
SCENARIO 10-3 A real estate company is interested in testing whether the mean time that families in Gotham have been living in their current homes is less than families in Metropolis.Assume that the two population variances are equal.A random sample of 100 families from Gotham and a random sample of 150 families in Metropolis yield the following data on length of residence in current homes.
Referring to Scenario 10-3, what is(are)the critical value(s)of the relevant hypothesis test if the level of significance is 0.01?
A) = - 1.96
B) 1.96
C) = - 2.080
D) = - 2.33
Referring to Scenario 10-3, what is(are)the critical value(s)of the relevant hypothesis test if the level of significance is 0.01?
A)
= - 1.96B)
1.96C)
= - 2.080D)
= - 2.33 Unlock Deck
Unlock for access to all 208 flashcards in this deck.
Unlock Deck
k this deck
22
SCENARIO 10-4 Two samples each of size 25 are taken from independent populations assumed to be normally distributed with equal variances.The first sample has a mean of 35.5 and standard deviation of 3.0 while the second sample has a mean of 33.0 and standard deviation of 4.0.
Referring to Scenario 10-4, the computed t statistic is _______.
Referring to Scenario 10-4, the computed t statistic is _______.
Unlock Deck
Unlock for access to all 208 flashcards in this deck.
Unlock Deck
k this deck
23
SCENARIO 10-3 A real estate company is interested in testing whether the mean time that families in Gotham have been living in their current homes is less than families in Metropolis.Assume that the two population variances are equal.A random sample of 100 families from Gotham and a random sample of 150 families in Metropolis yield the following data on length of residence in current homes.
Referring to Scenario 10-3, what is a point estimate in months of residence for the mean of the sampling distribution of the difference between the two sample means?
A)- 22
B)- 10
C)- 15
D)0
Referring to Scenario 10-3, what is a point estimate in months of residence for the mean of the sampling distribution of the difference between the two sample means?
A)- 22
B)- 10
C)- 15
D)0
Unlock Deck
Unlock for access to all 208 flashcards in this deck.
Unlock Deck
k this deck
24
SCENARIO 10-3 A real estate company is interested in testing whether the mean time that families in Gotham have been living in their current homes is less than families in Metropolis.Assume that the two population variances are equal.A random sample of 100 families from Gotham and a random sample of 150 families in Metropolis yield the following data on length of residence in current homes.
Referring to Scenario 10-3, what is the estimated standard error of the difference between the 2 sample means?
A)4.06
B)5.61
C)8.01
D)16.00
Referring to Scenario 10-3, what is the estimated standard error of the difference between the 2 sample means?
A)4.06
B)5.61
C)8.01
D)16.00
Unlock Deck
Unlock for access to all 208 flashcards in this deck.
Unlock Deck
k this deck
25
A researcher randomly sampled 30 graduates of an MBA program and recorded data concerning
their starting salaries. Of primary interest to the researcher was the effect of gender on starting
salaries. The result of the pooled-variance t-test of the mean salaries of the females (Population
1) and males (Population 2) in the sample is given below.
Referring to Scenario 10-2, what is the 99% confidence interval estimate for the difference between two means?
Unlock Deck
Unlock for access to all 208 flashcards in this deck.
Unlock Deck
k this deck
26
SCENARIO 10-4 Two samples each of size 25 are taken from independent populations assumed to be normally distributed with equal variances.The first sample has a mean of 35.5 and standard deviation of 3.0 while the second sample has a mean of 33.0 and standard deviation of 4.0.
Referring to Scenario 10-6, the pooled (i.e., combined)variance is _______.
Referring to Scenario 10-6, the pooled (i.e., combined)variance is _______.
Unlock Deck
Unlock for access to all 208 flashcards in this deck.
Unlock Deck
k this deck
27
SCENARIO 10-3 A real estate company is interested in testing whether the mean time that families in Gotham have been living in their current homes is less than families in Metropolis.Assume that the two population variances are equal.A random sample of 100 families from Gotham and a random sample of 150 families in Metropolis yield the following data on length of residence in current homes.
Referring to Scenario 10-3, suppose = 0.01.Which of the following represents the correct conclusion?
A)There is not enough evidence that the mean amount of time families in Gotham have been living in their current homes is less than families in Metropolis.
B)There is enough evidence that the mean amount of time families in Gotham have been living in their current homes is less than families in Metropolis.
C)There is not enough evidence that the mean amount of time families in Gotham have been living in their current homes is not less than families in Metropolis.
D)There is enough evidence that the mean amount of time families in Gotham have been living in their current homes is not less than families in Metropolis.
Referring to Scenario 10-3, suppose
= 0.01.Which of the following represents the correct conclusion?A)There is not enough evidence that the mean amount of time families in Gotham have been living in their current homes is less than families in Metropolis.
B)There is enough evidence that the mean amount of time families in Gotham have been living in their current homes is less than families in Metropolis.
C)There is not enough evidence that the mean amount of time families in Gotham have been living in their current homes is not less than families in Metropolis.
D)There is enough evidence that the mean amount of time families in Gotham have been living in their current homes is not less than families in Metropolis.
Unlock Deck
Unlock for access to all 208 flashcards in this deck.
Unlock Deck
k this deck
28
SCENARIO 10-4 Two samples each of size 25 are taken from independent populations assumed to be normally distributed with equal variances.The first sample has a mean of 35.5 and standard deviation of 3.0 while the second sample has a mean of 33.0 and standard deviation of 4.0.
Referring to Scenario 10-4, there are _______ degrees of freedom for this test.
Referring to Scenario 10-4, there are _______ degrees of freedom for this test.
Unlock Deck
Unlock for access to all 208 flashcards in this deck.
Unlock Deck
k this deck
29
SCENARIO 10-3 A real estate company is interested in testing whether the mean time that families in Gotham have been living in their current homes is less than families in Metropolis.Assume that the two population variances are equal.A random sample of 100 families from Gotham and a random sample of 150 families in Metropolis yield the following data on length of residence in current homes.
Referring to Scenario 10-3, suppose = 0.01.Which of the following represents the result of the relevant hypothesis test?
A)The alternative hypothesis is rejected.
B)The null hypothesis is rejected.
C)The null hypothesis is not rejected.
D)Insufficient information exists on which to decide.
Referring to Scenario 10-3, suppose
= 0.01.Which of the following represents the result of the relevant hypothesis test?A)The alternative hypothesis is rejected.
B)The null hypothesis is rejected.
C)The null hypothesis is not rejected.
D)Insufficient information exists on which to decide.
Unlock Deck
Unlock for access to all 208 flashcards in this deck.
Unlock Deck
k this deck
30
SCENARIO 10-3 A real estate company is interested in testing whether the mean time that families in Gotham have been living in their current homes is less than families in Metropolis.Assume that the two population variances are equal.A random sample of 100 families from Gotham and a random sample of 150 families in Metropolis yield the following data on length of residence in current homes.
Referring to Scenario 10-3, which of the following represents the relevant hypotheses tested by the real estate company?
A) versus
B) versus
C) versus
D) versus
Referring to Scenario 10-3, which of the following represents the relevant hypotheses tested by the real estate company?
A)
versus B)
versus C)
versus D)
versus Unlock Deck
Unlock for access to all 208 flashcards in this deck.
Unlock Deck
k this deck
31
SCENARIO 10-3 A real estate company is interested in testing whether the mean time that families in Gotham have been living in their current homes is less than families in Metropolis.Assume that the two population variances are equal.A random sample of 100 families from Gotham and a random sample of 150 families in Metropolis yield the following data on length of residence in current homes.
Referring to Scenario 10-3, suppose = 0.05.Which of the following represents the result of the relevant hypothesis test?
A)The alternative hypothesis is rejected.
B)The null hypothesis is rejected.
C)The null hypothesis is not rejected.
D)Insufficient information exists on which to decide.
Referring to Scenario 10-3, suppose
= 0.05.Which of the following represents the result of the relevant hypothesis test?A)The alternative hypothesis is rejected.
B)The null hypothesis is rejected.
C)The null hypothesis is not rejected.
D)Insufficient information exists on which to decide.
Unlock Deck
Unlock for access to all 208 flashcards in this deck.
Unlock Deck
k this deck
32
SCENARIO 10-4 Two samples each of size 25 are taken from independent populations assumed to be normally distributed with equal variances.The first sample has a mean of 35.5 and standard deviation of 3.0 while the second sample has a mean of 33.0 and standard deviation of 4.0.
Referring to Scenario 10-4, the critical values for a two-tail test of the null hypothesis of no difference in the population means at the = 0.05 level of significance are _______.
Referring to Scenario 10-4, the critical values for a two-tail test of the null hypothesis of no difference in the population means at the
= 0.05 level of significance are _______. Unlock Deck
Unlock for access to all 208 flashcards in this deck.
Unlock Deck
k this deck
33
SCENARIO 10-3 A real estate company is interested in testing whether the mean time that families in Gotham have been living in their current homes is less than families in Metropolis.Assume that the two population variances are equal.A random sample of 100 families from Gotham and a random sample of 150 families in Metropolis yield the following data on length of residence in current homes.
Referring to Scenario 10-3, suppose = 0.10.Which of the following represents the result of the relevant hypothesis test?
A)The alternative hypothesis is rejected.
B)The null hypothesis is rejected.
C)The null hypothesis is not rejected.
D)Insufficient information exists on which to decide.
Referring to Scenario 10-3, suppose
= 0.10.Which of the following represents the result of the relevant hypothesis test?A)The alternative hypothesis is rejected.
B)The null hypothesis is rejected.
C)The null hypothesis is not rejected.
D)Insufficient information exists on which to decide.
Unlock Deck
Unlock for access to all 208 flashcards in this deck.
Unlock Deck
k this deck
34
SCENARIO 10-3 A real estate company is interested in testing whether the mean time that families in Gotham have been living in their current homes is less than families in Metropolis.Assume that the two population variances are equal.A random sample of 100 families from Gotham and a random sample of 150 families in Metropolis yield the following data on length of residence in current homes.
Referring to Scenario 10-3, suppose = 0.05.Which of the following represents the correct conclusion?
A)There is not enough evidence that the mean amount of time families in Gotham have been living in their current homes is less than families in Metropolis.
B)There is enough evidence that the mean amount of time families in Gotham have been living in their current homes is less than families in Metropolis.
C)There is not enough evidence that the mean amount of time families in Gotham have been living in their current homes is not less than families in Metropolis.
D)There is enough evidence that the mean amount of time families in Gotham have been living in their current homes is not less than families in Metropolis.
Referring to Scenario 10-3, suppose
= 0.05.Which of the following represents the correct conclusion?A)There is not enough evidence that the mean amount of time families in Gotham have been living in their current homes is less than families in Metropolis.
B)There is enough evidence that the mean amount of time families in Gotham have been living in their current homes is less than families in Metropolis.
C)There is not enough evidence that the mean amount of time families in Gotham have been living in their current homes is not less than families in Metropolis.
D)There is enough evidence that the mean amount of time families in Gotham have been living in their current homes is not less than families in Metropolis.
Unlock Deck
Unlock for access to all 208 flashcards in this deck.
Unlock Deck
k this deck
35
SCENARIO 10-3 A real estate company is interested in testing whether the mean time that families in Gotham have been living in their current homes is less than families in Metropolis.Assume that the two population variances are equal.A random sample of 100 families from Gotham and a random sample of 150 families in Metropolis yield the following data on length of residence in current homes.
Referring to Scenario 10-3, what is the 95% confidence interval estimate for the difference in the two means?
Referring to Scenario 10-3, what is the 95% confidence interval estimate for the difference in the two means?
Unlock Deck
Unlock for access to all 208 flashcards in this deck.
Unlock Deck
k this deck
36
A researcher randomly sampled 30 graduates of an MBA program and recorded data concerning
their starting salaries. Of primary interest to the researcher was the effect of gender on starting
salaries. The result of the pooled-variance t-test of the mean salaries of the females (Population
1) and males (Population 2) in the sample is given below.
Referring to Scenario 10-2, what is the 95% confidence interval estimate for the difference between two means?
Unlock Deck
Unlock for access to all 208 flashcards in this deck.
Unlock Deck
k this deck
37
SCENARIO 10-3 A real estate company is interested in testing whether the mean time that families in Gotham have been living in their current homes is less than families in Metropolis.Assume that the two population variances are equal.A random sample of 100 families from Gotham and a random sample of 150 families in Metropolis yield the following data on length of residence in current homes.
Referring to Scenario 10-3, what is the 99% confidence interval estimate for the difference in the two means?
Referring to Scenario 10-3, what is the 99% confidence interval estimate for the difference in the two means?
Unlock Deck
Unlock for access to all 208 flashcards in this deck.
Unlock Deck
k this deck
38
A researcher randomly sampled 30 graduates of an MBA program and recorded data concerning
their starting salaries. Of primary interest to the researcher was the effect of gender on starting
salaries. The result of the pooled-variance t-test of the mean salaries of the females (Population
1) and males (Population 2) in the sample is given below.
Referring to Scenario 10-2, what is the 90% confidence interval estimate for the difference between two means?
Unlock Deck
Unlock for access to all 208 flashcards in this deck.
Unlock Deck
k this deck
39
SCENARIO 10-3 A real estate company is interested in testing whether the mean time that families in Gotham have been living in their current homes is less than families in Metropolis.Assume that the two population variances are equal.A random sample of 100 families from Gotham and a random sample of 150 families in Metropolis yield the following data on length of residence in current homes.
Referring to Scenario 10-3, suppose = 0.10.Which of the following represents the correct conclusion?
A)There is not enough evidence that the mean amount of time families in Gotham have been living in their current homes is less than families in Metropolis.
B)There is enough evidence that the mean amount of time families in Gotham have been living in their current homes is less than families in Metropolis.
C)There is not enough evidence that the mean amount of time families in Gotham have been living in their current homes is not less than families in Metropolis.
D)There is enough evidence that the mean amount of time families in Gotham have been living in their current homes is not less than families in Metropolis.
Referring to Scenario 10-3, suppose
= 0.10.Which of the following represents the correct conclusion?A)There is not enough evidence that the mean amount of time families in Gotham have been living in their current homes is less than families in Metropolis.
B)There is enough evidence that the mean amount of time families in Gotham have been living in their current homes is less than families in Metropolis.
C)There is not enough evidence that the mean amount of time families in Gotham have been living in their current homes is not less than families in Metropolis.
D)There is enough evidence that the mean amount of time families in Gotham have been living in their current homes is not less than families in Metropolis.
Unlock Deck
Unlock for access to all 208 flashcards in this deck.
Unlock Deck
k this deck
40
SCENARIO 10-3 A real estate company is interested in testing whether the mean time that families in Gotham have been living in their current homes is less than families in Metropolis.Assume that the two population variances are equal.A random sample of 100 families from Gotham and a random sample of 150 families in Metropolis yield the following data on length of residence in current homes.
Referring to Scenario 10-3, what is the test statistic for the difference between sample means?
A)- 8.75
B)- 3.69
C)- 2.33
D)- 1.96
Referring to Scenario 10-3, what is the test statistic for the difference between sample means?
A)- 8.75
B)- 3.69
C)- 2.33
D)- 1.96
Unlock Deck
Unlock for access to all 208 flashcards in this deck.
Unlock Deck
k this deck
41
SCENARIO 10-4 Two samples each of size 25 are taken from independent populations assumed to be normally distributed with equal variances.The first sample has a mean of 35.5 and standard deviation of 3.0 while the second sample has a mean of 33.0 and standard deviation of 4.0.
Referring to Scenario 10-4, what is the 99% confidence interval estimate for the difference in the two means?
Referring to Scenario 10-4, what is the 99% confidence interval estimate for the difference in the two means?
Unlock Deck
Unlock for access to all 208 flashcards in this deck.
Unlock Deck
k this deck
42
SCENARIO 10-4 Two samples each of size 25 are taken from independent populations assumed to be normally distributed with equal variances.The first sample has a mean of 35.5 and standard deviation of 3.0 while the second sample has a mean of 33.0 and standard deviation of 4.0.
Referring to Scenario 10-4, the p-value for a one-tail test (in the hypothesized direction)is _______.
Referring to Scenario 10-4, the p-value for a one-tail test (in the hypothesized direction)is _______.
Unlock Deck
Unlock for access to all 208 flashcards in this deck.
Unlock Deck
k this deck
43
In testing for differences between the means of two related populations, the null hypothesis is
A)
B)
C)
D)
A)
B)
C)
D)
Unlock Deck
Unlock for access to all 208 flashcards in this deck.
Unlock Deck
k this deck
44
SCENARIO 10-4 Two samples each of size 25 are taken from independent populations assumed to be normally distributed with equal variances.The first sample has a mean of 35.5 and standard deviation of 3.0 while the second sample has a mean of 33.0 and standard deviation of 4.0.
Referring to Scenario 10-4, if you were interested in testing against the one-tail alternative that level of significance, the null hypothesis would ______ (be rejected/not be rejected).
Referring to Scenario 10-4, if you were interested in testing against the one-tail alternative that
level of significance, the null hypothesis would ______ (be rejected/not be rejected). Unlock Deck
Unlock for access to all 208 flashcards in this deck.
Unlock Deck
k this deck
45
A Marine drill instructor recorded the time in which each of 11 recruits completed an obstacle course both before and after basic training.To test whether any improvement occurred, the instructor would use a t-distribution with 11 degrees of freedom.
Unlock Deck
Unlock for access to all 208 flashcards in this deck.
Unlock Deck
k this deck
46
A Marine drill instructor recorded the time in which each of 11 recruits completed an obstacle course both before and after basic training.To test whether any improvement occurred, the instructor would use a t-distribution with 10 degrees of freedom.
Unlock Deck
Unlock for access to all 208 flashcards in this deck.
Unlock Deck
k this deck
47
In testing for the differences between the means of two related populations, the _______ hypothesis is the hypothesis of "no differences."
Unlock Deck
Unlock for access to all 208 flashcards in this deck.
Unlock Deck
k this deck
48
SCENARIO 10-4 Two samples each of size 25 are taken from independent populations assumed to be normally distributed with equal variances.The first sample has a mean of 35.5 and standard deviation of 3.0 while the second sample has a mean of 33.0 and standard deviation of 4.0.
Referring to Scenario 10-4, what is the 90% confidence interval estimate for the difference in the two means?
Referring to Scenario 10-4, what is the 90% confidence interval estimate for the difference in the two means?
Unlock Deck
Unlock for access to all 208 flashcards in this deck.
Unlock Deck
k this deck
49
In what type of test is the variable of interest the difference between the values of the observations rather than the observations themselves?
A)A test for the equality of variances from 2 independent populations.
B)A test for the difference between the means of 2 related populations.
C)A test for the difference between the means of 2 independent populations.
D)All of the above.
A)A test for the equality of variances from 2 independent populations.
B)A test for the difference between the means of 2 related populations.
C)A test for the difference between the means of 2 independent populations.
D)All of the above.
Unlock Deck
Unlock for access to all 208 flashcards in this deck.
Unlock Deck
k this deck
50
Repeated measurements from the same individuals is an example of data collected from two related populations.
Unlock Deck
Unlock for access to all 208 flashcards in this deck.
Unlock Deck
k this deck
51
SCENARIO 10-5 To test the effectiveness of a business school preparation course, 8 students took a general business test before and after the course.The results are given below.
Referring to Scenario 10-5, the number of degrees of freedom is
A)14.
B)13.
C)8.
D)7.
Referring to Scenario 10-5, the number of degrees of freedom is
A)14.
B)13.
C)8.
D)7.
Unlock Deck
Unlock for access to all 208 flashcards in this deck.
Unlock Deck
k this deck
52
SCENARIO 10-4 Two samples each of size 25 are taken from independent populations assumed to be normally distributed with equal variances.The first sample has a mean of 35.5 and standard deviation of 3.0 while the second sample has a mean of 33.0 and standard deviation of 4.0.
Referring to Scenario 10-4, what is the 95% confidence interval estimate for the difference in the two means?
Referring to Scenario 10-4, what is the 95% confidence interval estimate for the difference in the two means?
Unlock Deck
Unlock for access to all 208 flashcards in this deck.
Unlock Deck
k this deck
53
If we are testing for the difference between the means of 2 related populations with samples of n₁ = 20 and n₂ = 20, the number of degrees of freedom is equal to
A)39.
B)38.
C)19.
D)18.
A)39.
B)38.
C)19.
D)18.
Unlock Deck
Unlock for access to all 208 flashcards in this deck.
Unlock Deck
k this deck
54
A researcher is curious about the effect of sleep on students' test performances.He chooses 60 students and gives each two tests: one given after two hours' sleep and one after eight hours' sleep.The test the researcher should use would be a related samples test.
Unlock Deck
Unlock for access to all 208 flashcards in this deck.
Unlock Deck
k this deck
55
The t test for the mean difference between 2 related populations assumes that the
A)population sizes are equal.
B)sample variances are equal.
C)population of differences is approximately normal, or sample sizes are large enough.
D)All of the above.
A)population sizes are equal.
B)sample variances are equal.
C)population of differences is approximately normal, or sample sizes are large enough.
D)All of the above.
Unlock Deck
Unlock for access to all 208 flashcards in this deck.
Unlock Deck
k this deck
56
When testing for differences between the means of 2 related populations, you can use either a one-tail or two-tail test.
Unlock Deck
Unlock for access to all 208 flashcards in this deck.
Unlock Deck
k this deck
57
SCENARIO 10-4 Two samples each of size 25 are taken from independent populations assumed to be normally distributed with equal variances.The first sample has a mean of 35.5 and standard deviation of 3.0 while the second sample has a mean of 33.0 and standard deviation of 4.0.
Referring to Scenario 10-4, the p-value for a two-tail test is _______.
Referring to Scenario 10-4, the p-value for a two-tail test is _______.
Unlock Deck
Unlock for access to all 208 flashcards in this deck.
Unlock Deck
k this deck
58
In testing for the differences between the means of two related populations, you assume that the differences follow a _______ distribution.
Unlock Deck
Unlock for access to all 208 flashcards in this deck.
Unlock Deck
k this deck
59
SCENARIO 10-4 Two samples each of size 25 are taken from independent populations assumed to be normally distributed with equal variances.The first sample has a mean of 35.5 and standard deviation of 3.0 while the second sample has a mean of 33.0 and standard deviation of 4.0.
Referring to Scenario 10-4, a two-tail test of the null hypothesis of no difference would _______ (be rejected/not be rejected)at the = 0.05 level of significance.
Referring to Scenario 10-4, a two-tail test of the null hypothesis of no difference would _______ (be rejected/not be rejected)at the
= 0.05 level of significance. Unlock Deck
Unlock for access to all 208 flashcards in this deck.
Unlock Deck
k this deck
60
In testing for differences between the means of 2 related populations where the variance of the differences is unknown, the degrees of freedom are
A)n - 1.
B)n₁ + n₂ - 1.
C)n₁ + n₂ - 2.
D)n - 2.
A)n - 1.
B)n₁ + n₂ - 1.
C)n₁ + n₂ - 2.
D)n - 2.
Unlock Deck
Unlock for access to all 208 flashcards in this deck.
Unlock Deck
k this deck
61
SCENARIO 10-6 To investigate the efficacy of a diet, a random sample of 16 male patients is selected from a population of adult males using the diet.The weight of each individual in the sample is taken at the start of the diet and at a medical follow-up 4 weeks later.Assuming that the population of differences in weight before versus after the diet follow a normal distribution, the t-test for related samples can be used to determine if there was a significant decrease in the mean weight during this period.Suppose the mean decrease in weights over all 16 subjects in the study is 3.0 pounds with the standard deviation of differences computed as 6.0 pounds.
Referring to Scenario 10-6, the critical value for a one-tail test of the null hypothesis of no difference at the = 0.05 level of significance is _______.
Referring to Scenario 10-6, the critical value for a one-tail test of the null hypothesis of no difference at the
= 0.05 level of significance is _______. Unlock Deck
Unlock for access to all 208 flashcards in this deck.
Unlock Deck
k this deck
62
SCENARIO 10-6 To investigate the efficacy of a diet, a random sample of 16 male patients is selected from a population of adult males using the diet.The weight of each individual in the sample is taken at the start of the diet and at a medical follow-up 4 weeks later.Assuming that the population of differences in weight before versus after the diet follow a normal distribution, the t-test for related samples can be used to determine if there was a significant decrease in the mean weight during this period.Suppose the mean decrease in weights over all 16 subjects in the study is 3.0 pounds with the standard deviation of differences computed as 6.0 pounds.
Referring to Scenario 10-6, what is the 95% confidence interval estimate for the mean difference in weight before and after the diet?
Referring to Scenario 10-6, what is the 95% confidence interval estimate for the mean difference in weight before and after the diet?
Unlock Deck
Unlock for access to all 208 flashcards in this deck.
Unlock Deck
k this deck
63
SCENARIO 10-6 To investigate the efficacy of a diet, a random sample of 16 male patients is selected from a population of adult males using the diet.The weight of each individual in the sample is taken at the start of the diet and at a medical follow-up 4 weeks later.Assuming that the population of differences in weight before versus after the diet follow a normal distribution, the t-test for related samples can be used to determine if there was a significant decrease in the mean weight during this period.Suppose the mean decrease in weights over all 16 subjects in the study is 3.0 pounds with the standard deviation of differences computed as 6.0 pounds.
Referring to Scenario 10-6, the p-value for a two-tail is _______.
Referring to Scenario 10-6, the p-value for a two-tail is _______.
Unlock Deck
Unlock for access to all 208 flashcards in this deck.
Unlock Deck
k this deck
64
SCENARIO 10-6 To investigate the efficacy of a diet, a random sample of 16 male patients is selected from a population of adult males using the diet.The weight of each individual in the sample is taken at the start of the diet and at a medical follow-up 4 weeks later.Assuming that the population of differences in weight before versus after the diet follow a normal distribution, the t-test for related samples can be used to determine if there was a significant decrease in the mean weight during this period.Suppose the mean decrease in weights over all 16 subjects in the study is 3.0 pounds with the standard deviation of differences computed as 6.0 pounds.
Referring to Scenario 10-6, a one-tail test of the null hypothesis of no difference would _______ (be rejected/not be rejected)at the = 0.05 level of significance.
Referring to Scenario 10-6, a one-tail test of the null hypothesis of no difference would _______ (be rejected/not be rejected)at the
= 0.05 level of significance. Unlock Deck
Unlock for access to all 208 flashcards in this deck.
Unlock Deck
k this deck
65
SCENARIO 10-5 To test the effectiveness of a business school preparation course, 8 students took a general business test before and after the course.The results are given below.
Referring to Scenario 10-5, what is the critical value for testing at the 5% level of significance whether the business school preparation course is effective in improving exam scores?
A)2.365
B)2.145
C)1.761
D)1.895
Referring to Scenario 10-5, what is the critical value for testing at the 5% level of significance whether the business school preparation course is effective in improving exam scores?
A)2.365
B)2.145
C)1.761
D)1.895
Unlock Deck
Unlock for access to all 208 flashcards in this deck.
Unlock Deck
k this deck
66
SCENARIO 10-5 To test the effectiveness of a business school preparation course, 8 students took a general business test before and after the course.The results are given below.
Referring to Scenario 10-5, in examining the differences between related samples we are essentially sampling from an underlying population of difference "scores."
Referring to Scenario 10-5, in examining the differences between related samples we are essentially sampling from an underlying population of difference "scores."
Unlock Deck
Unlock for access to all 208 flashcards in this deck.
Unlock Deck
k this deck
67
SCENARIO 10-6 To investigate the efficacy of a diet, a random sample of 16 male patients is selected from a population of adult males using the diet.The weight of each individual in the sample is taken at the start of the diet and at a medical follow-up 4 weeks later.Assuming that the population of differences in weight before versus after the diet follow a normal distribution, the t-test for related samples can be used to determine if there was a significant decrease in the mean weight during this period.Suppose the mean decrease in weights over all 16 subjects in the study is 3.0 pounds with the standard deviation of differences computed as 6.0 pounds.
Referring to Scenario 10-6, the computed t statistic is _______.
Referring to Scenario 10-6, the computed t statistic is _______.
Unlock Deck
Unlock for access to all 208 flashcards in this deck.
Unlock Deck
k this deck
68
SCENARIO 10-5 To test the effectiveness of a business school preparation course, 8 students took a general business test before and after the course.The results are given below.
Referring to Scenario 10-5, the p-value of the test statistic is ________.
Referring to Scenario 10-5, the p-value of the test statistic is ________.
Unlock Deck
Unlock for access to all 208 flashcards in this deck.
Unlock Deck
k this deck
69
SCENARIO 10-6 To investigate the efficacy of a diet, a random sample of 16 male patients is selected from a population of adult males using the diet.The weight of each individual in the sample is taken at the start of the diet and at a medical follow-up 4 weeks later.Assuming that the population of differences in weight before versus after the diet follow a normal distribution, the t-test for related samples can be used to determine if there was a significant decrease in the mean weight during this period.Suppose the mean decrease in weights over all 16 subjects in the study is 3.0 pounds with the standard deviation of differences computed as 6.0 pounds.
Referring to Scenario 10-6, the p-value for a one-tail test is _______.
Referring to Scenario 10-6, the p-value for a one-tail test is _______.
Unlock Deck
Unlock for access to all 208 flashcards in this deck.
Unlock Deck
k this deck
70
SCENARIO 10-6 To investigate the efficacy of a diet, a random sample of 16 male patients is selected from a population of adult males using the diet.The weight of each individual in the sample is taken at the start of the diet and at a medical follow-up 4 weeks later.Assuming that the population of differences in weight before versus after the diet follow a normal distribution, the t-test for related samples can be used to determine if there was a significant decrease in the mean weight during this period.Suppose the mean decrease in weights over all 16 subjects in the study is 3.0 pounds with the standard deviation of differences computed as 6.0 pounds.
Referring to Scenario 10-6, the t test should be _______-tail.
Referring to Scenario 10-6, the t test should be _______-tail.
Unlock Deck
Unlock for access to all 208 flashcards in this deck.
Unlock Deck
k this deck
71
SCENARIO 10-5 To test the effectiveness of a business school preparation course, 8 students took a general business test before and after the course.The results are given below.
Referring to Scenario 10-5, at the 0.05 level of significance, the conclusion for this hypothesis test is that there is sufficient evidence that:
A)the business school preparation course does improve exam score.
B)the business school preparation course does not improve exam score.
C)the business school preparation course has no impact on exam score.
D)no conclusion can be drawn from the information given.
Unlock Deck
Unlock for access to all 208 flashcards in this deck.
Unlock Deck
k this deck
72
SCENARIO 10-6 To investigate the efficacy of a diet, a random sample of 16 male patients is selected from a population of adult males using the diet.The weight of each individual in the sample is taken at the start of the diet and at a medical follow-up 4 weeks later.Assuming that the population of differences in weight before versus after the diet follow a normal distribution, the t-test for related samples can be used to determine if there was a significant decrease in the mean weight during this period.Suppose the mean decrease in weights over all 16 subjects in the study is 3.0 pounds with the standard deviation of differences computed as 6.0 pounds.
Referring to Scenario 10-6, if we were interested in testing against the two-tail alternative that ϻD is not equal to zero at the = 0.05 level of significance, the null hypothesis would _______ (be rejected/not be rejected).
Referring to Scenario 10-6, if we were interested in testing against the two-tail alternative that ϻD is not equal to zero at the
= 0.05 level of significance, the null hypothesis would _______ (be rejected/not be rejected). Unlock Deck
Unlock for access to all 208 flashcards in this deck.
Unlock Deck
k this deck
73
SCENARIO 10-5 To test the effectiveness of a business school preparation course, 8 students took a general business test before and after the course.The results are given below.
Referring to Scenario 10-5, the calculated value of the test statistic is ________.
Referring to Scenario 10-5, the calculated value of the test statistic is ________.
Unlock Deck
Unlock for access to all 208 flashcards in this deck.
Unlock Deck
k this deck
74
SCENARIO 10-7 A buyer for a manufacturing plant suspects that his primary supplier of raw materials is overcharging.In order to determine if his suspicion is correct, he contacts a second supplier and asks for the prices on various identical materials.He wants to compare these prices with those of his primary supplier.The data collected is presented in the table below, with some summary statistics presented (all of these might not be necessary to answer the questions which follow). The buyer believes that the differences are normally distributed and will use this sample to perform an appropriate test at a level of significance of 0.01.
Referring to Scenario 10-7, the test to perform is a
A)pooled-variance t test for differences between two means.
B)separate-variance t test for differences between two means.
C)Z test for the difference between two proportions.
D)paired t-test for the mean difference.
Referring to Scenario 10-7, the test to perform is a
A)pooled-variance t test for differences between two means.
B)separate-variance t test for differences between two means.
C)Z test for the difference between two proportions.
D)paired t-test for the mean difference.
Unlock Deck
Unlock for access to all 208 flashcards in this deck.
Unlock Deck
k this deck
75
SCENARIO 10-5 To test the effectiveness of a business school preparation course, 8 students took a general business test before and after the course.The results are given below.
Referring to Scenario 10-5, you must assume that the population of difference scores is normally distributed.
Referring to Scenario 10-5, you must assume that the population of difference scores is normally distributed.
Unlock Deck
Unlock for access to all 208 flashcards in this deck.
Unlock Deck
k this deck
76
SCENARIO 10-5 To test the effectiveness of a business school preparation course, 8 students took a general business test before and after the course.The results are given below.
Referring to Scenario 10-5, the value of the standard error of the difference scores is
A)65.027
B)60.828
C)22.991
D)14.696
Referring to Scenario 10-5, the value of the standard error of the difference scores is
A)65.027
B)60.828
C)22.991
D)14.696
Unlock Deck
Unlock for access to all 208 flashcards in this deck.
Unlock Deck
k this deck
77
SCENARIO 10-6 To investigate the efficacy of a diet, a random sample of 16 male patients is selected from a population of adult males using the diet.The weight of each individual in the sample is taken at the start of the diet and at a medical follow-up 4 weeks later.Assuming that the population of differences in weight before versus after the diet follow a normal distribution, the t-test for related samples can be used to determine if there was a significant decrease in the mean weight during this period.Suppose the mean decrease in weights over all 16 subjects in the study is 3.0 pounds with the standard deviation of differences computed as 6.0 pounds.
Referring to Scenario 10-6, there are _______ degrees of freedom for this test.
Referring to Scenario 10-6, there are _______ degrees of freedom for this test.
Unlock Deck
Unlock for access to all 208 flashcards in this deck.
Unlock Deck
k this deck
78
SCENARIO 10-7 A buyer for a manufacturing plant suspects that his primary supplier of raw materials is overcharging.In order to determine if his suspicion is correct, he contacts a second supplier and asks for the prices on various identical materials.He wants to compare these prices with those of his primary supplier.The data collected is presented in the table below, with some summary statistics presented (all of these might not be necessary to answer the questions which follow). The buyer believes that the differences are normally distributed and will use this sample to perform an appropriate test at a level of significance of 0.01.
Referring to Scenario 10-7, the hypotheses that the buyer should test are a null hypothesis that ________ versus an alternative hypothesis that ________.
Referring to Scenario 10-7, the hypotheses that the buyer should test are a null hypothesis that ________ versus an alternative hypothesis that ________.
Unlock Deck
Unlock for access to all 208 flashcards in this deck.
Unlock Deck
k this deck
79
SCENARIO 10-5 To test the effectiveness of a business school preparation course, 8 students took a general business test before and after the course.The results are given below.
Referring to Scenario 10-5, at the 0.05 level of significance, the decision for this hypothesis test would be:
A)reject the null hypothesis.
B)do not reject the null hypothesis.
C)reject the alternative hypothesis.
D)It cannot be determined from the information given.
Referring to Scenario 10-5, at the 0.05 level of significance, the decision for this hypothesis test would be:
A)reject the null hypothesis.
B)do not reject the null hypothesis.
C)reject the alternative hypothesis.
D)It cannot be determined from the information given.
Unlock Deck
Unlock for access to all 208 flashcards in this deck.
Unlock Deck
k this deck
80
SCENARIO 10-5 To test the effectiveness of a business school preparation course, 8 students took a general business test before and after the course.The results are given below.
Referring to Scenario 10-5, the value of the sample mean difference is _______ if the difference scores reflect the results of the exam after the course minus the results of the exam before the course.
A)0
B)50
C)68
D)400
Referring to Scenario 10-5, the value of the sample mean difference is _______ if the difference scores reflect the results of the exam after the course minus the results of the exam before the course.
A)0
B)50
C)68
D)400
Unlock Deck
Unlock for access to all 208 flashcards in this deck.
Unlock Deck
k this deck
Unlock Deck
Unlock for access to all 208 flashcards in this deck.


