Deck 4: Creating and Formatting Information Graphics
Full screen (f)
Question
Question
Question
Question
Question
Question
Question
Question
Question
Question
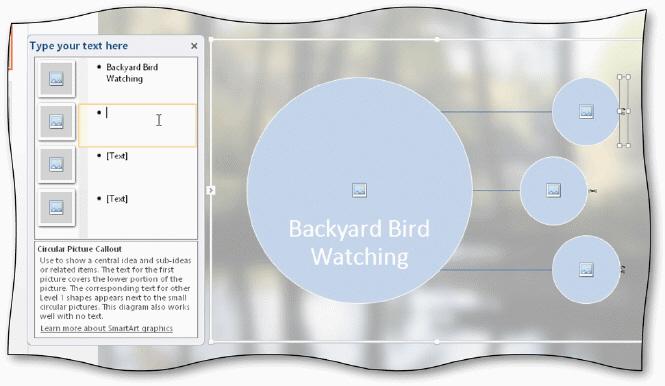 The accompanying figure illustrates entering text in a ____.
A) chart
B) table
C) SmartArt graphic
D) slide
Question
Question
Question
Question
Question
Question
Question
Question
Question
Question
Question
Question
Question
Question
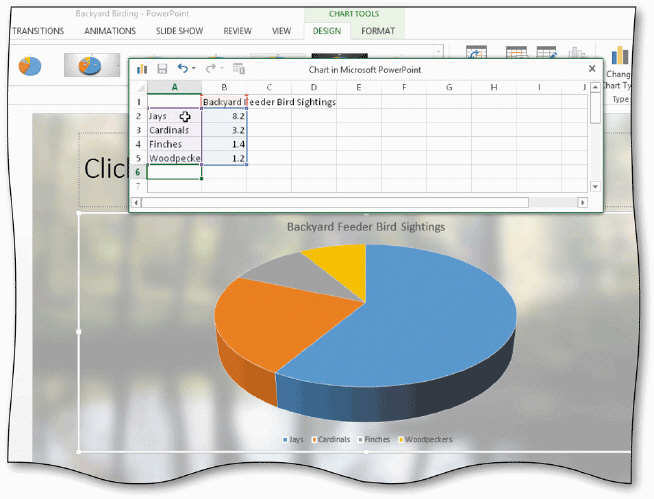 In the accompanying figure, the chart's ____ is/are created from the row titles in the worksheet.
A) pie slices
B) background
C) title
D) legend
Question
Question
Question
Question
Question
Question
Question
Question
Question
Question
Question
Question
Question
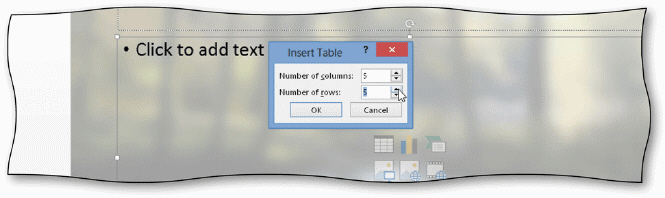 You can open the Insert Table dialog box, shown in the accompanying figure, by clicking the ____ button in the content placeholder.
A) Create Table
B) Draw Table
C) Insert Table
D) Paint Table
Question
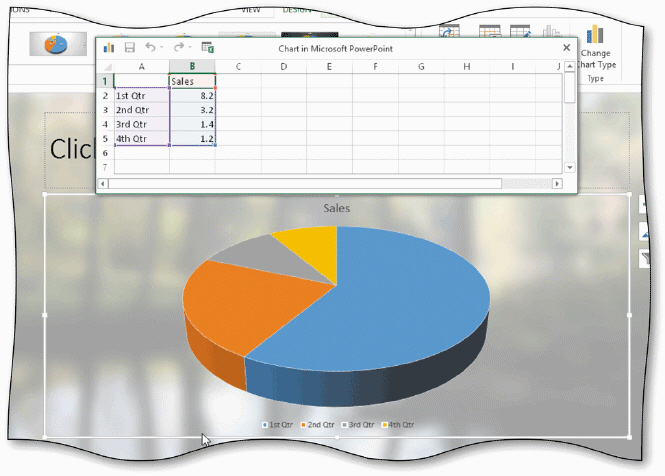 In the accompanying figure, what do the numbers in the worksheet represent?
A) Typed data
B) Preformatted data
C) Sample data
D) None of the above
Question
Question
Question
Question
Question
Question
Question
Question
Question
Question
Question
Question
Question
Question
Question
Question
Question
Question
Question
Question
Question
Question
Question
Question
Question
Question
Question
Question
Question
Question
Question
Question
Question
Question
Question
Question
Question
Question
Question
Question
Question
Question

Unlock Deck
Sign up to unlock the cards in this deck!
Unlock Deck
Unlock Deck
1/103
Play
Full screen (f)
Deck 4: Creating and Formatting Information Graphics
1
Which of the following chart types displays the effect on one variable when another variable changes?
A) Scatter
B) Bar
C) Pie
D) Line
A) Scatter
B) Bar
C) Pie
D) Line
A
2
Which of the following SmartArt layout types is used to show proportional relationships with the largest component at the top or bottom?
A) Pyramid
B) Cycle
C) Process
D) Hierarchy
A) Pyramid
B) Cycle
C) Process
D) Hierarchy
A
3
Audience members recall more material during a presentation when clear graphics are displayed ____.
A) verbally
B) visually
C) in 3-D
D) upside down
A) verbally
B) visually
C) in 3-D
D) upside down
B
4
To close the Text Pane, you can press the ____ key(s).
A) CTRL+TAB
B) ALT+SHIFT+RIGHT ARROW
C) ALT+F4
D) ESC
A) CTRL+TAB
B) ALT+SHIFT+RIGHT ARROW
C) ALT+F4
D) ESC
Unlock Deck
Unlock for access to all 103 flashcards in this deck.
Unlock Deck
k this deck
5
Which of the following chart types shows trends over a continuous period of time?
A) Bar
B) Scatter
C) Line
D) Pie
A) Bar
B) Scatter
C) Line
D) Pie
Unlock Deck
Unlock for access to all 103 flashcards in this deck.
Unlock Deck
k this deck
6
Which of the following chart types uses vertical bars to compare values over a period of time?
A) Line
B) Column
C) Bar
D) Pie
A) Line
B) Column
C) Bar
D) Pie
Unlock Deck
Unlock for access to all 103 flashcards in this deck.
Unlock Deck
k this deck
7
Graphical elements increase ____.
A) mood
B) apprehension
C) feelings
D) visual literacy
A) mood
B) apprehension
C) feelings
D) visual literacy
Unlock Deck
Unlock for access to all 103 flashcards in this deck.
Unlock Deck
k this deck
8
Which of the following SmartArt layout types is used to show non-sequential information?
A) Process
B) Cycle
C) List
D) Matrix
A) Process
B) Cycle
C) List
D) Matrix
Unlock Deck
Unlock for access to all 103 flashcards in this deck.
Unlock Deck
k this deck
9
When working in a Text Pane, which of the following shortcut keys adds a tab character?
A) TAB
B) ENTER
C) CTRL+TAB
D) F7
A) TAB
B) ENTER
C) CTRL+TAB
D) F7
Unlock Deck
Unlock for access to all 103 flashcards in this deck.
Unlock Deck
k this deck
10
The accompanying figure illustrates entering text in a ____.A) chart
B) table
C) SmartArt graphic
D) slide
Unlock Deck
Unlock for access to all 103 flashcards in this deck.
Unlock Deck
k this deck
11
To check spelling in a Text Pane, press ____.
A) TAB
B) SHIFT+F10
C) F9
D) F7
A) TAB
B) SHIFT+F10
C) F9
D) F7
Unlock Deck
Unlock for access to all 103 flashcards in this deck.
Unlock Deck
k this deck
12
Which of the following SmartArt layout types is used to create an organizational chart?
A) Relationship
B) Hierarchy
C) List
D) Matrix
A) Relationship
B) Hierarchy
C) List
D) Matrix
Unlock Deck
Unlock for access to all 103 flashcards in this deck.
Unlock Deck
k this deck
13
Which of the following SmartArt layout types is used to show how parts relate to a whole?
A) Matrix
B) Process
C) Pyramid
D) Cycle
A) Matrix
B) Process
C) Pyramid
D) Cycle
Unlock Deck
Unlock for access to all 103 flashcards in this deck.
Unlock Deck
k this deck
14
PowerPoint uses one of ____ programs to develop a chart.
A) two
B) three
C) four
D) five
A) two
B) three
C) four
D) five
Unlock Deck
Unlock for access to all 103 flashcards in this deck.
Unlock Deck
k this deck
15
Audiences generally focus first on the ____ displayed on a slide.
A) links
B) text
C) visual elements
D) colors
A) links
B) text
C) visual elements
D) colors
Unlock Deck
Unlock for access to all 103 flashcards in this deck.
Unlock Deck
k this deck
16
You can convert a small amount of slide text and pictures into a SmartArt graphic by clicking the Convert to SmartArt Graphic button on the ____.
A) (SMARTART TOOLS DESIGN tab | Convert group)
B) (HOME tab | Paragraph group)
C) (HOME tab | SmartArt group)
D) (SMARTART TOOLS FORMAT tab | Convert group)
A) (SMARTART TOOLS DESIGN tab | Convert group)
B) (HOME tab | Paragraph group)
C) (HOME tab | SmartArt group)
D) (SMARTART TOOLS FORMAT tab | Convert group)
Unlock Deck
Unlock for access to all 103 flashcards in this deck.
Unlock Deck
k this deck
17
A(n) ____ often can help convey relationships between key points in your presentation.
A) illustration
B) slide background color
C) text box
D) worksheet
A) illustration
B) slide background color
C) text box
D) worksheet
Unlock Deck
Unlock for access to all 103 flashcards in this deck.
Unlock Deck
k this deck
18
The ____ assists you in creating a graphic because you can direct your attention to developing and editing the message without being concerned with the actual graphic.
A) Slide Pane
B) Text Pane
C) Notes Pane
D) none of the above
A) Slide Pane
B) Text Pane
C) Notes Pane
D) none of the above
Unlock Deck
Unlock for access to all 103 flashcards in this deck.
Unlock Deck
k this deck
19
Which of the following SmartArt layout types is used to illustrate connections?
A) Matrix
B) Relationship
C) List
D) Cycle
A) Matrix
B) Relationship
C) List
D) Cycle
Unlock Deck
Unlock for access to all 103 flashcards in this deck.
Unlock Deck
k this deck
20
Which of the following is the path to the SmartArt Change Colors gallery?
A) Change Colors button (SMARTART TOOLS DESIGN tab | SmartArt Styles group)
B) Update Colors button (SMARTART TOOLS DESIGN tab | SmartArt group)
C) Modify Colors button (PICTURE TOOLS DESIGN tab | Styles group)
D) Change Colors button (PICTURE TOOLS DESIGN tab | SmartArt Styles group)
A) Change Colors button (SMARTART TOOLS DESIGN tab | SmartArt Styles group)
B) Update Colors button (SMARTART TOOLS DESIGN tab | SmartArt group)
C) Modify Colors button (PICTURE TOOLS DESIGN tab | Styles group)
D) Change Colors button (PICTURE TOOLS DESIGN tab | SmartArt Styles group)
Unlock Deck
Unlock for access to all 103 flashcards in this deck.
Unlock Deck
k this deck
21
In an Excel worksheet, the intersection of a column and row is called a(n) ____.
A) illustration
B) graphic
C) cell
D) text box
A) illustration
B) graphic
C) cell
D) text box
Unlock Deck
Unlock for access to all 103 flashcards in this deck.
Unlock Deck
k this deck
22
Which of the following dimensions indicates a table with four columns and six rows?
A) 4 X 6
B) 6 X 6
C) 4 X 4
D) 6 X 4
A) 4 X 6
B) 6 X 6
C) 4 X 4
D) 6 X 4
Unlock Deck
Unlock for access to all 103 flashcards in this deck.
Unlock Deck
k this deck
23
Which of the following is the path to the Table Styles gallery?
A) (TABLE TOOLS LAYOUT tab | Table Styles group)
B) (TABLE TOOLS DESIGN tab | Table Styles group)
C) (TABLE TOOLS FORMAT tab | Styles group)
D) None of the above
A) (TABLE TOOLS LAYOUT tab | Table Styles group)
B) (TABLE TOOLS DESIGN tab | Table Styles group)
C) (TABLE TOOLS FORMAT tab | Styles group)
D) None of the above
Unlock Deck
Unlock for access to all 103 flashcards in this deck.
Unlock Deck
k this deck
24
In the accompanying figure, the chart's ____ is/are created from the row titles in the worksheet.A) pie slices
B) background
C) title
D) legend
Unlock Deck
Unlock for access to all 103 flashcards in this deck.
Unlock Deck
k this deck
25
Which of the following chart types divides a single total into parts to illustrate how the segments differ from each other and the whole?
A) Scatter
B) Pie
C) Column
D) Bar
A) Scatter
B) Pie
C) Column
D) Bar
Unlock Deck
Unlock for access to all 103 flashcards in this deck.
Unlock Deck
k this deck
26
When Excel is installed, the default chart type for a PowerPoint slide is a(n) ____ chart.
A) 3-D Exploded Pie
B) Clustered Bar
C) X-Y Scatter
D) Clustered Column
A) 3-D Exploded Pie
B) Clustered Bar
C) X-Y Scatter
D) Clustered Column
Unlock Deck
Unlock for access to all 103 flashcards in this deck.
Unlock Deck
k this deck
27
The border to the right of a column is the ____.
A) column boundary
B) table resize handle
C) row boundary
D) table boundary
A) column boundary
B) table resize handle
C) row boundary
D) table boundary
Unlock Deck
Unlock for access to all 103 flashcards in this deck.
Unlock Deck
k this deck
28
The data in each cell can be aligned ____.
A) vertically only
B) horizontally or vertically
C) horizontally only
D) with inserted images
A) vertically only
B) horizontally or vertically
C) horizontally only
D) with inserted images
Unlock Deck
Unlock for access to all 103 flashcards in this deck.
Unlock Deck
k this deck
29
The path to the Chart Styles gallery is ____.
A) (HOME tab | Chart Styles group)
B) (CHART TOOLS DESIGN tab | Chart Styles group)
C) (CHART TOOLS FORMAT tab | Styles group)
D) (CHART TOOLS LAYOUT tab | Styles group)
A) (HOME tab | Chart Styles group)
B) (CHART TOOLS DESIGN tab | Chart Styles group)
C) (CHART TOOLS FORMAT tab | Styles group)
D) (CHART TOOLS LAYOUT tab | Styles group)
Unlock Deck
Unlock for access to all 103 flashcards in this deck.
Unlock Deck
k this deck
30
A pie chart ____ is a box that identifies each slice of the pie chart and coordinates with the colors assigned to the slice categories.
A) legend
B) title
C) slice
D) background
A) legend
B) title
C) slice
D) background
Unlock Deck
Unlock for access to all 103 flashcards in this deck.
Unlock Deck
k this deck
31
To resize the entire table, drag a ____ handle.
A) table sizing
B) table resizing
C) border
D) border sizing
A) table sizing
B) table resizing
C) border
D) border sizing
Unlock Deck
Unlock for access to all 103 flashcards in this deck.
Unlock Deck
k this deck
32
To clear formatting, click the Clear Table command at the bottom of the ____ gallery.
A) Table Styles
B) Table Formatting
C) Text Direction
D) Print
A) Table Styles
B) Table Formatting
C) Text Direction
D) Print
Unlock Deck
Unlock for access to all 103 flashcards in this deck.
Unlock Deck
k this deck
33
You can modify the look of the chart elements by changing its ____.
A) layout
B) type
C) color
D) function
A) layout
B) type
C) color
D) function
Unlock Deck
Unlock for access to all 103 flashcards in this deck.
Unlock Deck
k this deck
34
Which button should you tap or click to display the Select menu?
A) the Select button
B) the Alignment button
C) the Text button
D) the Select Menu button
A) the Select button
B) the Alignment button
C) the Text button
D) the Select Menu button
Unlock Deck
Unlock for access to all 103 flashcards in this deck.
Unlock Deck
k this deck
35
You can combine table cells by ____ them.
A) copying
B) splitting
C) merging
D) linking
A) copying
B) splitting
C) merging
D) linking
Unlock Deck
Unlock for access to all 103 flashcards in this deck.
Unlock Deck
k this deck
36
You can add an effect to a table by clicking the Effects button on the ____.
A) (TABLE TOOLS DESIGN tab | Effects group)
B) (TABLE TOOLS LAYOUT tab | Table Styles group)
C) (TABLE TOOLS DESIGN tab | Table Styles group)
D) (TABLE TOOLS LAYOUT tab | Effects group)
A) (TABLE TOOLS DESIGN tab | Effects group)
B) (TABLE TOOLS LAYOUT tab | Table Styles group)
C) (TABLE TOOLS DESIGN tab | Table Styles group)
D) (TABLE TOOLS LAYOUT tab | Effects group)
Unlock Deck
Unlock for access to all 103 flashcards in this deck.
Unlock Deck
k this deck
37
You can open the Insert Table dialog box, shown in the accompanying figure, by clicking the ____ button in the content placeholder.A) Create Table
B) Draw Table
C) Insert Table
D) Paint Table
Unlock Deck
Unlock for access to all 103 flashcards in this deck.
Unlock Deck
k this deck
38
In the accompanying figure, what do the numbers in the worksheet represent?A) Typed data
B) Preformatted data
C) Sample data
D) None of the above
Unlock Deck
Unlock for access to all 103 flashcards in this deck.
Unlock Deck
k this deck
39
You can open the Symbol dialog box by clicking the Symbol button on the ____.
A) (INSERT tab | Illustrations group)
B) (HOME tab | Symbols group)
C) (DESIGN tab | Characters group)
D) (INSERT tab | Symbols group)
A) (INSERT tab | Illustrations group)
B) (HOME tab | Symbols group)
C) (DESIGN tab | Characters group)
D) (INSERT tab | Symbols group)
Unlock Deck
Unlock for access to all 103 flashcards in this deck.
Unlock Deck
k this deck
40
You can reopen the Excel worksheet and edit the chart's data by clicking the ____ button (CHART TOOLS DESIGN tab | Data group).
A) Open Worksheet
B) Open Chart
C) Edit Data
D) Edit Worksheet
A) Open Worksheet
B) Open Chart
C) Edit Data
D) Edit Worksheet
Unlock Deck
Unlock for access to all 103 flashcards in this deck.
Unlock Deck
k this deck
41
Modified Multiple Choice Information graphics are ____.
A) tables
B) charts
C) graphs
D) diagrams
A) tables
B) charts
C) graphs
D) diagrams
Unlock Deck
Unlock for access to all 103 flashcards in this deck.
Unlock Deck
k this deck
42
Audiences generally focus last on the visual elements displayed on a slide.
Unlock Deck
Unlock for access to all 103 flashcards in this deck.
Unlock Deck
k this deck
43
You can create a SmartArt Graphic in three ways.
Unlock Deck
Unlock for access to all 103 flashcards in this deck.
Unlock Deck
k this deck
44
Visual literacy is the ability to examine and assess graphical elements.
Unlock Deck
Unlock for access to all 103 flashcards in this deck.
Unlock Deck
k this deck
45
While information graphics help audience members interpret and retain materials, images do not.
Unlock Deck
Unlock for access to all 103 flashcards in this deck.
Unlock Deck
k this deck
46
The SmartArt layouts have a variety of shapes, arrows, and lines to correspond to the major points you want your audience to remember.
Unlock Deck
Unlock for access to all 103 flashcards in this deck.
Unlock Deck
k this deck
47
Microsoft Office 2013 includes tables, which are visual representations of your ideas.
Unlock Deck
Unlock for access to all 103 flashcards in this deck.
Unlock Deck
k this deck
48
With the Text Pane, you can direct your attention to developing and editing the message without being concerned with the actual graphic.
Unlock Deck
Unlock for access to all 103 flashcards in this deck.
Unlock Deck
k this deck
49
SmartArt styles include shape fills, edges, shadows, line styles, gradients, and three-dimension styles.
Unlock Deck
Unlock for access to all 103 flashcards in this deck.
Unlock Deck
k this deck
50
An illustration often can help convey relationships between key points in your presentation.
Unlock Deck
Unlock for access to all 103 flashcards in this deck.
Unlock Deck
k this deck
51
Modified Multiple Choice The SmartArt layouts have a variety of ____ to correspond to the major points you want your audience to remember.
A) shapes
B) lines
C) arrows
D) grids
A) shapes
B) lines
C) arrows
D) grids
Unlock Deck
Unlock for access to all 103 flashcards in this deck.
Unlock Deck
k this deck
52
Modified Multiple Choice Which of the following are secondary sources of data?
A) In-the-field research you perform
B) Magazine articles
C) Newspaper articles
D) Web sites
A) In-the-field research you perform
B) Magazine articles
C) Newspaper articles
D) Web sites
Unlock Deck
Unlock for access to all 103 flashcards in this deck.
Unlock Deck
k this deck
53
The Text Pane consists of two areas.
Unlock Deck
Unlock for access to all 103 flashcards in this deck.
Unlock Deck
k this deck
54
In the Text Pane, the bottom portion has the text that will appear in the SmartArt graphic.
Unlock Deck
Unlock for access to all 103 flashcards in this deck.
Unlock Deck
k this deck
55
Modified Multiple Choice You resize a table the same way you resize ____.
A) a chart
B) a SmartArt graphic
C) any graphical object
D) a document
A) a chart
B) a SmartArt graphic
C) any graphical object
D) a document
Unlock Deck
Unlock for access to all 103 flashcards in this deck.
Unlock Deck
k this deck
56
You quickly can convert small amounts of slide text and pictures into a SmartArt graphic.
Unlock Deck
Unlock for access to all 103 flashcards in this deck.
Unlock Deck
k this deck
57
If you increase or decrease the font size of one shape, the font size in other shapes will not be affected.
Unlock Deck
Unlock for access to all 103 flashcards in this deck.
Unlock Deck
k this deck
58
Modified Multiple Choice The data in a table cell can be aligned ____.
A) horizontally
B) upside down
C) in reverse
D) vertically
A) horizontally
B) upside down
C) in reverse
D) vertically
Unlock Deck
Unlock for access to all 103 flashcards in this deck.
Unlock Deck
k this deck
59
If you change the size of one shape in a SmartArt graphic, other shapes in the graphic may also change size to maintain proportions.
Unlock Deck
Unlock for access to all 103 flashcards in this deck.
Unlock Deck
k this deck
60
The picture icon in the middle of a SmartArt graphic shape indicates that the shape is designed to hold an image.
Unlock Deck
Unlock for access to all 103 flashcards in this deck.
Unlock Deck
k this deck
61
One way to create a SmartArt graphic is to select a(n) _________________________ and then add text.
Unlock Deck
Unlock for access to all 103 flashcards in this deck.
Unlock Deck
k this deck
62
Use disreputable sources to obtain data for your charts. .
Unlock Deck
Unlock for access to all 103 flashcards in this deck.
Unlock Deck
k this deck
63
Depending upon the complexity of the chart and the overall slide, you may want to decrease the font size of the chart title and legend to increase readability.
Unlock Deck
Unlock for access to all 103 flashcards in this deck.
Unlock Deck
k this deck
64
The _________________________ SmartArt graphic layout shows non-sequential information.
Unlock Deck
Unlock for access to all 103 flashcards in this deck.
Unlock Deck
k this deck
65
When you are developing a chart, PowerPoint opens Microsoft Excel if that software is installed on your system.
Unlock Deck
Unlock for access to all 103 flashcards in this deck.
Unlock Deck
k this deck
66
The default chart type is a Clustered Column chart.
Unlock Deck
Unlock for access to all 103 flashcards in this deck.
Unlock Deck
k this deck
67
To draw attention to a particular area of a pie chart, you can explode one or more slices.
Unlock Deck
Unlock for access to all 103 flashcards in this deck.
Unlock Deck
k this deck
68
Visual competency is the ability to examine and assess images.
Unlock Deck
Unlock for access to all 103 flashcards in this deck.
Unlock Deck
k this deck
69
If Excel is not installed on your system, PowerPoint opens Microsoft Word to develop a chart.
Unlock Deck
Unlock for access to all 103 flashcards in this deck.
Unlock Deck
k this deck
70
You can create a SmartArt graphic in three ways.
Unlock Deck
Unlock for access to all 103 flashcards in this deck.
Unlock Deck
k this deck
71
_________________________ help audience members interpret and retain material.
Unlock Deck
Unlock for access to all 103 flashcards in this deck.
Unlock Deck
k this deck
72
You can rotate an entire chart clockwise until it is in the desired position.
Unlock Deck
Unlock for access to all 103 flashcards in this deck.
Unlock Deck
k this deck
73
You must place text boxes in the top left of a slide.
Unlock Deck
Unlock for access to all 103 flashcards in this deck.
Unlock Deck
k this deck
74
Using information graphics in a presentation should give you _________________________.
Unlock Deck
Unlock for access to all 103 flashcards in this deck.
Unlock Deck
k this deck
75
Chart layouts have a variety of shapes, arrows, and lines to correspond to the major points you want your audience to remember.
Unlock Deck
Unlock for access to all 103 flashcards in this deck.
Unlock Deck
k this deck
76
A table is a grid consisting of rows and charts.
Unlock Deck
Unlock for access to all 103 flashcards in this deck.
Unlock Deck
k this deck
77
All SmartArt graphic shapes will enlarge proportionally when you adjust the graphic's height and width. .
Unlock Deck
Unlock for access to all 103 flashcards in this deck.
Unlock Deck
k this deck
78
One way to create a SmartArt graphic is to _________________________ text or pictures already present on the slide to a graphic.
Unlock Deck
Unlock for access to all 103 flashcards in this deck.
Unlock Deck
k this deck
79
It is not possible to add a three-dimensional style to SmartArt graphics.
Unlock Deck
Unlock for access to all 103 flashcards in this deck.
Unlock Deck
k this deck
80
Various chart layouts move the legend above or below the chart.
Unlock Deck
Unlock for access to all 103 flashcards in this deck.
Unlock Deck
k this deck
Unlock Deck
Unlock for access to all 103 flashcards in this deck.


