Deck 3: Market Demand and Supply
Full screen (f)
Question
Question
Question
Question
Question
Question
Question
Question
Question
Exhibit 3-1 Market Demand
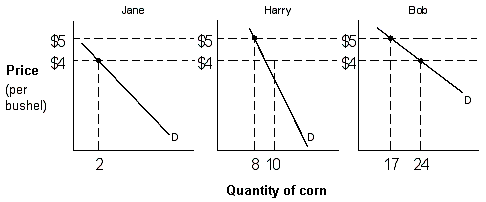
Suppose there are only three people in the economy: Jane, Harry, and Bob. The individual demand for corn for each of these consumers is given in Exhibit 3-1. The total quantity demanded of corn if the market price is $5 is
A) 3.
B) 25.
C) 17.
D) 26.
Suppose there are only three people in the economy: Jane, Harry, and Bob. The individual demand for corn for each of these consumers is given in Exhibit 3-1. The total quantity demanded of corn if the market price is $5 is
A) 3.
B) 25.
C) 17.
D) 26.
Question
Question
Question
Question
Question
Question
Question
Question
Question
Question
Question
Question
Question
Question
Question
Question
Question
Question
Question
Question
Question
Question
Question
Question
Exhibit 3-3 Demand curves

Which of the graphs in Exhibit 3-3 depicts the effect of a decrease in the price of domestic cars on the demand for foreign cars?
A) Graph A.
B) Graph B.
C) Graph C.
D) Graph D.
Which of the graphs in Exhibit 3-3 depicts the effect of a decrease in the price of domestic cars on the demand for foreign cars?
A) Graph A.
B) Graph B.
C) Graph C.
D) Graph D.
Question
Question
Question
Question
Question
Question
Question
Question
Question
Question
Question
Exhibit 3-2 Demand curves
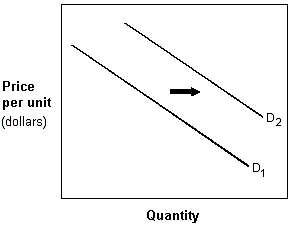
In Exhibit 3-2, the shift in the demand curve from D1 to D2 could have been caused by which of the following?
A) Decrease in price.
B) Increase in expected future prices.
C) Increase in the price of a complement.
D) Decrease in income if it is a normal good.
In Exhibit 3-2, the shift in the demand curve from D1 to D2 could have been caused by which of the following?
A) Decrease in price.
B) Increase in expected future prices.
C) Increase in the price of a complement.
D) Decrease in income if it is a normal good.
Question
Question
Exhibit 3-3 Demand curves

Which of the graphs in Exhibit 3-3 depicts the effect of a decrease in the price of pizza on the demand curve for pizza?
A) Graph A.
B) Graph B
C) Graph C.
D) Graph D.
Which of the graphs in Exhibit 3-3 depicts the effect of a decrease in the price of pizza on the demand curve for pizza?
A) Graph A.
B) Graph B
C) Graph C.
D) Graph D.
Question
Question
Question
Question
Question
Question
Question
Question
Question
Question
Question
Question
Question
Question
Question
Question
Question
Question
Question
Question
Question
Question
Question
Question
Question
Question
Question
Question
Question
Exhibit 3-3 Demand curves

Assume that consumers expect the price of gasoline to rise sharply in the future. Which of the graphs in Exhibit 3-3 depicts this effect?
A) Graph A.
B) Graph B.
C) Graph C.
D) Graph D.
Assume that consumers expect the price of gasoline to rise sharply in the future. Which of the graphs in Exhibit 3-3 depicts this effect?
A) Graph A.
B) Graph B.
C) Graph C.
D) Graph D.
Question
Question
Question
Exhibit 3-3 Demand curves

Which of the graphs in Exhibit 3-3 depicts the effect of an increase in income on the demand for pork and beans (an inferior good)?
A) Graph A.
B) Graph B.
C) Graph C.
D) Graph D.
Which of the graphs in Exhibit 3-3 depicts the effect of an increase in income on the demand for pork and beans (an inferior good)?
A) Graph A.
B) Graph B.
C) Graph C.
D) Graph D.
Question
Question
Exhibit 3-3 Demand curves
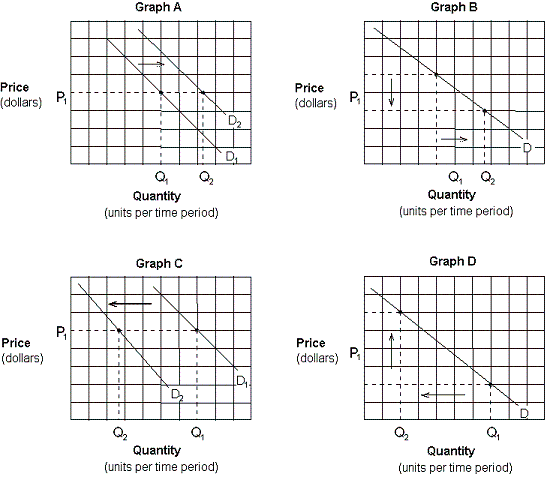
Assume that crackers and soup are complementary goods. Which of the graphs in Exhibit 3-3 depicts the effect of a promotional discount that decreases the price of crackers on the demand for soup?
A) Graph A.
B) Graph B.
C) Graph C.
D) Graph D.
Assume that crackers and soup are complementary goods. Which of the graphs in Exhibit 3-3 depicts the effect of a promotional discount that decreases the price of crackers on the demand for soup?
A) Graph A.
B) Graph B.
C) Graph C.
D) Graph D.

Unlock Deck
Sign up to unlock the cards in this deck!
Unlock Deck
Unlock Deck
1/176
Play
Full screen (f)
Deck 3: Market Demand and Supply
1
We can find the market demand for pears by:
A) adding all the prices people are willing to pay for pears.
B) multiplying the number of people times the price of pears.
C) adding the number of pears that producers are willing to sell.
D) adding the individual demand curves for pears.
A) adding all the prices people are willing to pay for pears.
B) multiplying the number of people times the price of pears.
C) adding the number of pears that producers are willing to sell.
D) adding the individual demand curves for pears.
D
2
The law of demand says that the lower the price charged for a good, ceteris paribus , the:
A) greater the quantity demanded per period of time.
B) greater the demand for the good per period of time.
C) smaller the demand for the good per period of time.
D) smaller the quantity demanded per period of time.
A) greater the quantity demanded per period of time.
B) greater the demand for the good per period of time.
C) smaller the demand for the good per period of time.
D) smaller the quantity demanded per period of time.
A
3
Suppose there are 100 consumers with identical individual demand curves. When the price of a movie ticket is $8, the quantity demanded for each person is 5. When the price is $4, the quantity demanded for each person is 9. Assuming the law of demand holds, which of the following choices is the most likely quantity demanded in the market when the price is $6?
A) 700
B) 1,200
C) 400
D) 1,000
A) 700
B) 1,200
C) 400
D) 1,000
A
4
A demand curve for The Steel Porcupines' concert tickets would show the:
A) number of tickets the box office is willing to sell at various prices.
B) number of people who need tickets.
C) quality of people who want to buy these concert tickets.
D) number of tickets that will be purchased at various prices.
A) number of tickets the box office is willing to sell at various prices.
B) number of people who need tickets.
C) quality of people who want to buy these concert tickets.
D) number of tickets that will be purchased at various prices.
Unlock Deck
Unlock for access to all 176 flashcards in this deck.
Unlock Deck
k this deck
5
The " ceteris paribus " clause in the law of demand allows which of the following factors to change?
A) consumer tastes and preferences
B) prices of other goods
C) expectations
D) price of the good demanded
A) consumer tastes and preferences
B) prices of other goods
C) expectations
D) price of the good demanded
Unlock Deck
Unlock for access to all 176 flashcards in this deck.
Unlock Deck
k this deck
6
According to the law of demand, when will higher corn prices reduce the quantity demanded of corn?
A) Always.
B) When the supply of corn is fixed.
C) When nonprice determinants, like income and the number of buyers, are unchanged.
D) When there are no shortages or surpluses of corn.
A) Always.
B) When the supply of corn is fixed.
C) When nonprice determinants, like income and the number of buyers, are unchanged.
D) When there are no shortages or surpluses of corn.
Unlock Deck
Unlock for access to all 176 flashcards in this deck.
Unlock Deck
k this deck
7
The law of demand states that:
A) as the price of a good increases, more units are demanded.
B) there is a direct relationship between the price of a good and the quantity of the good produced.
C) there is a negative relationship between the price of a good and the quantity of the good demanded.
D) there is an increase in the need for a good as the price of the good increases.
Unlock Deck
Unlock for access to all 176 flashcards in this deck.
Unlock Deck
k this deck
8
The negative slope of the demand curve reflects the:
A) positive relationship between price and quantity.
B) proportional relationship between price and quantity.
C) inverse relationship between price and quantity.
D) inverse relationship between income and quantity.
A) positive relationship between price and quantity.
B) proportional relationship between price and quantity.
C) inverse relationship between price and quantity.
D) inverse relationship between income and quantity.
Unlock Deck
Unlock for access to all 176 flashcards in this deck.
Unlock Deck
k this deck
9
Exhibit 3-1 Market Demand
Suppose there are only three people in the economy: Jane, Harry, and Bob. The individual demand for corn for each of these consumers is given in Exhibit 3-1. The total quantity demanded of corn if the market price is $5 is
A) 3.
B) 25.
C) 17.
D) 26.
Suppose there are only three people in the economy: Jane, Harry, and Bob. The individual demand for corn for each of these consumers is given in Exhibit 3-1. The total quantity demanded of corn if the market price is $5 is
A) 3.
B) 25.
C) 17.
D) 26.
Unlock Deck
Unlock for access to all 176 flashcards in this deck.
Unlock Deck
k this deck
10
The law of demand is illustrated by a demand curve that is:
A) horizontal.
B) downward-sloping.
C) vertical.
D) upward-sloping.
A) horizontal.
B) downward-sloping.
C) vertical.
D) upward-sloping.
Unlock Deck
Unlock for access to all 176 flashcards in this deck.
Unlock Deck
k this deck
11
Which of the following is true for the law of demand?
A) Sellers increase the quantity of a good available as the price of the good increases.
B) An increase in price results from false needs.
C) There is an inverse relationship between the price of a good and the quantity of the good demanded.
D) Prices increase as more units of a product are demanded.
Unlock Deck
Unlock for access to all 176 flashcards in this deck.
Unlock Deck
k this deck
12
The demand schedule for a good shows:
A) the specific quantity of the good that people are willing and able to sell at different prices.
B) the positive relationship between the price and the quantity of the good.
C) no relationship between the price and the quantity of the good.
D) the specific quantity of the good that people are willing and able to buy at different prices.
Unlock Deck
Unlock for access to all 176 flashcards in this deck.
Unlock Deck
k this deck
13
The "other things being equal" clause in the law of demand does allow which of the following factors to change?
A) Consumer income.
B) The prices of other goods.
C) Consumer tastes and preferences.
D) The price of the good being demanded.
A) Consumer income.
B) The prices of other goods.
C) Consumer tastes and preferences.
D) The price of the good being demanded.
Unlock Deck
Unlock for access to all 176 flashcards in this deck.
Unlock Deck
k this deck
14
A demand curve:
A) has a positive slope.
B) illustrates the negative relationship between price and quantity demanded.
C) illustrates the positive relationship between price and quantity demanded.
D) is based on the assumption of a stable supply curve.
A) has a positive slope.
B) illustrates the negative relationship between price and quantity demanded.
C) illustrates the positive relationship between price and quantity demanded.
D) is based on the assumption of a stable supply curve.
Unlock Deck
Unlock for access to all 176 flashcards in this deck.
Unlock Deck
k this deck
15
The law of demand indicates that as the price of a good increases:
A) suppliers sell less of it.
B) suppliers sell more of it.
C) buyers buy less of it.
D) buyers buy more of it.
A) suppliers sell less of it.
B) suppliers sell more of it.
C) buyers buy less of it.
D) buyers buy more of it.
Unlock Deck
Unlock for access to all 176 flashcards in this deck.
Unlock Deck
k this deck
16
The law of demand shows that:
A) there is an inverse relationship between price and quantity demanded.
B) the demand curve is positively sloped.
C) when the price of a good increases, the quantity demanded increases.
D) individual demand is the same as market demand.
A) there is an inverse relationship between price and quantity demanded.
B) the demand curve is positively sloped.
C) when the price of a good increases, the quantity demanded increases.
D) individual demand is the same as market demand.
Unlock Deck
Unlock for access to all 176 flashcards in this deck.
Unlock Deck
k this deck
17
Demand curves are negatively sloped when people buy:
A) less as the price decreases.
B) more as the price increases.
C) less as incomes decrease.
D) more as the price decreases.
A) less as the price decreases.
B) more as the price increases.
C) less as incomes decrease.
D) more as the price decreases.
Unlock Deck
Unlock for access to all 176 flashcards in this deck.
Unlock Deck
k this deck
18
A demand curve shows the relationship between:
A) price and quantity demanded.
B) the demand and supply schedules.
C) demand and supply equilibrium.
D) leakages and injections.
A) price and quantity demanded.
B) the demand and supply schedules.
C) demand and supply equilibrium.
D) leakages and injections.
Unlock Deck
Unlock for access to all 176 flashcards in this deck.
Unlock Deck
k this deck
19
An increase in the quantity demanded of a good is most often due to:
A) an increase in wages paid to workers.
B) higher prices.
C) a decrease in the price of a substitute good.
D) lower prices.
A) an increase in wages paid to workers.
B) higher prices.
C) a decrease in the price of a substitute good.
D) lower prices.
Unlock Deck
Unlock for access to all 176 flashcards in this deck.
Unlock Deck
k this deck
20
The law of demand refers to the:
A) inverse relationship between the price of a good and the quantity of a good that people will buy.
B) price increase that results from an increase in demand for a good of limited supply.
C) inverse relationship between the price of a good and the quantity offered for sale.
D) increase in the quantity of a good available when its price increases.
Unlock Deck
Unlock for access to all 176 flashcards in this deck.
Unlock Deck
k this deck
21
A baby boom will have what immediate effect on the disposable diaper market?
A) Supply decreases.
B) Supply increases.
C) Demand decreases.
D) Demand increases.
A) Supply decreases.
B) Supply increases.
C) Demand decreases.
D) Demand increases.
Unlock Deck
Unlock for access to all 176 flashcards in this deck.
Unlock Deck
k this deck
22
Other things being equal, the effect of an increase in the price of Coca-Cola would cause a(n):
A) upward movement along the demand curve for Coca-Cola.
B) leftward shift in the demand curve for Coca-Cola.
C) downward movement along the demand curve for Coca-Cola.
D) rightward shift in the demand curve for Coca-Cola.
A) upward movement along the demand curve for Coca-Cola.
B) leftward shift in the demand curve for Coca-Cola.
C) downward movement along the demand curve for Coca-Cola.
D) rightward shift in the demand curve for Coca-Cola.
Unlock Deck
Unlock for access to all 176 flashcards in this deck.
Unlock Deck
k this deck
23
A rightward shift of a demand curve is called a(n):
A) increase in demand.
B) decrease in demand.
C) increase in quantity demanded.
D) decrease in quantity demanded.
A) increase in demand.
B) decrease in demand.
C) increase in quantity demanded.
D) decrease in quantity demanded.
Unlock Deck
Unlock for access to all 176 flashcards in this deck.
Unlock Deck
k this deck
24
A decrease in the price of coffee, other things being equal, causes a(n):
A) leftward shift in the demand curve for coffee.
B) downward movement along the demand curve for coffee.
C) rightward shift in the demand curve for coffee.
D) upward movement along the demand curve for coffee.
A) leftward shift in the demand curve for coffee.
B) downward movement along the demand curve for coffee.
C) rightward shift in the demand curve for coffee.
D) upward movement along the demand curve for coffee.
Unlock Deck
Unlock for access to all 176 flashcards in this deck.
Unlock Deck
k this deck
25
Suppose the prices of petroleum products, including gasoline and fuel oil, fell sharply. Which of the following would most likely occur as the result of the lower prices of petroleum products?
A) A reduction in the consumption of gasoline.
B) An increase in demand for solar heating systems.
C) An increase in demand for smaller, more efficient automobiles.
D) A reduction in the demand for home insulation products.
A) A reduction in the consumption of gasoline.
B) An increase in demand for solar heating systems.
C) An increase in demand for smaller, more efficient automobiles.
D) A reduction in the demand for home insulation products.
Unlock Deck
Unlock for access to all 176 flashcards in this deck.
Unlock Deck
k this deck
26
A decrease in quantity demanded is given by a(n):
A) downward shift of the demand curve.
B) upward shift of the demand curve.
C) downward movement to the right along the demand curve.
D) upward movement to the left along the demand curve.
A) downward shift of the demand curve.
B) upward shift of the demand curve.
C) downward movement to the right along the demand curve.
D) upward movement to the left along the demand curve.
Unlock Deck
Unlock for access to all 176 flashcards in this deck.
Unlock Deck
k this deck
27
An increase in the demand for a good means that:
A) the demand curve has shifted to the left.
B) the good's price has fallen and, as a result, consumers are buying more of the good.
C) the good has become scarce.
D) consumers are willing to purchase more of the good at each possible price.
A) the demand curve has shifted to the left.
B) the good's price has fallen and, as a result, consumers are buying more of the good.
C) the good has become scarce.
D) consumers are willing to purchase more of the good at each possible price.
Unlock Deck
Unlock for access to all 176 flashcards in this deck.
Unlock Deck
k this deck
28
When economists say the quantity demanded of a product has increased, they mean the:
A) demand curve has shifted to the left.
B) demand curve has shifted to the right.
C) price of the product has fallen, and consequently, consumers are buying more of it.
D) price of the product has risen, and consequently, consumers are buying less of it.
A) demand curve has shifted to the left.
B) demand curve has shifted to the right.
C) price of the product has fallen, and consequently, consumers are buying more of it.
D) price of the product has risen, and consequently, consumers are buying less of it.
Unlock Deck
Unlock for access to all 176 flashcards in this deck.
Unlock Deck
k this deck
29
A movement along the demand curve for automobiles is caused by a change in:
A) the price of automobiles.
B) the price of gasoline.
C) the price of steel.
D) consumers' incomes.
A) the price of automobiles.
B) the price of gasoline.
C) the price of steel.
D) consumers' incomes.
Unlock Deck
Unlock for access to all 176 flashcards in this deck.
Unlock Deck
k this deck
30
Other things being equal, the effects of a decrease in the price of orange juice, is represented by which of the following?
A) A rightward shift in the demand curve for orange juice.
B) An increase in the quantity demanded for orange juice.
C) A leftward shift in the demand curve for orange juice.
D) A decrease in the quantity demanded orange juice.
A) A rightward shift in the demand curve for orange juice.
B) An increase in the quantity demanded for orange juice.
C) A leftward shift in the demand curve for orange juice.
D) A decrease in the quantity demanded orange juice.
Unlock Deck
Unlock for access to all 176 flashcards in this deck.
Unlock Deck
k this deck
31
The horizontal summation of all individual demands at different given prices results in the:
A) market supply curve.
B) market demand curve.
C) individual demand curve.
D) equilibrium demand and supply curves.
A) market supply curve.
B) market demand curve.
C) individual demand curve.
D) equilibrium demand and supply curves.
Unlock Deck
Unlock for access to all 176 flashcards in this deck.
Unlock Deck
k this deck
32
Other things being equal, the effects of an increase in the price of computers would best be represented by which of the following?
A) A movement up along the demand curve for computers.
B) A movement down along the demand curve for computers.
C) A leftward shift in the demand curve for computers.
D) A rightward shift in the demand curve for computers.
A) A movement up along the demand curve for computers.
B) A movement down along the demand curve for computers.
C) A leftward shift in the demand curve for computers.
D) A rightward shift in the demand curve for computers.
Unlock Deck
Unlock for access to all 176 flashcards in this deck.
Unlock Deck
k this deck
33
Exhibit 3-3 Demand curves
Which of the graphs in Exhibit 3-3 depicts the effect of a decrease in the price of domestic cars on the demand for foreign cars?
A) Graph A.
B) Graph B.
C) Graph C.
D) Graph D.
Which of the graphs in Exhibit 3-3 depicts the effect of a decrease in the price of domestic cars on the demand for foreign cars?
A) Graph A.
B) Graph B.
C) Graph C.
D) Graph D.
Unlock Deck
Unlock for access to all 176 flashcards in this deck.
Unlock Deck
k this deck
34
The market demand is the:
A) horizontal sum of all individual demand curves in a market.
B) horizontal sum of all individual prices in a market.
C) sum of all individual demand curves and supplies in a market.
D) vertical sum of all individual demand curves.
A) horizontal sum of all individual demand curves in a market.
B) horizontal sum of all individual prices in a market.
C) sum of all individual demand curves and supplies in a market.
D) vertical sum of all individual demand curves.
Unlock Deck
Unlock for access to all 176 flashcards in this deck.
Unlock Deck
k this deck
35
At a price of $5, Sam buys 10 units of a product; when the price increases to $6, Sam buys 8 units. Martha says Sam's demand has decreased. Is Martha correct?
A) Yes, Martha is correct. Sam's demand has decreased.
B) No, Martha is incorrect. Sam's demand has increased.
C) No, Martha is incorrect. Sam's quantity demanded has decreased, and his demand has not changed.
D) No, Martha is incorrect. Sam's quantity demanded has increased, and his demand has increased.
Unlock Deck
Unlock for access to all 176 flashcards in this deck.
Unlock Deck
k this deck
36
An increase in the demand for a product means that the:
A) demand curve shifts to the left.
B) demand curve shifts to the right.
C) supply curve shifts to the right.
D) supply curve shifts to the left.
A) demand curve shifts to the left.
B) demand curve shifts to the right.
C) supply curve shifts to the right.
D) supply curve shifts to the left.
Unlock Deck
Unlock for access to all 176 flashcards in this deck.
Unlock Deck
k this deck
37
A fall in the price of a good causes an increase in its:
A) quantity demanded.
B) demand.
C) quantity supplied.
D) supply.
A) quantity demanded.
B) demand.
C) quantity supplied.
D) supply.
Unlock Deck
Unlock for access to all 176 flashcards in this deck.
Unlock Deck
k this deck
38
A movement along a demand curve is called a change in:
A) income.
B) quantity demanded.
C) demand.
D) tastes.
A) income.
B) quantity demanded.
C) demand.
D) tastes.
Unlock Deck
Unlock for access to all 176 flashcards in this deck.
Unlock Deck
k this deck
39
Which of the following is least likely to increase the demand for new tires?
A) a decrease in the price of tires
B) a decrease in the price of cars
C) an increase in consumer income
D) an increase in the number of miles people drive per year
A) a decrease in the price of tires
B) a decrease in the price of cars
C) an increase in consumer income
D) an increase in the number of miles people drive per year
Unlock Deck
Unlock for access to all 176 flashcards in this deck.
Unlock Deck
k this deck
40
Which of the following best represents the effects of a decrease in the price of tomato juice, other things being equal?
A) An upward movement along the demand curve for tomato juice.
B) A downward movement along the demand curve for tomato juice.
C) A rightward shift in the demand curve for tomato juice.
D) A leftward shift in the demand curve for tomato juice.
A) An upward movement along the demand curve for tomato juice.
B) A downward movement along the demand curve for tomato juice.
C) A rightward shift in the demand curve for tomato juice.
D) A leftward shift in the demand curve for tomato juice.
Unlock Deck
Unlock for access to all 176 flashcards in this deck.
Unlock Deck
k this deck
41
If the demand for a good decreases because consumer income increases, the good is a(n):
A) inferior good.
B) normal good.
C) necessity good.
D) luxury good.
A) inferior good.
B) normal good.
C) necessity good.
D) luxury good.
Unlock Deck
Unlock for access to all 176 flashcards in this deck.
Unlock Deck
k this deck
42
Which of the following will not shift the demand curve for grapefruit to the right?
A) An announcement that eating a grapefruit before every meal will induce weight loss.
B) A technical development that allows machines to replace the workers who harvest grapefruit.
C) The price of oranges, a substitute good, increases.
D) Consumer incomes increase and grapefruit is a normal good.
A) An announcement that eating a grapefruit before every meal will induce weight loss.
B) A technical development that allows machines to replace the workers who harvest grapefruit.
C) The price of oranges, a substitute good, increases.
D) Consumer incomes increase and grapefruit is a normal good.
Unlock Deck
Unlock for access to all 176 flashcards in this deck.
Unlock Deck
k this deck
43
Which of the following is true if the price of coffee increases?
A) The demand for tea, a substitute good, will decrease.
B) The demand for coffee will increase.
C) The demand for tea, a substitute good, will increase.
D) Both the demand for coffee and tea will increase.
A) The demand for tea, a substitute good, will decrease.
B) The demand for coffee will increase.
C) The demand for tea, a substitute good, will increase.
D) Both the demand for coffee and tea will increase.
Unlock Deck
Unlock for access to all 176 flashcards in this deck.
Unlock Deck
k this deck
44
Exhibit 3-2 Demand curves
In Exhibit 3-2, the shift in the demand curve from D1 to D2 could have been caused by which of the following?
A) Decrease in price.
B) Increase in expected future prices.
C) Increase in the price of a complement.
D) Decrease in income if it is a normal good.
In Exhibit 3-2, the shift in the demand curve from D1 to D2 could have been caused by which of the following?
A) Decrease in price.
B) Increase in expected future prices.
C) Increase in the price of a complement.
D) Decrease in income if it is a normal good.
Unlock Deck
Unlock for access to all 176 flashcards in this deck.
Unlock Deck
k this deck
45
Which of the following will increase the demand for motorcycles?
A) A fall in the price of motorcycles.
B) A fall in insurance rates for motorcycles.
C) A fall in the price of automobiles.
D) A fall in buyers' incomes (assuming motorcycles are a normal good).
A) A fall in the price of motorcycles.
B) A fall in insurance rates for motorcycles.
C) A fall in the price of automobiles.
D) A fall in buyers' incomes (assuming motorcycles are a normal good).
Unlock Deck
Unlock for access to all 176 flashcards in this deck.
Unlock Deck
k this deck
46
Exhibit 3-3 Demand curves
Which of the graphs in Exhibit 3-3 depicts the effect of a decrease in the price of pizza on the demand curve for pizza?
A) Graph A.
B) Graph B
C) Graph C.
D) Graph D.
Which of the graphs in Exhibit 3-3 depicts the effect of a decrease in the price of pizza on the demand curve for pizza?
A) Graph A.
B) Graph B
C) Graph C.
D) Graph D.
Unlock Deck
Unlock for access to all 176 flashcards in this deck.
Unlock Deck
k this deck
47
Ceteris paribus , which of the following would cause a decrease in the demand for HD TVs, a normal good?
A) decline in the price of HD TVs.
B) increase in the price of HD TVs.
C) increase in consumers' income.
D) decrease in consumers' income.
A) decline in the price of HD TVs.
B) increase in the price of HD TVs.
C) increase in consumers' income.
D) decrease in consumers' income.
Unlock Deck
Unlock for access to all 176 flashcards in this deck.
Unlock Deck
k this deck
48
When firms advertise their products, they are attempting to:
A) shift the supply curve of the product to the right.
B) shift the supply curve of the product to the left.
C) shift the demand for the product to the right.
D) shift the demand for the product to the left.
A) shift the supply curve of the product to the right.
B) shift the supply curve of the product to the left.
C) shift the demand for the product to the right.
D) shift the demand for the product to the left.
Unlock Deck
Unlock for access to all 176 flashcards in this deck.
Unlock Deck
k this deck
49
If consumer tastes are changing more in favor of the consumption of a particular good the:
A) market demand curve will shift to the left.
B) consumer will move up a given demand curve, decreasing the quantity demanded.
C) maket demand curve would shift to the right.
D) consumer would move down a given demand curve, increasing the quantity demanded.
A) market demand curve will shift to the left.
B) consumer will move up a given demand curve, decreasing the quantity demanded.
C) maket demand curve would shift to the right.
D) consumer would move down a given demand curve, increasing the quantity demanded.
Unlock Deck
Unlock for access to all 176 flashcards in this deck.
Unlock Deck
k this deck
50
Assuming that generic brands are inferior goods, an increase in consumer income, other things being equal, will cause a(n):
A) leftward shift in the demand curve for generic goods.
B) downward movement along the demand curve for generic goods.
C) rightward shift in the demand curve for generic goods.
D) upward movement along the demand curve for generic goods.
A) leftward shift in the demand curve for generic goods.
B) downward movement along the demand curve for generic goods.
C) rightward shift in the demand curve for generic goods.
D) upward movement along the demand curve for generic goods.
Unlock Deck
Unlock for access to all 176 flashcards in this deck.
Unlock Deck
k this deck
51
Which of the following must be true if good X is a normal good and income increases?
A) The demand for X will increase, and thus the price and quantity sold and bought will decrease.
B) The demand for X will decrease, and thus the price and quantity sold and bought will decrease.
C) The demand for X will increase, and thus the price and quantity sold and bought will increase.
D) The demand for X will decrease, and thus the price and quantity sold and bought will increase.
Unlock Deck
Unlock for access to all 176 flashcards in this deck.
Unlock Deck
k this deck
52
Assuming that travel from New York to Los Angeles is a normal good, a decrease in consumer income, other things being equal, will:
A) decrease the quantity demanded of travel to Los Angeles.
B) increase the demand for travel to Los Angeles.
C) decrease the demand for travel to Los Angeles.
D) increase the quantity of travel to Los Angeles demanded.
A) decrease the quantity demanded of travel to Los Angeles.
B) increase the demand for travel to Los Angeles.
C) decrease the demand for travel to Los Angeles.
D) increase the quantity of travel to Los Angeles demanded.
Unlock Deck
Unlock for access to all 176 flashcards in this deck.
Unlock Deck
k this deck
53
Which of the following is most likely to shift the demand curve for electricity to the left?
A) consumers becoming more energy conscious.
B) an increase in income.
C) a decrease in the price of electricity.
D) an increase in the price of natural gas, a substitute source of energy.
A) consumers becoming more energy conscious.
B) an increase in income.
C) a decrease in the price of electricity.
D) an increase in the price of natural gas, a substitute source of energy.
Unlock Deck
Unlock for access to all 176 flashcards in this deck.
Unlock Deck
k this deck
54
Suppose all of the major computer manufacturers announced that beginning next month there would be major price reductions on their computers. This would cause the current demand for computers to:
A) increase.
B) decrease.
C) remain unchanged.
D) increase and then decrease.
A) increase.
B) decrease.
C) remain unchanged.
D) increase and then decrease.
Unlock Deck
Unlock for access to all 176 flashcards in this deck.
Unlock Deck
k this deck
55
Which of the following will cause the demand curve for a good to shift to the right?
A) Decrease in income for a normal good.
B) Increase in the price of a complementary good.
C) Decrease in the price of the good.
D) Increase in the price of a substitute good.
A) Decrease in income for a normal good.
B) Increase in the price of a complementary good.
C) Decrease in the price of the good.
D) Increase in the price of a substitute good.
Unlock Deck
Unlock for access to all 176 flashcards in this deck.
Unlock Deck
k this deck
56
If people expect the price of packaged coffee to rise next week, coffee demand will:
A) decrease now.
B) increase now.
C) stay the same now and increase next week.
D) stay the same now and decrease next week.
A) decrease now.
B) increase now.
C) stay the same now and increase next week.
D) stay the same now and decrease next week.
Unlock Deck
Unlock for access to all 176 flashcards in this deck.
Unlock Deck
k this deck
57
For a normal good, an increase in consumer income will cause the market demand for the product to:
A) decrease, which is a shift to the left of the demand curve.
B) decrease, which is a shift to the right of the demand curve.
C) increase, which is a shift to the left of the demand curve.
D) increase, which is a shift to the right of the demand curve.
A) decrease, which is a shift to the left of the demand curve.
B) decrease, which is a shift to the right of the demand curve.
C) increase, which is a shift to the left of the demand curve.
D) increase, which is a shift to the right of the demand curve.
Unlock Deck
Unlock for access to all 176 flashcards in this deck.
Unlock Deck
k this deck
58
An increase in demand:
A) results in a leftward shift of the demand curve.
B) could be caused by a decrease in the price of the good.
C) could be caused by an increase in the price of a substitute good.
D) is shown as movement down along a demand curve.
A) results in a leftward shift of the demand curve.
B) could be caused by a decrease in the price of the good.
C) could be caused by an increase in the price of a substitute good.
D) is shown as movement down along a demand curve.
Unlock Deck
Unlock for access to all 176 flashcards in this deck.
Unlock Deck
k this deck
59
Assuming that automobiles are normal goods, a rise in consumer income, other things being equal, will cause:
A) the demand curve for automobiles to shift to the left.
B) the demand curve for automobiles to shift to the right.
C) a downward movement along the demand curve for automobiles.
D) an upward movement along the demand curve for automobiles.
A) the demand curve for automobiles to shift to the left.
B) the demand curve for automobiles to shift to the right.
C) a downward movement along the demand curve for automobiles.
D) an upward movement along the demand curve for automobiles.
Unlock Deck
Unlock for access to all 176 flashcards in this deck.
Unlock Deck
k this deck
60
Assuming that bus travel is an inferior good, an increase in consumer income, other things being equal, will cause a(n):
A) upward movement along the demand curve for bus travel.
B) downward movement along the demand curve for bus travel.
C) rightward shift in the demand curve for bus travel.
D) leftward shift in the demand curve for bus travel.
A) upward movement along the demand curve for bus travel.
B) downward movement along the demand curve for bus travel.
C) rightward shift in the demand curve for bus travel.
D) leftward shift in the demand curve for bus travel.
Unlock Deck
Unlock for access to all 176 flashcards in this deck.
Unlock Deck
k this deck
61
Complementary goods are goods:
A) that are consumed jointly.
B) that are consumed in place of one another.
C) for which demand increases when the price of its complementary goods increases.
D) for which demand decreases when the price of its complementary goods decreases.
A) that are consumed jointly.
B) that are consumed in place of one another.
C) for which demand increases when the price of its complementary goods increases.
D) for which demand decreases when the price of its complementary goods decreases.
Unlock Deck
Unlock for access to all 176 flashcards in this deck.
Unlock Deck
k this deck
62
According to the law of supply:
A) producers are willing to supply larger amounts of a good as its price increases.
B) a direct relationship exists between the price of a good and the amount buyers choose to buy.
C) an inverse relationship exists between the price of a good and the amount buyers wish to buy.
D) an inverse relationship exists between the price of a good and the amount producers supply.
Unlock Deck
Unlock for access to all 176 flashcards in this deck.
Unlock Deck
k this deck
63
The supply schedule shows the specific quantity of a good that suppliers are willing and able to:
A) demand at various prices.
B) produce at various costs.
C) hold back from the market when competition is reduced.
D) provide at different prices.
A) demand at various prices.
B) produce at various costs.
C) hold back from the market when competition is reduced.
D) provide at different prices.
Unlock Deck
Unlock for access to all 176 flashcards in this deck.
Unlock Deck
k this deck
64
Suppose that X and Y are substitute goods. If the price of good X increases, we can expect:
A) the demand for good X to shift to the left.
B) an upward movement along the demand curve for good Y.
C) the demand curve for good Y to shift to the right.
D) a downward movement along the demand curve for good Y.
A) the demand for good X to shift to the left.
B) an upward movement along the demand curve for good Y.
C) the demand curve for good Y to shift to the right.
D) a downward movement along the demand curve for good Y.
Unlock Deck
Unlock for access to all 176 flashcards in this deck.
Unlock Deck
k this deck
65
In accordance with the law of supply, both individual and market supply curves are drawn:
A) horizontal.
B) vertical.
C) downward-sloping.
D) upward-sloping.
A) horizontal.
B) vertical.
C) downward-sloping.
D) upward-sloping.
Unlock Deck
Unlock for access to all 176 flashcards in this deck.
Unlock Deck
k this deck
66
A supply schedule shows the relationship between:
A) demand and supply.
B) supply and income.
C) price and income.
D) quantity supplied and price.
A) demand and supply.
B) supply and income.
C) price and income.
D) quantity supplied and price.
Unlock Deck
Unlock for access to all 176 flashcards in this deck.
Unlock Deck
k this deck
67
Supply curves slope upward because:
A) the quality is assumed to vary with price.
B) technology improves over time, increasing the ability of firms to produce more at each possible price.
C) increases in the price of a good lead to rightward shifts of the supply curve.
D) rising prides provide producers with the incentives needed to increase the quantity supplied.
Unlock Deck
Unlock for access to all 176 flashcards in this deck.
Unlock Deck
k this deck
68
Other things being equal, the effect of a decrease in the price of DVDs on the market for DVD players is a(n):
A) leftward shift in the demand curve for DVD players.
B) upward movement along the demand curve for DVD players.
C) rightward shift in the demand curve for DVD players.
D) downward movement along the demand curve for DVD players.
A) leftward shift in the demand curve for DVD players.
B) upward movement along the demand curve for DVD players.
C) rightward shift in the demand curve for DVD players.
D) downward movement along the demand curve for DVD players.
Unlock Deck
Unlock for access to all 176 flashcards in this deck.
Unlock Deck
k this deck
69
Sugar and honey are viewed as substitutes for each other in many cooking applications. If the price of sugar rises, we would expect the:
A) demand for honey to increase.
B) demand for honey to decrease.
C) quantity demanded of honey to decrease.
D) price of honey to decrease.
A) demand for honey to increase.
B) demand for honey to decrease.
C) quantity demanded of honey to decrease.
D) price of honey to decrease.
Unlock Deck
Unlock for access to all 176 flashcards in this deck.
Unlock Deck
k this deck
70
According to the law of supply, there is a direct relationship between quantity supplied of pickles and:
A) the number of sellers of pickles.
B) costs of cucumbers.
C) pickling production technology.
D) the price of the pickles.
A) the number of sellers of pickles.
B) costs of cucumbers.
C) pickling production technology.
D) the price of the pickles.
Unlock Deck
Unlock for access to all 176 flashcards in this deck.
Unlock Deck
k this deck
71
Demand for a good will always rise when:
A) the price of a complementary good falls.
B) the price of a substitute good falls.
C) tastes change.
D) the price of the good falls.
A) the price of a complementary good falls.
B) the price of a substitute good falls.
C) tastes change.
D) the price of the good falls.
Unlock Deck
Unlock for access to all 176 flashcards in this deck.
Unlock Deck
k this deck
72
Which of the following states the definition of supply?
A) More of a good is supplied at a lower price.
B) There is a positive relationship between the price of a good and the quantity that buyers purchase.
C) There is a positive relationship between the price of a good and the quantity offered for sale by suppliers.
D) There is a negative relationship between the price of a good and the quantity offered for sale by suppliers.
Unlock Deck
Unlock for access to all 176 flashcards in this deck.
Unlock Deck
k this deck
73
Tasha decides that when homes in her neighborhood are selling for $150,000 she will not sell her home. When average prices rise to $175,000, she decides that she will put her home on the market. This is an example of:
A) market demand.
B) a negatively-sloped supply curve.
C) an excess supply of homes.
D) a positively-sloped supply curve.
A) market demand.
B) a negatively-sloped supply curve.
C) an excess supply of homes.
D) a positively-sloped supply curve.
Unlock Deck
Unlock for access to all 176 flashcards in this deck.
Unlock Deck
k this deck
74
In general, supply curves slope upward because:
A) the government requires that more units be produced.
B) rising prices provide producers with a greater profit incentive.
C) consumers buy a greater quantity.
D) technology improves the ability of firms to produce more at each possible price.
A) the government requires that more units be produced.
B) rising prices provide producers with a greater profit incentive.
C) consumers buy a greater quantity.
D) technology improves the ability of firms to produce more at each possible price.
Unlock Deck
Unlock for access to all 176 flashcards in this deck.
Unlock Deck
k this deck
75
Exhibit 3-3 Demand curves
Assume that consumers expect the price of gasoline to rise sharply in the future. Which of the graphs in Exhibit 3-3 depicts this effect?
A) Graph A.
B) Graph B.
C) Graph C.
D) Graph D.
Assume that consumers expect the price of gasoline to rise sharply in the future. Which of the graphs in Exhibit 3-3 depicts this effect?
A) Graph A.
B) Graph B.
C) Graph C.
D) Graph D.
Unlock Deck
Unlock for access to all 176 flashcards in this deck.
Unlock Deck
k this deck
76
According to the law of supply:
A) more of a good is desired by consumers as the price falls.
B) less of a good is desired by consumers as the price rises.
C) more of a good will be offered by suppliers as the price rises.
D) less of a good will be offered by suppliers as the price rises.
A) more of a good is desired by consumers as the price falls.
B) less of a good is desired by consumers as the price rises.
C) more of a good will be offered by suppliers as the price rises.
D) less of a good will be offered by suppliers as the price rises.
Unlock Deck
Unlock for access to all 176 flashcards in this deck.
Unlock Deck
k this deck
77
The law of supply states that:
A) there is a negative relationship between the price of a good and the quantity of it purchased by suppliers.
B) there is a positive relationship between the price of a good and the quantity that buyers choose to purchase.
C) there is a positive relationship between the price of a good and the quantity of it offered for sale by suppliers.
D) at a lower price, a greater quantity will be supplied.
Unlock Deck
Unlock for access to all 176 flashcards in this deck.
Unlock Deck
k this deck
78
Exhibit 3-3 Demand curves
Which of the graphs in Exhibit 3-3 depicts the effect of an increase in income on the demand for pork and beans (an inferior good)?
A) Graph A.
B) Graph B.
C) Graph C.
D) Graph D.
Which of the graphs in Exhibit 3-3 depicts the effect of an increase in income on the demand for pork and beans (an inferior good)?
A) Graph A.
B) Graph B.
C) Graph C.
D) Graph D.
Unlock Deck
Unlock for access to all 176 flashcards in this deck.
Unlock Deck
k this deck
79
If a decrease in the price of good Y causes the demand for good Z to decrease, this indicates that:
A) Y and Z are complements.
B) Y and Z are substitutes.
C) Y and Z are unrelated.
D) Y is a normal good and Z is an inferior good.
A) Y and Z are complements.
B) Y and Z are substitutes.
C) Y and Z are unrelated.
D) Y is a normal good and Z is an inferior good.
Unlock Deck
Unlock for access to all 176 flashcards in this deck.
Unlock Deck
k this deck
80
Exhibit 3-3 Demand curves
Assume that crackers and soup are complementary goods. Which of the graphs in Exhibit 3-3 depicts the effect of a promotional discount that decreases the price of crackers on the demand for soup?
A) Graph A.
B) Graph B.
C) Graph C.
D) Graph D.
Assume that crackers and soup are complementary goods. Which of the graphs in Exhibit 3-3 depicts the effect of a promotional discount that decreases the price of crackers on the demand for soup?
A) Graph A.
B) Graph B.
C) Graph C.
D) Graph D.
Unlock Deck
Unlock for access to all 176 flashcards in this deck.
Unlock Deck
k this deck
Unlock Deck
Unlock for access to all 176 flashcards in this deck.


