Deck 31: Understanding Direct and Inverse Relationships between Variables
Full screen (f)
Question
Question
Question
Question
Question
Exhibit 1A-3 Straight line
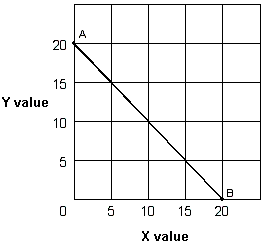
Straight line AB in Exhibit 1A-3 is a downward sloping line illustrating:
A) a direct relationship between X and Y.
B) an inverse relationship between X and Y.
C) X and Y are unrelated variables.
D) the ceteris paribus assumption.
Straight line AB in Exhibit 1A-3 is a downward sloping line illustrating:
A) a direct relationship between X and Y.
B) an inverse relationship between X and Y.
C) X and Y are unrelated variables.
D) the ceteris paribus assumption.
Question
Exhibit 1A-8 Straight line relationship
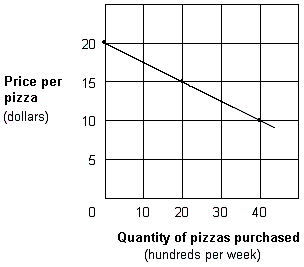
According to the Exhibit 1A-8, the relationship between the price and quantity purchased of pizza is:
A) direct.
B) inverse.
C) complex.
D) independent.
According to the Exhibit 1A-8, the relationship between the price and quantity purchased of pizza is:
A) direct.
B) inverse.
C) complex.
D) independent.
Question
Question
Exhibit 1A-7 Straight line relationship

According to Exhibit 1A-7, the relationship between annual income and air-travel expenditures is:
A) direct.
B) inverse.
C) complex.
D) independent.
According to Exhibit 1A-7, the relationship between annual income and air-travel expenditures is:
A) direct.
B) inverse.
C) complex.
D) independent.
Question
Question
Question
Question
Exhibit 1A-5 Straight line
In Exhibit 1A-5, as X increases along the horizontal axis, from point C to point D on the line, the Y values
A) increase so the relationship between X and Y is direct.
B) decrease so the relationship between X and Y is inverse.
C) remain unchanged so the relationship between X and Y is independent.
D) change so the relationship between X and Y is variable.
Question
Question
Question
Exhibit 1A-1 Straight line
In Exhibit 1A-1, as X increases along the horizontal axis, from point A to point B on the line, the Y values
A) increase so the relationship between X and Y is direct.
B) decrease so the relationship between X and Y is inverse.
C) remain unchanged so the relationship between X and Y is independent.
D) change so the relationship between X and Y is variable.
Question
Question
Question
Question
Question
Question
Exhibit 1A-1 Straight line

As shown in Exhibit 1A-1, the slope of straight line AB:
A) decreases with increases in X.
B) increases with increases in X.
C) increases with decreases in X.
D) remains constant with changes in X.
As shown in Exhibit 1A-1, the slope of straight line AB:
A) decreases with increases in X.
B) increases with increases in X.
C) increases with decreases in X.
D) remains constant with changes in X.
Question
Question
Question
Exhibit 1A-2 Straight line
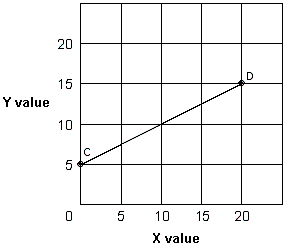
In Exhibit 1A-2, explain the slope of straight line CD.
A) As the X value increases by 20, the Y value increases by 5, so the slope is 4.
B) As the Y value increases by 5, the X value increases by 20, so the slope is 1/4.
C) As the X value increases by 10, the Y value increases by 5, so the slope is 2.
D) As the Y value increases by 5, the X value increases by 10, so the slope is 1/2.
Question
Question
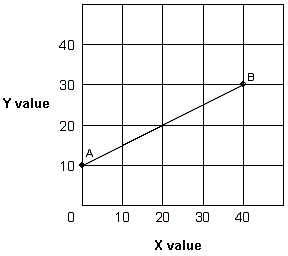
Exhibit 1A-4 Straight line

Straight line A-D in Exhibit 1A-4 shows that:
A) as the X value increases by 80, the Y value increases by 40 so the slope is 2.
B) as the Y value increases by 40, the X value increases by 80 so the slope is 1/2.
C) increasing values for X do not affect the value of Y.
D) increasing values for Y do not affect the value of X.
Question
Question
Exhibit 1A-8 Straight line relationship

Which of the following would cause a shift in the relationship shown in Exhibit 1A-8?
A) A fall in household incomes.
B) A fall in the price of pizza.
C) A fall in the quantity of pizza that people wish to purchase.
D) A rise in the price of pizza.
Which of the following would cause a shift in the relationship shown in Exhibit 1A-8?
A) A fall in household incomes.
B) A fall in the price of pizza.
C) A fall in the quantity of pizza that people wish to purchase.
D) A rise in the price of pizza.
Question
Exhibit 1A-5 Straight line

In Exhibit 1A-5, the slope for straight line CD is:
A) 5.
B) 1.
C) − 1.
D) − 5.
In Exhibit 1A-5, the slope for straight line CD is:
A) 5.
B) 1.
C) − 1.
D) − 5.
Question
Exhibit 1A-7 Straight line relationship
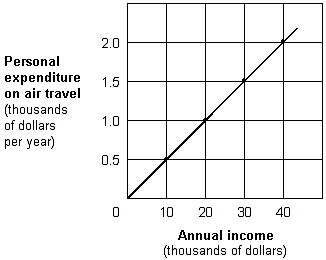
Which of the following would cause a shift in the relationship shown in Exhibit 1A-7?
A) A rise in people's annual income.
B) A rise in people's expenditure on air travel.
C) A rise in the price of air travel.
D) Nothing will shift the line in the graph.
Which of the following would cause a shift in the relationship shown in Exhibit 1A-7?
A) A rise in people's annual income.
B) A rise in people's expenditure on air travel.
C) A rise in the price of air travel.
D) Nothing will shift the line in the graph.
Question
Question
Exhibit 1A-10 Multi-curve graph
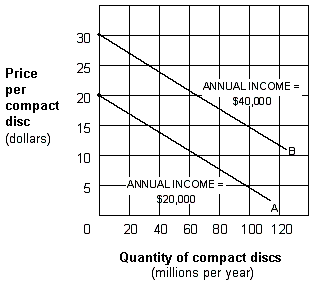
Exhibit 1A-10 represents a three-variable relationship. As the annual income of consumers rises from $20,000 (line A) to $40,000 (line B), the result is a:
A) rightward movement along each curve.
B) leftward movement along each curve.
C) leftward shift from curve B to curve A.
D) rightward shift from curve A to curve B.
Question
Exhibit 1A-1 Straight line

In Exhibit 1A-1, the slope of straight line AB is:
A) positive.
B) zero.
C) negative.
D) variable.
In Exhibit 1A-1, the slope of straight line AB is:
A) positive.
B) zero.
C) negative.
D) variable.
Question
Exhibit 1A-4 Straight line
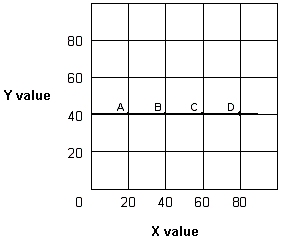
In Exhibit 1A-4, as X increases along the horizontal axis, corresponding to points A-D on the line, the Y value remains unchanged at 40 units. The relationship between the X and Y variables is:
A) direct.
B) inverse.
C) independent.
D) undefined.
In Exhibit 1A-4, as X increases along the horizontal axis, corresponding to points A-D on the line, the Y value remains unchanged at 40 units. The relationship between the X and Y variables is:
A) direct.
B) inverse.
C) independent.
D) undefined.
Question
Question
Exhibit 1A-7 Straight line relationship

Using the relationship shown in Exhibit 1A-7, suppose the price of air travel increases. How would you revise the graph to show this change?
A) Draw a new point on the graph upward and to the left.
B) Draw a new point on the graph downward and to the right.
C) Draw a new line on the graph.
D) Change the current line so that its slope is flatter.
Question
Exhibit 1A-8 Straight line relationship

For the relationship shown in Exhibit 1A-8, suppose the price of hamburgers increases and hamburgers are a substitute for pizza. What change would occur on the graph?
A) There will be a movement upward and to the left along the curve.
B) There will be a movement downward and to the right along the curve.
C) The curve will shift.
D) The slope of the curve will become steeper.
Question
Question
Exhibit 1A-9 Multi-curve graph
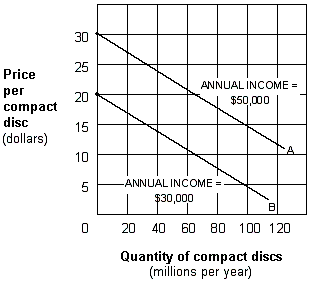
Exhibit 1A-9 represents a three-variable relationship. As the annual income of consumers falls from $50,000 (line A) to $30,000 (line B), the result is a:
A) rightward movement along each curve.
B) leftward movement along each curve,.
C) leftward shift from curve A to curve B.
D) rightward shift from curve B to curve A.
Question
Question
Question
Question
Question
Question
Question
Question
Question
Question
Exhibit 3A-2 Comparison of Market Efficiency and Deadweight Loss
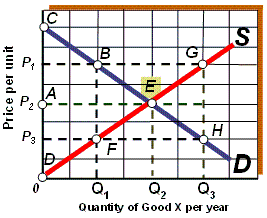
As shown in Exhibit 3A-2, if the market is in equilibrium, then total surplus is represented by
A) BGHF
B) CBEFDA
C) CBEA
D) AEFD
As shown in Exhibit 3A-2, if the market is in equilibrium, then total surplus is represented by
A) BGHF
B) CBEFDA
C) CBEA
D) AEFD
Question
Question
Exhibit 3A-2 Comparison of Market Efficiency and Deadweight Loss

As shown in Exhibit 3A-2, if the market price falls from P1 to P2, then:
A) total surplus increases.
B) deadweight loss increases.
C) overproduction increases.
D) underproduction decreases.
As shown in Exhibit 3A-2, if the market price falls from P1 to P2, then:
A) total surplus increases.
B) deadweight loss increases.
C) overproduction increases.
D) underproduction decreases.
Question
Question
Question
Question
Question
Exhibit 3A-1 Comparison of Market Efficiency and Deadweight Loss

As shown in Exhibit 3A-1, if the market is in equilibrium, then producer surplus is represented by:
A) ADFB.
B) CEFD.
C) EGH.
D) BEF.
As shown in Exhibit 3A-1, if the market is in equilibrium, then producer surplus is represented by:
A) ADFB.
B) CEFD.
C) EGH.
D) BEF.
Question
Question
Question
Question
Exhibit 3A-2 Comparison of Market Efficiency and Deadweight Loss

As shown in Exhibit 3A-2, if the market is in equilibrium, then total surplus is represented by:
A) ACBEFD - BEF
B) AEFD + ACBE
C) BEG + EFH
D) CBEFDA + EGH
As shown in Exhibit 3A-2, if the market is in equilibrium, then total surplus is represented by:
A) ACBEFD - BEF
B) AEFD + ACBE
C) BEG + EFH
D) CBEFDA + EGH
Question
Exhibit 3A-1 Comparison of Market Efficiency and Deadweight Loss
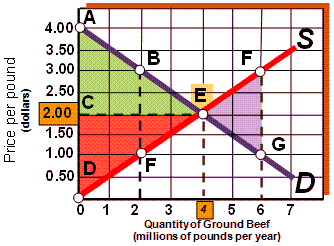
As shown in Exhibit 3A-1, if the market is in equilibrium, then ____ represents total surplus.
A) ABEFD
B) ABEC
C) EFG
D) BEF
As shown in Exhibit 3A-1, if the market is in equilibrium, then ____ represents total surplus.
A) ABEFD
B) ABEC
C) EFG
D) BEF
Question
Exhibit 3A-1 Comparison of Market Efficiency and Deadweight Loss

As shown in Exhibit 3A-1, if the market is in equilibrium, then total surplus is represented by:
A) ABEFD + EFG
B) ABEC + CEFD
C) CDFE + EFG
D) ABEFD - BEF
As shown in Exhibit 3A-1, if the market is in equilibrium, then total surplus is represented by:
A) ABEFD + EFG
B) ABEC + CEFD
C) CDFE + EFG
D) ABEFD - BEF
Question
Question
Question
Exhibit 3A-2 Comparison of Market Efficiency and Deadweight Loss

As shown in Exhibit 3A-2, if the quantity supplied of good X per year is Q1, the result is a deadweight loss represented by area:
A) BEG.
B) CBEFD.
C) EGH.
D) BEF.
As shown in Exhibit 3A-2, if the quantity supplied of good X per year is Q1, the result is a deadweight loss represented by area:
A) BEG.
B) CBEFD.
C) EGH.
D) BEF.
Question
Question
Exhibit 3A-2 Comparison of Market Efficiency and Deadweight Loss

As shown in Exhibit 3A-2, if the market price falls from P2 to P3, then:
A) total surplus increases.
B) deadweight loss decreases.
C) overproduction increases.
D) underproduction decreases.
As shown in Exhibit 3A-2, if the market price falls from P2 to P3, then:
A) total surplus increases.
B) deadweight loss decreases.
C) overproduction increases.
D) underproduction decreases.
Question
Question
Question
Question
Exhibit 3A-1 Comparison of Market Efficiency and Deadweight Loss

As shown in Exhibit 3A-1, if the market price falls from $2.00 to $1.00, then:
A) total surplus increases.
B) deadweight loss increases.
C) overproduction decreases.
D) underproduction decreases.
As shown in Exhibit 3A-1, if the market price falls from $2.00 to $1.00, then:
A) total surplus increases.
B) deadweight loss increases.
C) overproduction decreases.
D) underproduction decreases.
Question
Question
Exhibit 3A-2 Comparison of Market Efficiency and Deadweight Loss

As shown in Exhibit 3A-2, if the quantity supplied of good X per year is Q1, the result is:
A) deadweight loss.
B) efficiency.
C) overproduction.
D) equilibrium.
As shown in Exhibit 3A-2, if the quantity supplied of good X per year is Q1, the result is:
A) deadweight loss.
B) efficiency.
C) overproduction.
D) equilibrium.
Question
Exhibit 3A-2 Comparison of Market Efficiency and Deadweight Loss

As shown in Exhibit 3A-2, if the market price falls from P2 to P3, then:
A) consumer surplus increases.
B) producer surplus increases.
C) deadweight loss increases.
D) the market moves to an equilibrium price and quantity.
As shown in Exhibit 3A-2, if the market price falls from P2 to P3, then:
A) consumer surplus increases.
B) producer surplus increases.
C) deadweight loss increases.
D) the market moves to an equilibrium price and quantity.
Question
Question
Question
Question
Question
Exhibit 3A-1 Comparison of Market Efficiency and Deadweight Loss

As shown in Exhibit 3A-1, if the quantity supplied is 2 million pounds of ground beef per year, the result is a deadweight loss represented by area:
A) ABEC.
B) CEFD.
C) EGH.
D) BEF.
As shown in Exhibit 3A-1, if the quantity supplied is 2 million pounds of ground beef per year, the result is a deadweight loss represented by area:
A) ABEC.
B) CEFD.
C) EGH.
D) BEF.
Question

Unlock Deck
Sign up to unlock the cards in this deck!
Unlock Deck
Unlock Deck
1/172
Play
Full screen (f)
Deck 31: Understanding Direct and Inverse Relationships between Variables
1
Which of the following pairs is the most likely to exhibit a direct relationship?
A) The price of gasoline and the amount of gasoline that people purchase.
B) Cholesterol levels and the likelihood of developing heart disease.
C) Outdoor temperature and heating oil sales.
D) Annual income and weekly pawn shop visits.
A) The price of gasoline and the amount of gasoline that people purchase.
B) Cholesterol levels and the likelihood of developing heart disease.
C) Outdoor temperature and heating oil sales.
D) Annual income and weekly pawn shop visits.
B
2
Which of the following statements is correct?
A) Slope is the ratio of the vertical change (the rise or fall) to the horizontal change (the run).
B) A direct relationship is one in which two variables change in the opposite direction.
C) An inverse relationship is one in which two variables change in same directions.
D) An independent relationship is one in which two variables are upward sloping.
A
3
Suppose two variables are directly related. If one variable rises, then the other variable:
A) also rises.
B) falls.
C) remains unchanged.
D) reacts unpredictably.
A) also rises.
B) falls.
C) remains unchanged.
D) reacts unpredictably.
A
4
If the amount of time spent procrastinating and the performance on an exam are inversely related, then
A) more procrastination leads to lower exam grades.
B) more procrastination leads to higher exam grades.
C) a graph with this relationship would be positively sloped.
D) the slope of the line reflecting this relationship will be 0.
A) more procrastination leads to lower exam grades.
B) more procrastination leads to higher exam grades.
C) a graph with this relationship would be positively sloped.
D) the slope of the line reflecting this relationship will be 0.
Unlock Deck
Unlock for access to all 172 flashcards in this deck.
Unlock Deck
k this deck
5
Exhibit 1A-3 Straight line
Straight line AB in Exhibit 1A-3 is a downward sloping line illustrating:
A) a direct relationship between X and Y.
B) an inverse relationship between X and Y.
C) X and Y are unrelated variables.
D) the ceteris paribus assumption.
Straight line AB in Exhibit 1A-3 is a downward sloping line illustrating:
A) a direct relationship between X and Y.
B) an inverse relationship between X and Y.
C) X and Y are unrelated variables.
D) the ceteris paribus assumption.
Unlock Deck
Unlock for access to all 172 flashcards in this deck.
Unlock Deck
k this deck
6
Exhibit 1A-8 Straight line relationship
According to the Exhibit 1A-8, the relationship between the price and quantity purchased of pizza is:
A) direct.
B) inverse.
C) complex.
D) independent.
According to the Exhibit 1A-8, the relationship between the price and quantity purchased of pizza is:
A) direct.
B) inverse.
C) complex.
D) independent.
Unlock Deck
Unlock for access to all 172 flashcards in this deck.
Unlock Deck
k this deck
7
A direct relationship exists when:
A) there is no association between two variables.
B) one variable increases and there is no change in the other variable.
C) one variable increases and the other variable increases.
D) one variable increases and the other variable decreases.
A) there is no association between two variables.
B) one variable increases and there is no change in the other variable.
C) one variable increases and the other variable increases.
D) one variable increases and the other variable decreases.
Unlock Deck
Unlock for access to all 172 flashcards in this deck.
Unlock Deck
k this deck
8
Exhibit 1A-7 Straight line relationship
According to Exhibit 1A-7, the relationship between annual income and air-travel expenditures is:
A) direct.
B) inverse.
C) complex.
D) independent.
According to Exhibit 1A-7, the relationship between annual income and air-travel expenditures is:
A) direct.
B) inverse.
C) complex.
D) independent.
Unlock Deck
Unlock for access to all 172 flashcards in this deck.
Unlock Deck
k this deck
9
An upward-sloping line or curve is used to illustrate:
A) a direct relationship.
B) an inverse relationship.
C) two unrelated variables.
D) the ceteris paribus assumption.
A) a direct relationship.
B) an inverse relationship.
C) two unrelated variables.
D) the ceteris paribus assumption.
Unlock Deck
Unlock for access to all 172 flashcards in this deck.
Unlock Deck
k this deck
10
Graphically express a direct and an inverse or negative relationship. What could cause a shift in a line or curve expressing a relationship between two variables?
Unlock Deck
Unlock for access to all 172 flashcards in this deck.
Unlock Deck
k this deck
11
Measured between two points on a curve, the ratio of the change in the variable on the vertical axis to the change in the variable on the horizontal axis is the:
A) axis.
B) slope.
C) dependent curve.
D) independent curve.
A) axis.
B) slope.
C) dependent curve.
D) independent curve.
Unlock Deck
Unlock for access to all 172 flashcards in this deck.
Unlock Deck
k this deck
12
Exhibit 1A-5 Straight line
In Exhibit 1A-5, as X increases along the horizontal axis, from point C to point D on the line, the Y values
A) increase so the relationship between X and Y is direct.
B) decrease so the relationship between X and Y is inverse.
C) remain unchanged so the relationship between X and Y is independent.
D) change so the relationship between X and Y is variable.
Unlock Deck
Unlock for access to all 172 flashcards in this deck.
Unlock Deck
k this deck
13
When an inverse relationship is graphed, the resulting line or curve is:
A) horizontal.
B) vertical.
C) upward-sloping.
D) downward-sloping.
A) horizontal.
B) vertical.
C) upward-sloping.
D) downward-sloping.
Unlock Deck
Unlock for access to all 172 flashcards in this deck.
Unlock Deck
k this deck
14
If the amount of lemonade purchased and the outdoor temperature are directly related, then
A) when temperature rises, the amount of lemonade purchased rises.
B) a graph with this relationship would be negatively sloped.
C) sellers of lemonade hope for cooler temperatures.
D) the slope of the line reflecting this relationship will be 0.
A) when temperature rises, the amount of lemonade purchased rises.
B) a graph with this relationship would be negatively sloped.
C) sellers of lemonade hope for cooler temperatures.
D) the slope of the line reflecting this relationship will be 0.
Unlock Deck
Unlock for access to all 172 flashcards in this deck.
Unlock Deck
k this deck
15
Exhibit 1A-1 Straight line
In Exhibit 1A-1, as X increases along the horizontal axis, from point A to point B on the line, the Y values
A) increase so the relationship between X and Y is direct.
B) decrease so the relationship between X and Y is inverse.
C) remain unchanged so the relationship between X and Y is independent.
D) change so the relationship between X and Y is variable.
Unlock Deck
Unlock for access to all 172 flashcards in this deck.
Unlock Deck
k this deck
16
A direct relationship is expressed graphically as a:
A) positively sloped line or curve.
B) negatively sloped line or curve.
C) horizontal line.
D) vertical line.
A) positively sloped line or curve.
B) negatively sloped line or curve.
C) horizontal line.
D) vertical line.
Unlock Deck
Unlock for access to all 172 flashcards in this deck.
Unlock Deck
k this deck
17
Distinguish a direct and an inverse relationship. Provide an example of each type of relationship.
Unlock Deck
Unlock for access to all 172 flashcards in this deck.
Unlock Deck
k this deck
18
Which of the following pairs is the most likely to exhibit an inverse relationship?
A) The amount of time you study and your grade point average.
B) People's annual income and their expenditure on personal computers.
C) Baseball players' salaries and their batting averages.
D) The price of a concert and the number of tickets people purchase.
A) The amount of time you study and your grade point average.
B) People's annual income and their expenditure on personal computers.
C) Baseball players' salaries and their batting averages.
D) The price of a concert and the number of tickets people purchase.
Unlock Deck
Unlock for access to all 172 flashcards in this deck.
Unlock Deck
k this deck
19
Suppose two variables are inversely related. If one variable rises, then the other variable:
A) also rises.
B) falls.
C) remains unchanged.
D) reacts unpredictably.
A) also rises.
B) falls.
C) remains unchanged.
D) reacts unpredictably.
Unlock Deck
Unlock for access to all 172 flashcards in this deck.
Unlock Deck
k this deck
20
An inverse relationship exists when:
A) there is no association between two variables.
B) one variable increases and there is no change in the other variable.
C) one variable increases and the other variable increases.
D) one variable increases and the other variable decreases.
A) there is no association between two variables.
B) one variable increases and there is no change in the other variable.
C) one variable increases and the other variable increases.
D) one variable increases and the other variable decreases.
Unlock Deck
Unlock for access to all 172 flashcards in this deck.
Unlock Deck
k this deck
21
Exhibit 1A-1 Straight line
As shown in Exhibit 1A-1, the slope of straight line AB:
A) decreases with increases in X.
B) increases with increases in X.
C) increases with decreases in X.
D) remains constant with changes in X.
As shown in Exhibit 1A-1, the slope of straight line AB:
A) decreases with increases in X.
B) increases with increases in X.
C) increases with decreases in X.
D) remains constant with changes in X.
Unlock Deck
Unlock for access to all 172 flashcards in this deck.
Unlock Deck
k this deck
22
Consumer surplus measures the value between the price consumers are willing to pay and the:
A) producer surplus price.
B) deadweight gain price.
C) actual price paid.
D) preference price.
A) producer surplus price.
B) deadweight gain price.
C) actual price paid.
D) preference price.
Unlock Deck
Unlock for access to all 172 flashcards in this deck.
Unlock Deck
k this deck
23
Assume there is a relationship between two variables and the other-variables-held constant assumption (ceteris paribus) is relaxed. We would expect that the line representing this relationship would:
A) change from inverse to direct.
B) change from direct to inverse.
C) have a greater number of data points.
D) change its location.
A) change from inverse to direct.
B) change from direct to inverse.
C) have a greater number of data points.
D) change its location.
Unlock Deck
Unlock for access to all 172 flashcards in this deck.
Unlock Deck
k this deck
24
Exhibit 1A-2 Straight line
In Exhibit 1A-2, explain the slope of straight line CD.
A) As the X value increases by 20, the Y value increases by 5, so the slope is 4.
B) As the Y value increases by 5, the X value increases by 20, so the slope is 1/4.
C) As the X value increases by 10, the Y value increases by 5, so the slope is 2.
D) As the Y value increases by 5, the X value increases by 10, so the slope is 1/2.
Unlock Deck
Unlock for access to all 172 flashcards in this deck.
Unlock Deck
k this deck
25
A drought destroys much of the peach crop. As a result, consumer surplus in the peach market:
A) increases.
B) decreases.
C) remains unchanged.
D) equals the deadweight loss increase.
A) increases.
B) decreases.
C) remains unchanged.
D) equals the deadweight loss increase.
Unlock Deck
Unlock for access to all 172 flashcards in this deck.
Unlock Deck
k this deck
26
Exhibit 1A-4 Straight line
Straight line A-D in Exhibit 1A-4 shows that:
A) as the X value increases by 80, the Y value increases by 40 so the slope is 2.
B) as the Y value increases by 40, the X value increases by 80 so the slope is 1/2.
C) increasing values for X do not affect the value of Y.
D) increasing values for Y do not affect the value of X.
Unlock Deck
Unlock for access to all 172 flashcards in this deck.
Unlock Deck
k this deck
27
Suppose Sam buys a good for $100 at a yard sale. If consumer surplus from the sale is $75, Sam would have been willing to pay:
A) $100.
B) $175.
C) $25.
D) equal to the deadweight loss.
A) $100.
B) $175.
C) $25.
D) equal to the deadweight loss.
Unlock Deck
Unlock for access to all 172 flashcards in this deck.
Unlock Deck
k this deck
28
Exhibit 1A-8 Straight line relationship
Which of the following would cause a shift in the relationship shown in Exhibit 1A-8?
A) A fall in household incomes.
B) A fall in the price of pizza.
C) A fall in the quantity of pizza that people wish to purchase.
D) A rise in the price of pizza.
Which of the following would cause a shift in the relationship shown in Exhibit 1A-8?
A) A fall in household incomes.
B) A fall in the price of pizza.
C) A fall in the quantity of pizza that people wish to purchase.
D) A rise in the price of pizza.
Unlock Deck
Unlock for access to all 172 flashcards in this deck.
Unlock Deck
k this deck
29
Exhibit 1A-5 Straight line
In Exhibit 1A-5, the slope for straight line CD is:
A) 5.
B) 1.
C) − 1.
D) − 5.
In Exhibit 1A-5, the slope for straight line CD is:
A) 5.
B) 1.
C) − 1.
D) − 5.
Unlock Deck
Unlock for access to all 172 flashcards in this deck.
Unlock Deck
k this deck
30
Exhibit 1A-7 Straight line relationship
Which of the following would cause a shift in the relationship shown in Exhibit 1A-7?
A) A rise in people's annual income.
B) A rise in people's expenditure on air travel.
C) A rise in the price of air travel.
D) Nothing will shift the line in the graph.
Which of the following would cause a shift in the relationship shown in Exhibit 1A-7?
A) A rise in people's annual income.
B) A rise in people's expenditure on air travel.
C) A rise in the price of air travel.
D) Nothing will shift the line in the graph.
Unlock Deck
Unlock for access to all 172 flashcards in this deck.
Unlock Deck
k this deck
31
Using supply and demand curve analysis, the triangular area above the equilibrium price and under the demand curve is:
A) consumer surplus.
B) producer surplus.
C) marginal cost.
D) deadweight loss.
A) consumer surplus.
B) producer surplus.
C) marginal cost.
D) deadweight loss.
Unlock Deck
Unlock for access to all 172 flashcards in this deck.
Unlock Deck
k this deck
32
Exhibit 1A-10 Multi-curve graph
Exhibit 1A-10 represents a three-variable relationship. As the annual income of consumers rises from $20,000 (line A) to $40,000 (line B), the result is a:
A) rightward movement along each curve.
B) leftward movement along each curve.
C) leftward shift from curve B to curve A.
D) rightward shift from curve A to curve B.
Unlock Deck
Unlock for access to all 172 flashcards in this deck.
Unlock Deck
k this deck
33
Exhibit 1A-1 Straight line
In Exhibit 1A-1, the slope of straight line AB is:
A) positive.
B) zero.
C) negative.
D) variable.
In Exhibit 1A-1, the slope of straight line AB is:
A) positive.
B) zero.
C) negative.
D) variable.
Unlock Deck
Unlock for access to all 172 flashcards in this deck.
Unlock Deck
k this deck
34
Exhibit 1A-4 Straight line
In Exhibit 1A-4, as X increases along the horizontal axis, corresponding to points A-D on the line, the Y value remains unchanged at 40 units. The relationship between the X and Y variables is:
A) direct.
B) inverse.
C) independent.
D) undefined.
In Exhibit 1A-4, as X increases along the horizontal axis, corresponding to points A-D on the line, the Y value remains unchanged at 40 units. The relationship between the X and Y variables is:
A) direct.
B) inverse.
C) independent.
D) undefined.
Unlock Deck
Unlock for access to all 172 flashcards in this deck.
Unlock Deck
k this deck
35
Which of the following is used to illustrate an independent relationship between two variables?
A) An upward-sloping curve
B) A downward-sloping curve
C) A hill-shaped curve
D) A horizontal or vertical line
A) An upward-sloping curve
B) A downward-sloping curve
C) A hill-shaped curve
D) A horizontal or vertical line
Unlock Deck
Unlock for access to all 172 flashcards in this deck.
Unlock Deck
k this deck
36
Exhibit 1A-7 Straight line relationship
Using the relationship shown in Exhibit 1A-7, suppose the price of air travel increases. How would you revise the graph to show this change?
A) Draw a new point on the graph upward and to the left.
B) Draw a new point on the graph downward and to the right.
C) Draw a new line on the graph.
D) Change the current line so that its slope is flatter.
Unlock Deck
Unlock for access to all 172 flashcards in this deck.
Unlock Deck
k this deck
37
Exhibit 1A-8 Straight line relationship
For the relationship shown in Exhibit 1A-8, suppose the price of hamburgers increases and hamburgers are a substitute for pizza. What change would occur on the graph?
A) There will be a movement upward and to the left along the curve.
B) There will be a movement downward and to the right along the curve.
C) The curve will shift.
D) The slope of the curve will become steeper.
Unlock Deck
Unlock for access to all 172 flashcards in this deck.
Unlock Deck
k this deck
38
Suppose Sue's buys a good for $60 on eBay. If the consumer surplus from the sale is $25, Sue would have been willing to pay:
A) $35.
B) $25.
C) $60.
D) $85.
A) $35.
B) $25.
C) $60.
D) $85.
Unlock Deck
Unlock for access to all 172 flashcards in this deck.
Unlock Deck
k this deck
39
Exhibit 1A-9 Multi-curve graph
Exhibit 1A-9 represents a three-variable relationship. As the annual income of consumers falls from $50,000 (line A) to $30,000 (line B), the result is a:
A) rightward movement along each curve.
B) leftward movement along each curve,.
C) leftward shift from curve A to curve B.
D) rightward shift from curve B to curve A.
Unlock Deck
Unlock for access to all 172 flashcards in this deck.
Unlock Deck
k this deck
40
A shift in a curve represents a change in:
A) the variable on the horizontal axis.
B) the variable on the vertical axis.
C) a third variable that is not on either axis.
D) any variable that is relevant to the relationship being graphed.
A) the variable on the horizontal axis.
B) the variable on the vertical axis.
C) a third variable that is not on either axis.
D) any variable that is relevant to the relationship being graphed.
Unlock Deck
Unlock for access to all 172 flashcards in this deck.
Unlock Deck
k this deck
41
Producer surplus measures the value between the actual selling price and the:
A) price at which sellers are willing to sell the product.
B) deadweight loss price.
C) lowest price sellers are willing to sell the product.
D) profit-maximization price.
A) price at which sellers are willing to sell the product.
B) deadweight loss price.
C) lowest price sellers are willing to sell the product.
D) profit-maximization price.
Unlock Deck
Unlock for access to all 172 flashcards in this deck.
Unlock Deck
k this deck
42
Using supply and demand curve analysis, the triangular area below the equilibrium price and above the supply curve is:
A) consumer surplus.
B) producer surplus.
C) marginal cost.
D) deadweight loss.
A) consumer surplus.
B) producer surplus.
C) marginal cost.
D) deadweight loss.
Unlock Deck
Unlock for access to all 172 flashcards in this deck.
Unlock Deck
k this deck
43
Suppose Gizmo Inc. is willing to sell one gizmo for $10, a second gizmo for $12, a third for $14, and a fourth for $20, and the market price is $20. What is Gizmo Inc.'s producer surplus?
A) $56
B) $24
C) $20
D) $10
A) $56
B) $24
C) $20
D) $10
Unlock Deck
Unlock for access to all 172 flashcards in this deck.
Unlock Deck
k this deck
44
Suppose a consumer is willing to pay $20 for one unit of good X, $10 for a second, and $5 for a third, and the market price is $4. The consumer surplus is:
A) $16.
B) $6.
C) $1.
D) $23.
A) $16.
B) $6.
C) $1.
D) $23.
Unlock Deck
Unlock for access to all 172 flashcards in this deck.
Unlock Deck
k this deck
45
If Sam is willing to pay $50 for one unit of good X, $30 for a second, $20 for a third, $8 for a fourth, and the market price is $10, then Sam's consumer surplus is:
A) $40 and he buys 1 unit of good X.
B) $60 and he buys 2 units of good X.
C) $70 and he buys 3 units of good X
D) $68 and he buys 4 units of good X.
A) $40 and he buys 1 unit of good X.
B) $60 and he buys 2 units of good X.
C) $70 and he buys 3 units of good X
D) $68 and he buys 4 units of good X.
Unlock Deck
Unlock for access to all 172 flashcards in this deck.
Unlock Deck
k this deck
46
Suppose Jones sells a good for $100 at a yard sale. If the producer surplus from the sale is $75, Jones's cost of the good must have been:
A) $100.
B) $175.
C) $25.
D) equal to the deadweight loss.
A) $100.
B) $175.
C) $25.
D) equal to the deadweight loss.
Unlock Deck
Unlock for access to all 172 flashcards in this deck.
Unlock Deck
k this deck
47
Total surplus equals:
A) consumer surplus + producer surplus − deadweight loss.
B) consumer surplus − producer surplus − deadweight loss.
C) consumer surplus − producer surplus + deadweight loss.
D) consumer surplus + producer surplus.
A) consumer surplus + producer surplus − deadweight loss.
B) consumer surplus − producer surplus − deadweight loss.
C) consumer surplus − producer surplus + deadweight loss.
D) consumer surplus + producer surplus.
Unlock Deck
Unlock for access to all 172 flashcards in this deck.
Unlock Deck
k this deck
48
Consumer surplus:
A) is minimized in market equilibrium.
B) measures the value between the actual selling price of a product and the price at which sellers are willing to sell the product.
C) measures the value between the price consumers are willing to pay for a product and the price they actually pay.
D) measures the price at which sellers extract excess profits from consumers.
Unlock Deck
Unlock for access to all 172 flashcards in this deck.
Unlock Deck
k this deck
49
Exhibit 3A-2 Comparison of Market Efficiency and Deadweight Loss
As shown in Exhibit 3A-2, if the market is in equilibrium, then total surplus is represented by
A) BGHF
B) CBEFDA
C) CBEA
D) AEFD
As shown in Exhibit 3A-2, if the market is in equilibrium, then total surplus is represented by
A) BGHF
B) CBEFDA
C) CBEA
D) AEFD
Unlock Deck
Unlock for access to all 172 flashcards in this deck.
Unlock Deck
k this deck
50
Which of the following statements is not correct?
A) Total surplus is the sum of consumer and producer surplus.
B) Deadweight loss is the net loss of both consumer and producer surplus resulting from underproduction or overproduction of a product.
C) Deadweight loss is a measure of market inefficiency.
D) Total surplus is maximized when the actual quantity supplied exceeds the equilibrium quantity.
Unlock Deck
Unlock for access to all 172 flashcards in this deck.
Unlock Deck
k this deck
51
Exhibit 3A-2 Comparison of Market Efficiency and Deadweight Loss
As shown in Exhibit 3A-2, if the market price falls from P1 to P2, then:
A) total surplus increases.
B) deadweight loss increases.
C) overproduction increases.
D) underproduction decreases.
As shown in Exhibit 3A-2, if the market price falls from P1 to P2, then:
A) total surplus increases.
B) deadweight loss increases.
C) overproduction increases.
D) underproduction decreases.
Unlock Deck
Unlock for access to all 172 flashcards in this deck.
Unlock Deck
k this deck
52
Consumer surplus:
A) does not exist in equilibrium.
B) is illustrated by the area under the demand curve and above the market price.
C) is illustrated by the area under the demand curve and below the market price.
D) is illustrated by the area above the supply curve and under the demand curve.
A) does not exist in equilibrium.
B) is illustrated by the area under the demand curve and above the market price.
C) is illustrated by the area under the demand curve and below the market price.
D) is illustrated by the area above the supply curve and under the demand curve.
Unlock Deck
Unlock for access to all 172 flashcards in this deck.
Unlock Deck
k this deck
53
Suppose seller X is willing to sell one good X for $5, a second good X for $10, a third for $16, a fourth for $25, and the market price is $20. What is seller X's producer surplus?
A) $15
B) $20
C) $22
D) $29
A) $15
B) $20
C) $22
D) $29
Unlock Deck
Unlock for access to all 172 flashcards in this deck.
Unlock Deck
k this deck
54
Deadweight loss is not the result of:
A) an efficient market.
B) an inefficient market.
C) zero consumer surplus.
D) zero producer surplus.
A) an efficient market.
B) an inefficient market.
C) zero consumer surplus.
D) zero producer surplus.
Unlock Deck
Unlock for access to all 172 flashcards in this deck.
Unlock Deck
k this deck
55
Producer surplus is the:
A) amount by which the quantity supplied of a good exceeds the quantity demanded of a good.
B) value of the sum of producers' willingness to sell a good plus the price of the good.
C) measure of how much producers value a good.
D) value of the difference between the actual selling price of a good and the price producers are willing to sell it for on the supply curve.
Unlock Deck
Unlock for access to all 172 flashcards in this deck.
Unlock Deck
k this deck
56
Exhibit 3A-1 Comparison of Market Efficiency and Deadweight Loss
As shown in Exhibit 3A-1, if the market is in equilibrium, then producer surplus is represented by:
A) ADFB.
B) CEFD.
C) EGH.
D) BEF.
As shown in Exhibit 3A-1, if the market is in equilibrium, then producer surplus is represented by:
A) ADFB.
B) CEFD.
C) EGH.
D) BEF.
Unlock Deck
Unlock for access to all 172 flashcards in this deck.
Unlock Deck
k this deck
57
Suppose Alice sells a good for $60 on eBay. If the producer surplus from the sale is $25, Alice's cost of the good must have been:
A) $35.
B) $25.
C) $60.
D) $85.
A) $35.
B) $25.
C) $60.
D) $85.
Unlock Deck
Unlock for access to all 172 flashcards in this deck.
Unlock Deck
k this deck
58
Assuming peaches are a normal good and consumer incomes rise, producer surplus in the peach market:
A) increases.
B) decreases.
C) remains unchanged.
D) equals the deadweight loss increase.
A) increases.
B) decreases.
C) remains unchanged.
D) equals the deadweight loss increase.
Unlock Deck
Unlock for access to all 172 flashcards in this deck.
Unlock Deck
k this deck
59
In an efficient market, deadweight loss is ____.
A) maximum.
B) minimum.
C) constant.
D) zero.
A) maximum.
B) minimum.
C) constant.
D) zero.
Unlock Deck
Unlock for access to all 172 flashcards in this deck.
Unlock Deck
k this deck
60
Exhibit 3A-2 Comparison of Market Efficiency and Deadweight Loss
As shown in Exhibit 3A-2, if the market is in equilibrium, then total surplus is represented by:
A) ACBEFD - BEF
B) AEFD + ACBE
C) BEG + EFH
D) CBEFDA + EGH
As shown in Exhibit 3A-2, if the market is in equilibrium, then total surplus is represented by:
A) ACBEFD - BEF
B) AEFD + ACBE
C) BEG + EFH
D) CBEFDA + EGH
Unlock Deck
Unlock for access to all 172 flashcards in this deck.
Unlock Deck
k this deck
61
Exhibit 3A-1 Comparison of Market Efficiency and Deadweight Loss
As shown in Exhibit 3A-1, if the market is in equilibrium, then ____ represents total surplus.
A) ABEFD
B) ABEC
C) EFG
D) BEF
As shown in Exhibit 3A-1, if the market is in equilibrium, then ____ represents total surplus.
A) ABEFD
B) ABEC
C) EFG
D) BEF
Unlock Deck
Unlock for access to all 172 flashcards in this deck.
Unlock Deck
k this deck
62
Exhibit 3A-1 Comparison of Market Efficiency and Deadweight Loss
As shown in Exhibit 3A-1, if the market is in equilibrium, then total surplus is represented by:
A) ABEFD + EFG
B) ABEC + CEFD
C) CDFE + EFG
D) ABEFD - BEF
As shown in Exhibit 3A-1, if the market is in equilibrium, then total surplus is represented by:
A) ABEFD + EFG
B) ABEC + CEFD
C) CDFE + EFG
D) ABEFD - BEF
Unlock Deck
Unlock for access to all 172 flashcards in this deck.
Unlock Deck
k this deck
63
The slope of an indifference curve is equal to the ratio of the ____ of the good on the horizontal axis to the ____ of the good on the vertical axis.
A) marginal product; marginal product
B) marginal utility; marginal utility
C) price; price
D) total utility; price
A) marginal product; marginal product
B) marginal utility; marginal utility
C) price; price
D) total utility; price
Unlock Deck
Unlock for access to all 172 flashcards in this deck.
Unlock Deck
k this deck
64
Along an indifference curve for goods X and Y, the vertical and horizontal axes measure the:
A) prices of X and Y.
B) total utilities of X and Y.
C) quantities of X and Y.
D) marginal utilities of X and Y.
A) prices of X and Y.
B) total utilities of X and Y.
C) quantities of X and Y.
D) marginal utilities of X and Y.
Unlock Deck
Unlock for access to all 172 flashcards in this deck.
Unlock Deck
k this deck
65
Exhibit 3A-2 Comparison of Market Efficiency and Deadweight Loss
As shown in Exhibit 3A-2, if the quantity supplied of good X per year is Q1, the result is a deadweight loss represented by area:
A) BEG.
B) CBEFD.
C) EGH.
D) BEF.
As shown in Exhibit 3A-2, if the quantity supplied of good X per year is Q1, the result is a deadweight loss represented by area:
A) BEG.
B) CBEFD.
C) EGH.
D) BEF.
Unlock Deck
Unlock for access to all 172 flashcards in this deck.
Unlock Deck
k this deck
66
An indifference map states:
A) indifference curves farther from the origin yield higher levels of total utility.
B) that the consumer's income varies with the level of the indifference curve.
C) indifference curves closer to the origin yield higher levels of total utility.
D) that the points on either parts of indifference curves are preferred to the midpoint.
Unlock Deck
Unlock for access to all 172 flashcards in this deck.
Unlock Deck
k this deck
67
Exhibit 3A-2 Comparison of Market Efficiency and Deadweight Loss
As shown in Exhibit 3A-2, if the market price falls from P2 to P3, then:
A) total surplus increases.
B) deadweight loss decreases.
C) overproduction increases.
D) underproduction decreases.
As shown in Exhibit 3A-2, if the market price falls from P2 to P3, then:
A) total surplus increases.
B) deadweight loss decreases.
C) overproduction increases.
D) underproduction decreases.
Unlock Deck
Unlock for access to all 172 flashcards in this deck.
Unlock Deck
k this deck
68
At the equilibrium price, deadweight loss is:
A) minimized.
B) zero.
C) maximized.
D) equal to the equilibrium price multiplied by the quantity exchanged.
A) minimized.
B) zero.
C) maximized.
D) equal to the equilibrium price multiplied by the quantity exchanged.
Unlock Deck
Unlock for access to all 172 flashcards in this deck.
Unlock Deck
k this deck
69
If Max's marginal rate of substitution for goods A and B is 3, then
A) the price of good A exceeds the price of good B.
B) the marginal utility of good A is 3 and the marginal utility of good B is 3.
C) the ratio of the total utilities of good A and good B is 3.
D) Max is willing to give up 3 units of good A for 1 unit of good B.
A) the price of good A exceeds the price of good B.
B) the marginal utility of good A is 3 and the marginal utility of good B is 3.
C) the ratio of the total utilities of good A and good B is 3.
D) Max is willing to give up 3 units of good A for 1 unit of good B.
Unlock Deck
Unlock for access to all 172 flashcards in this deck.
Unlock Deck
k this deck
70
An indifference curve is:
A) downward sloping and concave to the origin.
B) downward sloping and convex to the origin.
C) upward sloping and concave to the origin.
D) upward sloping and convex to the origin.
A) downward sloping and concave to the origin.
B) downward sloping and convex to the origin.
C) upward sloping and concave to the origin.
D) upward sloping and convex to the origin.
Unlock Deck
Unlock for access to all 172 flashcards in this deck.
Unlock Deck
k this deck
71
Exhibit 3A-1 Comparison of Market Efficiency and Deadweight Loss
As shown in Exhibit 3A-1, if the market price falls from $2.00 to $1.00, then:
A) total surplus increases.
B) deadweight loss increases.
C) overproduction decreases.
D) underproduction decreases.
As shown in Exhibit 3A-1, if the market price falls from $2.00 to $1.00, then:
A) total surplus increases.
B) deadweight loss increases.
C) overproduction decreases.
D) underproduction decreases.
Unlock Deck
Unlock for access to all 172 flashcards in this deck.
Unlock Deck
k this deck
72
Moving downward along an indifference curve causes a(n)
A) reduction in the total utility a consumer receives.
B) loss in the marginal utility of one good but an equal increase in the marginal utility of the other good.
C) increase in the marginal utility of both goods.
D) decrease in the price of one good and an increase in the price of the other good.
A) reduction in the total utility a consumer receives.
B) loss in the marginal utility of one good but an equal increase in the marginal utility of the other good.
C) increase in the marginal utility of both goods.
D) decrease in the price of one good and an increase in the price of the other good.
Unlock Deck
Unlock for access to all 172 flashcards in this deck.
Unlock Deck
k this deck
73
Exhibit 3A-2 Comparison of Market Efficiency and Deadweight Loss
As shown in Exhibit 3A-2, if the quantity supplied of good X per year is Q1, the result is:
A) deadweight loss.
B) efficiency.
C) overproduction.
D) equilibrium.
As shown in Exhibit 3A-2, if the quantity supplied of good X per year is Q1, the result is:
A) deadweight loss.
B) efficiency.
C) overproduction.
D) equilibrium.
Unlock Deck
Unlock for access to all 172 flashcards in this deck.
Unlock Deck
k this deck
74
Exhibit 3A-2 Comparison of Market Efficiency and Deadweight Loss
As shown in Exhibit 3A-2, if the market price falls from P2 to P3, then:
A) consumer surplus increases.
B) producer surplus increases.
C) deadweight loss increases.
D) the market moves to an equilibrium price and quantity.
As shown in Exhibit 3A-2, if the market price falls from P2 to P3, then:
A) consumer surplus increases.
B) producer surplus increases.
C) deadweight loss increases.
D) the market moves to an equilibrium price and quantity.
Unlock Deck
Unlock for access to all 172 flashcards in this deck.
Unlock Deck
k this deck
75
The net loss of consumer and producer surplus from underproduction or overproduction is called:
A) government revenue.
B) total surplus.
C) efficiency.
D) deadweight loss.
A) government revenue.
B) total surplus.
C) efficiency.
D) deadweight loss.
Unlock Deck
Unlock for access to all 172 flashcards in this deck.
Unlock Deck
k this deck
76
The absolute value of the slope of an indifference curve is called the:
A) marginal rate of transformation.
B) transitivity slope.
C) indifference rate of preference.
D) marginal rate of substitution.
A) marginal rate of transformation.
B) transitivity slope.
C) indifference rate of preference.
D) marginal rate of substitution.
Unlock Deck
Unlock for access to all 172 flashcards in this deck.
Unlock Deck
k this deck
77
When quantities of two goods belong to the same indifference curve, which of the following is true ?
A) The combinations of the two goods along the indifference curve yield the same total utility.
B) Prices of the two goods are equal.
C) Marginal utilities of both goods are equal.
D) The total utility of all combinations above the curve equal zero.
A) The combinations of the two goods along the indifference curve yield the same total utility.
B) Prices of the two goods are equal.
C) Marginal utilities of both goods are equal.
D) The total utility of all combinations above the curve equal zero.
Unlock Deck
Unlock for access to all 172 flashcards in this deck.
Unlock Deck
k this deck
78
Which of the following is not a result if the quantity supplied exceeds the quantity demanded in a market?
A) Deadweight loss
B) Inefficiency
C) Overproduction
D) Shortage
A) Deadweight loss
B) Inefficiency
C) Overproduction
D) Shortage
Unlock Deck
Unlock for access to all 172 flashcards in this deck.
Unlock Deck
k this deck
79
Exhibit 3A-1 Comparison of Market Efficiency and Deadweight Loss
As shown in Exhibit 3A-1, if the quantity supplied is 2 million pounds of ground beef per year, the result is a deadweight loss represented by area:
A) ABEC.
B) CEFD.
C) EGH.
D) BEF.
As shown in Exhibit 3A-1, if the quantity supplied is 2 million pounds of ground beef per year, the result is a deadweight loss represented by area:
A) ABEC.
B) CEFD.
C) EGH.
D) BEF.
Unlock Deck
Unlock for access to all 172 flashcards in this deck.
Unlock Deck
k this deck
80
If the slope of the indifference curve for goods X and Y is -2, then the marginal rate of substitution is
A) 0.
B) 1/2.
C) 2.
D) infinite.
A) 0.
B) 1/2.
C) 2.
D) infinite.
Unlock Deck
Unlock for access to all 172 flashcards in this deck.
Unlock Deck
k this deck
Unlock Deck
Unlock for access to all 172 flashcards in this deck.


