Deck 7: Statistical Inference
Full screen (f)
Question
Question
Question
Question
Question
Question
Question
Question
Question
Question
Question
Which of the following is the test statistic for a one-sample test for mean when the population standard deviation is unknown? 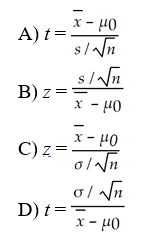
Question
Question
Question
Question
Question
The average cost for the sample of 5 sales of a product is  =$230 and the sample standard deviation is s = $17.50.The hypothesized mean is μ₀= $250.Compute the value of the test statistic.
A)-2.56
B)-4.00
C)-1.67
D)-3.87
=$230 and the sample standard deviation is s = $17.50.The hypothesized mean is μ₀= $250.Compute the value of the test statistic.A)-2.56
B)-4.00
C)-1.67
D)-3.87
Question
Question
Question
Question
Question
Use the data given below to answer the following question(s).
The following extract from a manufacturer's database shows a sample of 10 suppliers, their transportation charges, and the estimated and actual total costs of supplying materials.(Note: Assume a significance level of 0.05 wherever necessary.)
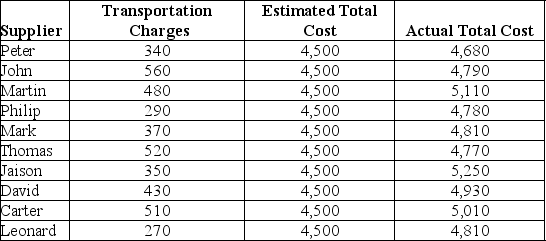
On studying the database, the manufacturer found out that the average difference between the estimated and actual total costs was $426.Based on the sample data, can the manufacturer conclude that the average difference between the estimated and actual total costs is different from zero?
The following extract from a manufacturer's database shows a sample of 10 suppliers, their transportation charges, and the estimated and actual total costs of supplying materials.(Note: Assume a significance level of 0.05 wherever necessary.)
On studying the database, the manufacturer found out that the average difference between the estimated and actual total costs was $426.Based on the sample data, can the manufacturer conclude that the average difference between the estimated and actual total costs is different from zero?
Question
Question
Question
Question
In a two-sample test for differences in means, the hypotheses are of the form:
A)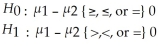
B)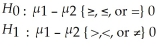
C)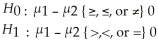
D)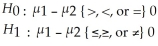
A)
B)
C)
D)
Question
Question
Use the data given below to answer the following question(s).
The following extract from a manufacturer's database shows a sample of 10 suppliers, their transportation charges, and the estimated and actual total costs of supplying materials.(Note: Assume a significance level of 0.05 wherever necessary.)
Conduct the appropriate type of one-sample test-statistic to determine whether the average transportation charge is less than $430.
Question
Question
Question
Question
Question
Use the data given below to answer the following question(s).
In a lower one-tailed hypothesis test, chosen level of significance = 0.10, true mean = 30, sample size = 55, and t-test statistic = -1.76.
Which of the following computes the test statistic for a one-sample test for proportions?
A)z =
B)z =
C)z =
D)z =
In a lower one-tailed hypothesis test, chosen level of significance = 0.10, true mean = 30, sample size = 55, and t-test statistic = -1.76.
Which of the following computes the test statistic for a one-sample test for proportions?
A)z =
B)z =
C)z =
D)z =
Question
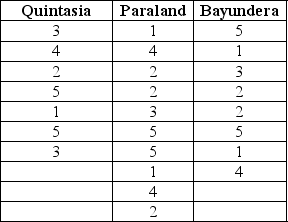
During a study, individuals were asked to rate a product on a scale of 1-5.From the following data, help the researcher determine whether any significant differences exist in opinions among individuals from different regions.(Note: Assume a significance level of 0.05 wherever necessary.)
Question
Question
Question
While testing for equality of variances, which of the following formulae gives the F-test statistic? 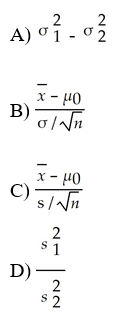
Question
Question
Question
Using the following data, test for the independence of the variables.(Note: Assume a significance level of 0.05 wherever necessary.)
Question
Use the data given below to answer the following question(s).
The following extract from a manufacturer's database shows a sample of 10 suppliers, their transportation charges, and the estimated and actual total costs of supplying materials.(Note: Assume a significance level of 0.05 wherever necessary.)
Conduct the appropriate type of one-sample test-statistic to determine whether the average transportation charge is less than $430.Apply a decision rule using the observed level of significance and draw a conclusion.
Question
Question
Question
Question
Question
Question
Question
Question
Question
Question

Unlock Deck
Sign up to unlock the cards in this deck!
Unlock Deck
Unlock Deck
1/50
Play
Full screen (f)
Deck 7: Statistical Inference
1
A manufacturer wishes to determine if the average profit from the sale of his product exceeds $6,710.Which of the following is the appropriate hypothesis test?
A)H₀: population mean profit from sale > $6,710 vs.H₁: population mean profit from sale ≤ $6,710
B)H₀: population mean profit from sale ≤ $6,710 vs.H₁: population mean profit from sale > $6,710
C)H₀: population mean profit from sale < $6,710 vs.H₁: population mean profit from sale ≥ $6,710
D)H₀: population mean profit from sale ≥ $6,710 vs.H₁: population mean profit from sale < $6,710
B
2
Which of the following is true about one-tailed and two-tailed tests?
A)For standard normal and t-distributions, which have a mean of zero, lower-tail critical values are negative and upper-tail critical values are positive.
B)For an upper one-tailed test, if the test statistic is greater than the critical value, the decision would fail to reject the null hypothesis.
C)For a lower one-tailed test, if the test statistic is less than the critical value, thse decision would be to fail to reject the null hypothesis.
D)For a two-tailed test, if the test statistic is either greater than the upper critical value or less than the lower critical value, the decision would be to fail to reject the null hypothesis.
A
3
Which of the following denotes the power of the test?
A)α
B)1 - β
C)β
D)1 - α
A)α
B)1 - β
C)β
D)1 - α
B
4
Which of the following probabilities gives the confidence coefficient?
A)P(rejecting H₀ | H₀ is true)
B)P(not rejecting H₀ | H₀ is false)
C)P(rejecting H₀ | H₀ is false)
D)P(not rejecting H₀ | H₀ is true)
A)P(rejecting H₀ | H₀ is true)
B)P(not rejecting H₀ | H₀ is false)
C)P(rejecting H₀ | H₀ is false)
D)P(not rejecting H₀ | H₀ is true)
Unlock Deck
Unlock for access to all 50 flashcards in this deck.
Unlock Deck
k this deck
5
Which of the following is a Type I error?
A)the null hypothesis is actually true, and the hypothesis test correctly fails to reject it
B)the null hypothesis is actually false, but the test incorrectly fails to reject it
C)the null hypothesis is actually false, and the test correctly rejects it
D)the null hypothesis is actually true, but the hypothesis test incorrectly rejects it
Unlock Deck
Unlock for access to all 50 flashcards in this deck.
Unlock Deck
k this deck
6
Which of the following is true about determining the proper form of the hypotheses?
A)H₀ is statistically proved true while testing
B)failure to reject H₀ proves H₁ wrong
C)H₀ is always assumed to be true in testing
D)H₁ is always assumed to be true in testing
A)H₀ is statistically proved true while testing
B)failure to reject H₀ proves H₁ wrong
C)H₀ is always assumed to be true in testing
D)H₁ is always assumed to be true in testing
Unlock Deck
Unlock for access to all 50 flashcards in this deck.
Unlock Deck
k this deck
7
Which of the following is true about the value of the power of the test?
A)low value will enable valid conclusions to be made
B)small sample sizes generate a low value of the power of the test
C)low value will help in detecting small differences in sample statistics
D)small sample sizes incur higher costs than large sample sizes
A)low value will enable valid conclusions to be made
B)small sample sizes generate a low value of the power of the test
C)low value will help in detecting small differences in sample statistics
D)small sample sizes incur higher costs than large sample sizes
Unlock Deck
Unlock for access to all 50 flashcards in this deck.
Unlock Deck
k this deck
8
Which of the following is the initial step in conducting a hypothesis test?
A)collecting data and calculating a test statistic
B)selecting a level of significance
C)identifying the population parameter of interest
D)determining a decision rule
A)collecting data and calculating a test statistic
B)selecting a level of significance
C)identifying the population parameter of interest
D)determining a decision rule
Unlock Deck
Unlock for access to all 50 flashcards in this deck.
Unlock Deck
k this deck
9
Which of the following is true about the rejection region?
A)The rejection region is chosen to determine the probability of a Type I error.
B)With a true null hypothesis, the test statistic falls into the rejection region.
C)If the test statistic is in the nonrejection region, the null hypothesis is rejected.
D)The rejection region occurs in the tails of the sampling distribution of the test statistic.
Unlock Deck
Unlock for access to all 50 flashcards in this deck.
Unlock Deck
k this deck
10
Level of significance is the probability of:
A)incorrectly rejecting an actually true null hypothesis.
B)correctly failing to reject an actually true null hypothesis.
C)incorrectly failing to reject an actually false null hypothesis.
D)correctly rejecting an actually false null hypothesis.
A)incorrectly rejecting an actually true null hypothesis.
B)correctly failing to reject an actually true null hypothesis.
C)incorrectly failing to reject an actually false null hypothesis.
D)correctly rejecting an actually false null hypothesis.
Unlock Deck
Unlock for access to all 50 flashcards in this deck.
Unlock Deck
k this deck
11
Which of the following is the test statistic for a one-sample test for mean when the population standard deviation is unknown?
Unlock Deck
Unlock for access to all 50 flashcards in this deck.
Unlock Deck
k this deck
12
Which of the following propositions describes an existing theory or belief?
A)standard deviation
B)null hypothesis
C)proportion
D)alternative hypothesis
A)standard deviation
B)null hypothesis
C)proportion
D)alternative hypothesis
Unlock Deck
Unlock for access to all 50 flashcards in this deck.
Unlock Deck
k this deck
13
What is the confidence coefficient when the level of significance is 0.03?
A)0)9700
B)0)0376
C)0)7924
D)0)7776
A)0)9700
B)0)0376
C)0)7924
D)0)7776
Unlock Deck
Unlock for access to all 50 flashcards in this deck.
Unlock Deck
k this deck
14
Robin Inc.feared that the average company loss is running beyond $34,000.It initially conducted a hypothesis test on a sample extracted from its database.The hypothesis was formulated as H₀: average company loss $34,000 vs.H₁: average company loss > $34,000.The test resulted in favor of Robin Inc.'s loss not exceeding $34,000.Detailed study of company accounts later revealed that the average company loss had run up to $37,896.Which of the following errors were made during the hypothesis test?
A)Type III error
B)Type II error
C)Type I error
D)Type IV error
A)Type III error
B)Type II error
C)Type I error
D)Type IV error
Unlock Deck
Unlock for access to all 50 flashcards in this deck.
Unlock Deck
k this deck
15
Type II error occurs when the test:
A)correctly fails to reject an actually true null hypothesis.
B)incorrectly fails to reject an actually false null hypothesis.
C)correctly rejects an actually false null hypothesis.
D)incorrectly rejects an actually true null hypothesis.
A)correctly fails to reject an actually true null hypothesis.
B)incorrectly fails to reject an actually false null hypothesis.
C)correctly rejects an actually false null hypothesis.
D)incorrectly rejects an actually true null hypothesis.
Unlock Deck
Unlock for access to all 50 flashcards in this deck.
Unlock Deck
k this deck
16
The average cost for the sample of 5 sales of a product is =$230 and the sample standard deviation is s = $17.50.The hypothesized mean is μ₀= $250.Compute the value of the test statistic.
A)-2.56
B)-4.00
C)-1.67
D)-3.87
=$230 and the sample standard deviation is s = $17.50.The hypothesized mean is μ₀= $250.Compute the value of the test statistic.A)-2.56
B)-4.00
C)-1.67
D)-3.87
Unlock Deck
Unlock for access to all 50 flashcards in this deck.
Unlock Deck
k this deck
17
Which of the following is a valid one-sample hypothesis test?
A)H₀: population parameter ≠ constant vs.H₁: population parameter = constant
B)H₀: population parameter > constant vs.H₁: population parameter ≤ constant
C)H₀: population parameter < constant vs.H₁: population parameter ≥ constant
D)H₀: population parameter = constant vs.H₁: population parameter ≠ constant
Unlock Deck
Unlock for access to all 50 flashcards in this deck.
Unlock Deck
k this deck
18
The confidence coefficient is denoted by:
A)α
B)1 - β
C)β
D)1 - α
A)α
B)1 - β
C)β
D)1 - α
Unlock Deck
Unlock for access to all 50 flashcards in this deck.
Unlock Deck
k this deck
19
For a one-tailed test, the critical value:
A)divides the sampling distribution into three parts.
B)is the number of standard errors away from the sample mean.
C)helps determine if the test statistic falls in the rejection region or not.
D)fails to reject the null hypothesis if the value exceeds the test statistic.
A)divides the sampling distribution into three parts.
B)is the number of standard errors away from the sample mean.
C)helps determine if the test statistic falls in the rejection region or not.
D)fails to reject the null hypothesis if the value exceeds the test statistic.
Unlock Deck
Unlock for access to all 50 flashcards in this deck.
Unlock Deck
k this deck
20
Identify the power of the test from the following probabilities.
A)P(rejecting H₀ | H₀ is true)
B)P(not rejecting H₀ | H₀ is false)
C)P(rejecting H₀ | H₀ is false)
D)P(not rejecting H₀ | H₀ is true)
A)P(rejecting H₀ | H₀ is true)
B)P(not rejecting H₀ | H₀ is false)
C)P(rejecting H₀ | H₀ is false)
D)P(not rejecting H₀ | H₀ is true)
Unlock Deck
Unlock for access to all 50 flashcards in this deck.
Unlock Deck
k this deck
21
Use the data given below to answer the following question(s).
The following extract from a manufacturer's database shows a sample of 10 suppliers, their transportation charges, and the estimated and actual total costs of supplying materials.(Note: Assume a significance level of 0.05 wherever necessary.)
On studying the database, the manufacturer found out that the average difference between the estimated and actual total costs was $426.Based on the sample data, can the manufacturer conclude that the average difference between the estimated and actual total costs is different from zero?
Unlock Deck
Unlock for access to all 50 flashcards in this deck.
Unlock Deck
k this deck
22
Which of the following tests is used to determine if two categorical variables are independent?
A)Chi-square test
B)t-test
C)z-test
D)ANOVA
A)Chi-square test
B)t-test
C)z-test
D)ANOVA
Unlock Deck
Unlock for access to all 50 flashcards in this deck.
Unlock Deck
k this deck
23
Which of the following 2010 Excel functions computes the p-value for the chi-square test?
A)CHISQ.INV.RT
B)CHIDIST
C)CHI.SQ
D)CHISQ.TEST
A)CHISQ.INV.RT
B)CHIDIST
C)CHI.SQ
D)CHISQ.TEST
Unlock Deck
Unlock for access to all 50 flashcards in this deck.
Unlock Deck
k this deck
24
Which of the following Excel tools is used for a two-sample test for equality of variances?
A)Excel F-test Two-sample for variances
B)Excel z-test: Two-sample for means
C)Excel t-test: Two-sample assuming unequal variances
D)Excel t-test: Two-sample assuming equal variances
A)Excel F-test Two-sample for variances
B)Excel z-test: Two-sample for means
C)Excel t-test: Two-sample assuming unequal variances
D)Excel t-test: Two-sample assuming equal variances
Unlock Deck
Unlock for access to all 50 flashcards in this deck.
Unlock Deck
k this deck
25
In a two-sample test for differences in means, the hypotheses are of the form:
A)
B)
C)
D)
A)
B)
C)
D)
Unlock Deck
Unlock for access to all 50 flashcards in this deck.
Unlock Deck
k this deck
26
In statistical terminology, the variable of interest is called a ________.
A)critical value
B)p-value
C)factor
D)test-statistic
A)critical value
B)p-value
C)factor
D)test-statistic
Unlock Deck
Unlock for access to all 50 flashcards in this deck.
Unlock Deck
k this deck
27
Use the data given below to answer the following question(s).
The following extract from a manufacturer's database shows a sample of 10 suppliers, their transportation charges, and the estimated and actual total costs of supplying materials.(Note: Assume a significance level of 0.05 wherever necessary.)
Conduct the appropriate type of one-sample test-statistic to determine whether the average transportation charge is less than $430.
Unlock Deck
Unlock for access to all 50 flashcards in this deck.
Unlock Deck
k this deck
28
Use the data given below to answer the following question(s).
In a lower one-tailed hypothesis test, chosen level of significance = 0.10, true mean = 30, sample size = 55, and t-test statistic = -1.76.
What is the observed level of significance?
A)0)4605
B)0)4191
C)0)0379
D)0)0420
In a lower one-tailed hypothesis test, chosen level of significance = 0.10, true mean = 30, sample size = 55, and t-test statistic = -1.76.
What is the observed level of significance?
A)0)4605
B)0)4191
C)0)0379
D)0)0420
Unlock Deck
Unlock for access to all 50 flashcards in this deck.
Unlock Deck
k this deck
29
For a two-sample hypothesis which tests for differences in population parameters (1)and (2), a two-tailed test seeks evidence that population parameter:
A)seeks evidence that population parameter (2)is larger than parameter (1).
B) (2)is the same as parameter (1).
C) (2)is smaller than parameter (1).
D) (1)and (2)do not belong to the same data.
A)seeks evidence that population parameter (2)is larger than parameter (1).
B) (2)is the same as parameter (1).
C) (2)is smaller than parameter (1).
D) (1)and (2)do not belong to the same data.
Unlock Deck
Unlock for access to all 50 flashcards in this deck.
Unlock Deck
k this deck
30
Which of the following is true while applying the Excel ANOVA tool?
A)The specified input range of data must be separated.
B)The sample size for each factor level must be the same.
C)The input range must be a rectangular region that contains all data.
D)Level of significance need not be specified.
A)The specified input range of data must be separated.
B)The sample size for each factor level must be the same.
C)The input range must be a rectangular region that contains all data.
D)Level of significance need not be specified.
Unlock Deck
Unlock for access to all 50 flashcards in this deck.
Unlock Deck
k this deck
31
Use the data given below to answer the following question(s).
In a lower one-tailed hypothesis test, chosen level of significance = 0.10, true mean = 30, sample size = 55, and t-test statistic = -1.76.
Which of the following is the conclusion?
A)This is a high probability and the conclusion is difficult.
B)The null hypothesis is rejected.
C)There are many sampling errors.
D)The null hypothesis cannot be rejected.
Unlock Deck
Unlock for access to all 50 flashcards in this deck.
Unlock Deck
k this deck
32
Use the data given below to answer the following question(s).
In a lower one-tailed hypothesis test, chosen level of significance = 0.10, true mean = 30, sample size = 55, and t-test statistic = -1.76.
Which of the following computes the test statistic for a one-sample test for proportions?
A)z =
B)z =
C)z =
D)z =
In a lower one-tailed hypothesis test, chosen level of significance = 0.10, true mean = 30, sample size = 55, and t-test statistic = -1.76.
Which of the following computes the test statistic for a one-sample test for proportions?
A)z =
B)z =
C)z =
D)z =
Unlock Deck
Unlock for access to all 50 flashcards in this deck.
Unlock Deck
k this deck
33
During a study, individuals were asked to rate a product on a scale of 1-5.From the following data, help the researcher determine whether any significant differences exist in opinions among individuals from different regions.(Note: Assume a significance level of 0.05 wherever necessary.)
Unlock Deck
Unlock for access to all 50 flashcards in this deck.
Unlock Deck
k this deck
34
For a two-sample hypothesis test for differences in population parameters (1)and (2), which of the following is the correct form of an upper-tailed test?
A)H₀: population parameter (1)- population parameter (2)0 vs.H₁: population parameter (1)- population parameter (2)< 0
B)H₀: population parameter (1)- population parameter (2)> 0 vs.H₁: population parameter (1)- population parameter (2)≤ 0
C)H₀: population parameter (1)- population parameter (2)< 0 vs.H₁: population parameter (1)- population parameter (2)0
D)H₀: population parameter (1)- population parameter (2)≤ 0 vs.H₁: population parameter (1)- population parameter (2)> 0
Unlock Deck
Unlock for access to all 50 flashcards in this deck.
Unlock Deck
k this deck
35
In order to reject the null hypothesis, the F-test statistic must be greater than the ________.
A)p-value
B)variance
C)df
D)crit
A)p-value
B)variance
C)df
D)crit
Unlock Deck
Unlock for access to all 50 flashcards in this deck.
Unlock Deck
k this deck
36
While testing for equality of variances, which of the following formulae gives the F-test statistic?
Unlock Deck
Unlock for access to all 50 flashcards in this deck.
Unlock Deck
k this deck
37
For a lower-tail test, the p-value in the output from an Excel tool:
A)is correct if the test-statistic is negative.
B)is the difference from 1.0 if the test-statistic is negative.
C)is correct if the test-statistic is zero.
D)is correct if the test-statistic is positive.
A)is correct if the test-statistic is negative.
B)is the difference from 1.0 if the test-statistic is negative.
C)is correct if the test-statistic is zero.
D)is correct if the test-statistic is positive.
Unlock Deck
Unlock for access to all 50 flashcards in this deck.
Unlock Deck
k this deck
38
Which of the following is true about chi-square distribution?
A)It is a special distribution and is denoted by (C²).
B)It is characterized by degrees of freedom.
C)It is computed using the Excel function CHISQ.INV.TEST.
D)It has a left-tail area equal to the expected value of the sample.
A)It is a special distribution and is denoted by (C²).
B)It is characterized by degrees of freedom.
C)It is computed using the Excel function CHISQ.INV.TEST.
D)It has a left-tail area equal to the expected value of the sample.
Unlock Deck
Unlock for access to all 50 flashcards in this deck.
Unlock Deck
k this deck
39
Using the following data, test for the independence of the variables.(Note: Assume a significance level of 0.05 wherever necessary.)
Unlock Deck
Unlock for access to all 50 flashcards in this deck.
Unlock Deck
k this deck
40
Use the data given below to answer the following question(s).
The following extract from a manufacturer's database shows a sample of 10 suppliers, their transportation charges, and the estimated and actual total costs of supplying materials.(Note: Assume a significance level of 0.05 wherever necessary.)
Conduct the appropriate type of one-sample test-statistic to determine whether the average transportation charge is less than $430.Apply a decision rule using the observed level of significance and draw a conclusion.
Unlock Deck
Unlock for access to all 50 flashcards in this deck.
Unlock Deck
k this deck
41
In a two-sample test for means with the population variance being known, the z-test uses a test statistic that is based on the standard normal distribution.
Unlock Deck
Unlock for access to all 50 flashcards in this deck.
Unlock Deck
k this deck
42
Explain the assumptions underlying ANOVA along with their violations.
Unlock Deck
Unlock for access to all 50 flashcards in this deck.
Unlock Deck
k this deck
43
If the alternative hypothesis includes the symbol <, the rejection region is in the upper tail.
Unlock Deck
Unlock for access to all 50 flashcards in this deck.
Unlock Deck
k this deck
44
The first step in a chi-square test is to compute the observed frequency between each cell of the cross-tabulation if the two variables are independent.
Unlock Deck
Unlock for access to all 50 flashcards in this deck.
Unlock Deck
k this deck
45
For a two-sample test, explain the procedure used when it is difficult to justify the assumption that the variances of each population are equal.
Unlock Deck
Unlock for access to all 50 flashcards in this deck.
Unlock Deck
k this deck
46
What are the four different outcomes of hypothesis testing?
Unlock Deck
Unlock for access to all 50 flashcards in this deck.
Unlock Deck
k this deck
47
Why is testing for independence important for businesses?
Unlock Deck
Unlock for access to all 50 flashcards in this deck.
Unlock Deck
k this deck
48
For a two-sample test for means with the population variance being known, the Excel procedure used is the Excel z-test.
Unlock Deck
Unlock for access to all 50 flashcards in this deck.
Unlock Deck
k this deck
49
In conducting a hypothesis test, what is usually to be proven statistically is identified as the null hypothesis.
Unlock Deck
Unlock for access to all 50 flashcards in this deck.
Unlock Deck
k this deck
50
How do test statistics for two-sample tests vary depending on whether the population standard deviations are known, and if not, whether they are assumed to be equal?
Unlock Deck
Unlock for access to all 50 flashcards in this deck.
Unlock Deck
k this deck
Unlock Deck
Unlock for access to all 50 flashcards in this deck.


