Deck 3: Biomedical Decision Making: Probabilistic Clinical Reasoning
Full screen (f)
Question
Question
Question
Question
Question
Question
Question
Calculate the following probabilities for a patient about to undergo CABG surgery (see Example 2) 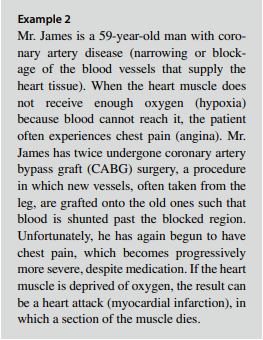 :
:
(a) The only possible, mutually exclusive outcomes of surgery are death, relief of symptoms (angina and dyspnea), and continuation of symptoms. The probability of death is 0.02, and the probability of relief of symptoms is 0.80. What is the probability that the patient will continue to have symptoms?
(b) Two known complications of heart surgery are stroke and heart attack, with probabilities of 0.02 and 0.05, respectively. The patient asks what chance he or she has of having both complications. Assume that the com plications are conditionally independent, and calculate your answer.
(c) The patient wants to know the probability that he or she will have a stroke given that he or she has a heart attack as a complication of the surgery. Assume that 1 in 500 patients has both complications, that the probability of heart attack is 0.05, and that the events are independent. Calculate your answer.
:(a) The only possible, mutually exclusive outcomes of surgery are death, relief of symptoms (angina and dyspnea), and continuation of symptoms. The probability of death is 0.02, and the probability of relief of symptoms is 0.80. What is the probability that the patient will continue to have symptoms?
(b) Two known complications of heart surgery are stroke and heart attack, with probabilities of 0.02 and 0.05, respectively. The patient asks what chance he or she has of having both complications. Assume that the com plications are conditionally independent, and calculate your answer.
(c) The patient wants to know the probability that he or she will have a stroke given that he or she has a heart attack as a complication of the surgery. Assume that 1 in 500 patients has both complications, that the probability of heart attack is 0.05, and that the events are independent. Calculate your answer.
Question
The results of a hypothetical study to measure test performance of a diagnos tic test for HIV are shown in the 2×2 table in Table 3.9. 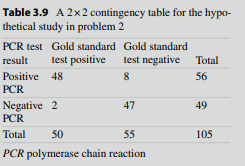 (a) Calculate the sensitivity, specificity, disease prevalence, PV+, and PV-.
(b) Use the TPR and TNR calculated in part (a) to fill in the 2×2 table in Table 3.10.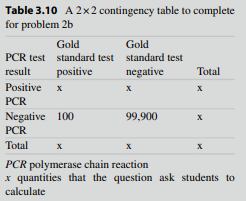 Calculate the disease prevalence, PV+, and PV-.
(a) Calculate the sensitivity, specificity, disease prevalence, PV+, and PV-.(b) Use the TPR and TNR calculated in part (a) to fill in the 2×2 table in Table 3.10.
Calculate the disease prevalence, PV+, and PV-. Question
Question

Unlock Deck
Sign up to unlock the cards in this deck!
Unlock Deck
Unlock Deck
1/10
Play
Full screen (f)
Deck 3: Biomedical Decision Making: Probabilistic Clinical Reasoning
1
You are concerned that a patient with a sore throat has a bacterial infection that would require antibiotic therapy (as opposed to a viral infection, for which no treatment is available). Your treatment threshold is 0.4, and based on the examination you estimate the probability of bacterial infection as 0.8. A test is available (TPR=0.75, TNR=0.85) that indicates the presence or absence of bacterial infection. Should you perform the test? Explain your reasoning. How would your analysis change if the test were extremely costly or involved a significant risk to the patient?
In the given case, it is considered that a patient is having sore throat and also has an infection (bacterial). The patient is required to undergo a therapy (antibiotic). The threshold of the treatment is 0.4 and the estimated infection's (bacterial) probability is 0.8.
A test is present to check for this bacterial infection which has a TPR (true-positive rate) is 0.75 and a TNR (true-negative rate) is 0.85. This means, that out of 100 patients, 75 patients having sore throat would have bacterial infection. Out of 100 patients, 85 patients with sore throat would not have the bacterial infection.
These numbers seem confusing, since the number of patients who are likely not to have a bacterial infection would still have a sore throat. This number is higher than that of the patients who actually have a bacterial infection along with sore throat.
So, it is advisable to conduct the test for bacterial infection to be sure whether the patient with the sore throat in question actually has the bacterial infection or not. This would clear the doubt of occurrence of infection.
It is likely that the patient would have bacterial infection because the threshold probability of acquiring the infection is 0.4. But, the estimated probability of the infection is 0.8. It is therefore, greater than the threshold probability.
At the same time, the TNR is greater than TPR. Thus, to be double sure about the infectivity of the patient, the test must be carried on the patient to understand whether an antibiotic therapy is to be administered to cure the patient of sore throat.
However, if the test involved is very expensive, then a trade-off could be done where antibiotic therapy could be given to the patient. It is to be given for a very short term to see the effects of the drugs. However, if the patient does not get rid of the sore throat after the antibiotics have been administered, then it is advisable to carry out the test anyhow.
2
What are the three kinds of bias that can influence measurement of test performance? Explain what each one is, and state how you would adjust the post-test probability to compensate for each.
The bias, which influences the measurement of a test performance, is of three kinds; namely, test referral bias, spectrum bias as well as test interpretation bias. Spectrum bias is seen when individuals with advanced disease and healthy volunteers are included in the population under study. It usually occurs in the beginning when the test is being developed.
Occurrence of spectrum bias is unlikely during the later stages of the disease, since advanced diseases are easily detected than the earlier stages of disease. In this bias, there is a high TPR (total peripheral resistance) artifact. This happens because more cases of early disease will be present in a clinically relevant population as compared to the study population.
Test referral bias occurs when the criterion for ordering the gold standard test is determined by a positive index test. Patients with a negative index tests will be less likely to undergo a gold standard test. Test interpretation bias is observed in cases where the index test interpretation affects the interpretation of the gold standard test and vice versa.
A TPR is to be adjusted downwards in a new population under study. This is due to the reason that in all the three biases, the study population has a higher TPR than the clinically relevant population.
3
How could a computer system ease the task of performing a complex decision analysis?
The computer system can eases the job of performing an intricate decision analysis. A computer tool employs several different kinds of algorithms that can be used to make decisions on clinical conditions. Several computer models are being used more and more to make complex decision analysis easier than before.
There are several models that are used to perform the task of analysis. Some of them are as follows:
1. A decision tree is one model which can represent choices. In this tree model, a chance node represents those events that are controlled by chance. Each line in the tree emanating from the chance node represents a possible outcome of the event. Creating a decision tree requires formulation of the decision problem, assignment of different probable situations and measuring the outcomes of those probabilities.
2. Markov model is another feature that the computer uses to represent long-term outcomes. To build this model, a set of different states of health that a person experiences is specified first.
Next, the representation of transitional probabilities takes place. There is a probability that the person will transit from one health state to another within a given time gap. This probability is called a transition probability and the time period is called Markov cycle.
Using the Markov model, probability of a person to exist in different states of health in different times in future can be calculated by simulating transitions amongst different states of health.
3. Influence diagrams are important graphical representations. In an influence diagram, the squares represent decision nodes and the circles represent chance nodes. This relationship occurs, when one chance event influences another chance event. A chance event is said to be observed at a given time, when the decision was made.
4
When you search the medical literature to find probabilities for patients similar to one you are treating, what is the most important question to consider? How should you adjust probabilities in light of the answer to this question?
Unlock Deck
Unlock for access to all 10 flashcards in this deck.
Unlock Deck
k this deck
5
Why do you think clinicians sometimes order tests even if the results will not affect their management of the patient? Do you think the reasons that you identify are valid? Are they valid in only certain situations? Explain your answers. See the January 1998 issue of Medical Decision Making for articles that discuss this question.
Unlock Deck
Unlock for access to all 10 flashcards in this deck.
Unlock Deck
k this deck
6
Explain the differences in three approaches to assessing patients' preferences for health states: the standard gamble, the time trade-off, and the visual analog scale.
Unlock Deck
Unlock for access to all 10 flashcards in this deck.
Unlock Deck
k this deck
7
Calculate the following probabilities for a patient about to undergo CABG surgery (see Example 2) :
(a) The only possible, mutually exclusive outcomes of surgery are death, relief of symptoms (angina and dyspnea), and continuation of symptoms. The probability of death is 0.02, and the probability of relief of symptoms is 0.80. What is the probability that the patient will continue to have symptoms?
(b) Two known complications of heart surgery are stroke and heart attack, with probabilities of 0.02 and 0.05, respectively. The patient asks what chance he or she has of having both complications. Assume that the com plications are conditionally independent, and calculate your answer.
(c) The patient wants to know the probability that he or she will have a stroke given that he or she has a heart attack as a complication of the surgery. Assume that 1 in 500 patients has both complications, that the probability of heart attack is 0.05, and that the events are independent. Calculate your answer.
:(a) The only possible, mutually exclusive outcomes of surgery are death, relief of symptoms (angina and dyspnea), and continuation of symptoms. The probability of death is 0.02, and the probability of relief of symptoms is 0.80. What is the probability that the patient will continue to have symptoms?
(b) Two known complications of heart surgery are stroke and heart attack, with probabilities of 0.02 and 0.05, respectively. The patient asks what chance he or she has of having both complications. Assume that the com plications are conditionally independent, and calculate your answer.
(c) The patient wants to know the probability that he or she will have a stroke given that he or she has a heart attack as a complication of the surgery. Assume that 1 in 500 patients has both complications, that the probability of heart attack is 0.05, and that the events are independent. Calculate your answer.
Unlock Deck
Unlock for access to all 10 flashcards in this deck.
Unlock Deck
k this deck
8
The results of a hypothetical study to measure test performance of a diagnos tic test for HIV are shown in the 2×2 table in Table 3.9. (a) Calculate the sensitivity, specificity, disease prevalence, PV+, and PV-.
(b) Use the TPR and TNR calculated in part (a) to fill in the 2×2 table in Table 3.10. Calculate the disease prevalence, PV+, and PV-.
(a) Calculate the sensitivity, specificity, disease prevalence, PV+, and PV-.(b) Use the TPR and TNR calculated in part (a) to fill in the 2×2 table in Table 3.10.
Calculate the disease prevalence, PV+, and PV-. Unlock Deck
Unlock for access to all 10 flashcards in this deck.
Unlock Deck
k this deck
9
You are asked to interpret the results from a diagnostic test for HIV in an asymptomatic man whose test was positive when he volunteered to donate blood. After taking his history, you learn that he has a history of intrave nous-drug use. You know that the overall prevalence of HIV infection in your community is 1 in 500 and that the prevalence in people who have injected drugs is 20 times as high as in the community at large.
(a) Estimate the pretest probability that this man is infected with HIV.
(b) The man tells you that two people with whom he shared needles sub sequently died of AIDS. Which heuristic will be useful in making a subjective adjustment to the pre test probability in part (a)?
(c) Use the sensitivity and specificity that you worked out in 2(a) to calculate the post-test probability of the patient having HIV after a positive and negative test. Assume that the pretest probability is 0.10.
(d) If you wanted to increase the post test probability of disease given a positive test result, would you change the TPR or TNR of the test?
Unlock Deck
Unlock for access to all 10 flashcards in this deck.
Unlock Deck
k this deck
10
You have a patient with cancer who has a choice between surgery or che motherapy. If the patient chooses sur gery, he or she has a 2 % chance of dying from the operation (life expectancy=0), a 50 % chance of being cured (life expectancy=15 years), and a 48 % chance of not being cured (life expectancy=1 year). If the patient chooses chemotherapy, he or she has a 5 % chance of death (life expectancy=0), a 65 % chance of cure (life expectancy=15 years), and a 30 % chance that the cancer will be slowed but not cured (life expectancy=2 years). Create a decision tree Calculate the expected value of each option in terms of life expectancy.
Unlock Deck
Unlock for access to all 10 flashcards in this deck.
Unlock Deck
k this deck
Unlock Deck
Unlock for access to all 10 flashcards in this deck.


