Deck 6: Physicians, Health Care Quality, and Health Disparities
Full screen (f)
Question
Question
Question
Question
Question
Question
Review the data in Box 6.1. below. Then select the correct answer or answers to the questions below.
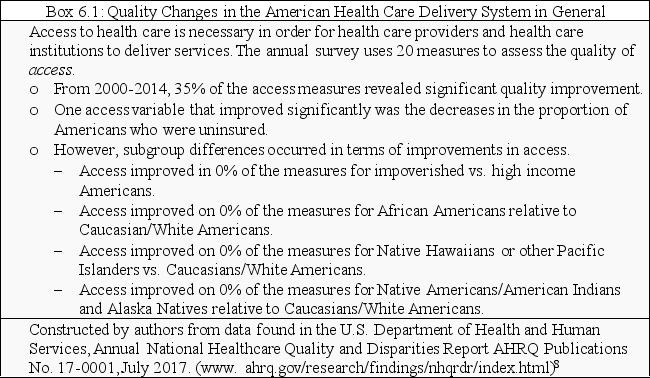 The 2016 National Healthcare Quality and Disparities Report that was published in 2017 reveals that the following health care disparities as measured by access to health care were observable from 2000 to 2014
A) Independently of the racial/ethnic status of Americans, health care access did not improve for impoverished persons from 2000 to 2014
B) Health care quality as measured by access did improve from 2000-2014
C) While access improved for Native Americans/American Indians and Alaskan Natives relative to White Americans, health care quality did not improve for Native Hawaiians or other Pacific Islanders
D) a and b
E) b and c
The 2016 National Healthcare Quality and Disparities Report that was published in 2017 reveals that the following health care disparities as measured by access to health care were observable from 2000 to 2014A) Independently of the racial/ethnic status of Americans, health care access did not improve for impoverished persons from 2000 to 2014
B) Health care quality as measured by access did improve from 2000-2014
C) While access improved for Native Americans/American Indians and Alaskan Natives relative to White Americans, health care quality did not improve for Native Hawaiians or other Pacific Islanders
D) a and b
E) b and c
Question
Question
Box 6.2 provides data on quality improvements in general from 2000 to 2014. Analyze the data using the percentage difference computations you learned in Chapter 5 in order to answer questions 8 - 10.
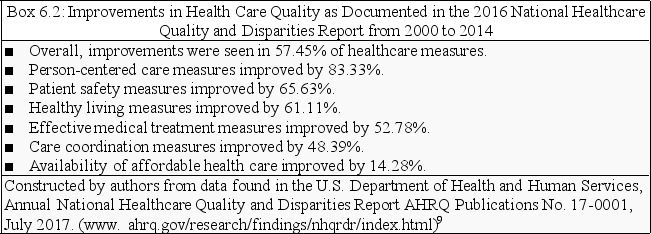
-Overall, improvements occurred in 57.56% of all healthcare measures. This was ___% higher than the 14.28% improvement that occurred in the affordability of care.
A) 4.03% higher
B) 43.28% higher
C) 303.08% higher
D) 3.03% higher
E) None of the above
-Overall, improvements occurred in 57.56% of all healthcare measures. This was ___% higher than the 14.28% improvement that occurred in the affordability of care.
A) 4.03% higher
B) 43.28% higher
C) 303.08% higher
D) 3.03% higher
E) None of the above
Question
Box 6.2 provides data on quality improvements in general from 2000 to 2014. Analyze the data using the percentage difference computations you learned in Chapter 5 in order to answer questions 8 - 10.
-The above finding demonstrates:
A) Based upon an evaluation of the data in 6.2, we may conclude that the American health care system is having difficulty in managing health care costs
B) That medical tourism is causing America's health care costs to be improve very little
C) a and b
D) None of the above
Question
Box 6.2 provides data on quality improvements in general from 2000 to 2014. Analyze the data using the percentage difference computations you learned in Chapter 5 in order to answer questions 8 - 10.
-If you were about to have surgery which of the improvements listed would probability give you the greatest comfort?
A) The 83.33% improvement in patient-centered care
B) The 65.63% improvement in patient safety measures
C) The 48.39% improvement in care coordination
D) The 14.28% improvement in the availability of affordable health care
Question
Use Box 6.3. for these questions.
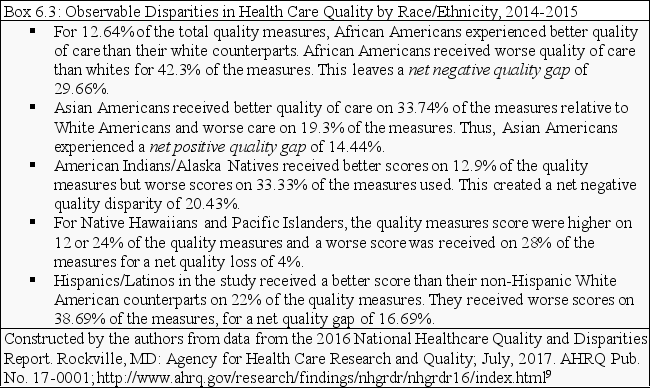
-Which fact or facts about health care quality disparities listed below do you think would be surprising to the American public?
A) African Americans experienced better quality of care than their counterparts of European descent on 12.64% of quality measures
B) Asian Americans received better quality of care than White Americans on 33.7% of the quality measures
C) American Indians/Alaska Natives received better scores on 12.9% of the quality measured relative to White Americans
D) All of the above would surprise many Americans
E) None of the above would surprise most Americans
Question
Use Box 6.3. for these questions.
-When the data in Box 6.3. are analytically appraised, which statements below are true:
A) Native Americans had the greatest net negative quality gap of each of the subgroups listed
B) The net negative quality gap was greater for Hispanic/Latino Americans than Native Hawaiians
C) Asian Americans had a net negative quality disparity that was almost as great as that of African Americans
D) No racial/ethnic subgroup had a net positive disparity gap relative to White Americans
Question
13. For this question refer to Box 6.3 and Box 6.4.
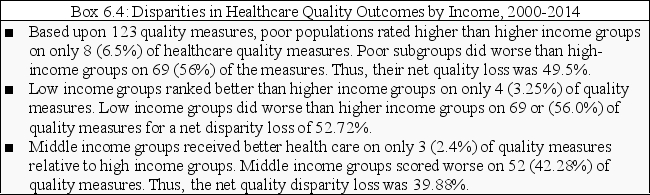
-Relative to healthcare quality disparities, which statement or statements below are true:
A) When data from Box 6.3 and Box 6.4 are compared, low and middle income groups of all races/ethnicities experienced net disparity losses from 2000-2014 that were higher than those experienced by any racial/ethnic subgroup's losses described in Box 6.3.
B) Middle income groups of all races/ethnicities experienced health care quality losses, but the losses were not very high relative to their higher income counterparts
C) Both a and b
D) None of the above
Question
Question
Question
Question
Please refer to Table 6.1. for these questions.


-The states with the highest overall quality had:
A) A lower number of total active physicians per 100,000 population than the states with the lowest overall quality
B) A higher number of total active physicians per 100,000 population than the states with the lowest overall quality
C) The same number of total active physicians per 100,000 population than the states
D) None of the above
Question
Please refer to Table 6.1. for these questions.
-The states with the highest overall quality of care had:
A) A lower mean percent of the total population who were minority than the states with the lowest quality
B) A higher mean percent of the total population who were minority than the states with the lowest quality
C) The same mean percent of the total population who were minority as the states with the highest quality
D) None of the above
Question
Please refer to Table 6.1. for these questions.
-The states with the highest overall quality of care had:
A) A lower mean percent of the total population who were impoverished than the states with the highest quality
B) A higher mean percent of the total population who were impoverished than the states with the highest quality
C) The same mean percent of the total population who were impoverished than the states with the highest quality
D) None of the above
Question
Please refer to Table 6.1. for these questions.
-States with the fewest racial and ethnic disparities had:
A) A higher mean number of total active physicians per 100,000 than the states with the highest racial and ethnic disparities
B) A lower mean number of total active physicians per 100,000 than the states with the highest racial and ethnic disparities
C) The same mean number of total active physicians per 100,000 than the states with the highest racial and ethnic disparities
D) None of the above
Question
Please refer to Table 6.1. for these questions.
-States with the fewest racial and ethnic disparities had:
A) A higher mean percent than the population who were minority
B) A lower mean percent than the population who were minority
C) The same mean percent than the population who were minority
D) None of the above
-States with the fewest racial and ethnic disparities had:
A) A higher mean percent than the population who were minority
B) A lower mean percent than the population who were minority
C) The same mean percent than the population who were minority
D) None of the above
Question
Please refer to Table 6.1. for these questions.
-States with the fewest racial and ethnic disparities in quality of health care had:
A) A much lower percent of the total population who were in poverty
B) A higher percent of the total population who were in poverty
C) The same proportion of the population who were in poverty
D) None of the above
-States with the fewest racial and ethnic disparities in quality of health care had:
A) A much lower percent of the total population who were in poverty
B) A higher percent of the total population who were in poverty
C) The same proportion of the population who were in poverty
D) None of the above
Question
Please refer to Table 6.1. for these questions.
-Based upon the findings from this analysis, it becomes imperative that health care disparity researchers investigate:
A) The unexpected positive relationship between number of physicians per 100,000 population and quality of health care
B) The unexpected negative relationship between number of physicians per 100,000 population and high health care disparities
C) The unexpected closeness of the relationship between the percent of the impoverished in both high and low health care disparity states
D) The unexpected inverse relationship between the % of the population who are minorities in high health care quality states
E) a and b
F) b and c
G) c and d
H) a, b c, and d
I) None of the above
Question
Please refer to Table 6.1. for these questions.
-A panel size is:
A) the total number of patients who see a physician on a regular basis
B) a panel of physicians who are seeking a new treatment
C) a panel of patients who are trying out a new treatment
D) All of the above
E) None of the above
-A panel size is:
A) the total number of patients who see a physician on a regular basis
B) a panel of physicians who are seeking a new treatment
C) a panel of patients who are trying out a new treatment
D) All of the above
E) None of the above
Question
Please refer to Table 6.1. for these questions.
-At least some findings from the analysis make an original contribution to healthcare disparities research.
-At least some findings from the analysis make an original contribution to healthcare disparities research.

Unlock Deck
Sign up to unlock the cards in this deck!
Unlock Deck
Unlock Deck
1/25
Play
Full screen (f)
Deck 6: Physicians, Health Care Quality, and Health Disparities
1
According to the Study Guide Powe
C
2
There are approximately _____ active licensed physicians who serve the U.S. Health care delivery system.
A) 9 million+
B) 950,000+
C) 90,000+
D) 9,000+
A) 9 million+
B) 950,000+
C) 90,000+
D) 9,000+
B
3
Which country below has the highest physician to population ratio of those listed in the text?
A) The U.S.
B) Switzerland
C) Greece
D) Cuba
A) The U.S.
B) Switzerland
C) Greece
D) Cuba
D
4
If one accepts the thesis that physicians are key to any country's care delivery system, one may theorize that the physician to population ratio may play a role in healthcare quality and in healthcare quality disparities.
Unlock Deck
Unlock for access to all 25 flashcards in this deck.
Unlock Deck
k this deck
5
What is the causal pathway by which physicians per 1,000 persons may affect health care quality?:
A) Access to medical care can take longer if the physicians per 1,000 is too low
B) The panel size may be too long
C) Large panel sizes may, according to Dahrouge et al., lead to decreases in quality
D) All of the above
E) None of the above
A) Access to medical care can take longer if the physicians per 1,000 is too low
B) The panel size may be too long
C) Large panel sizes may, according to Dahrouge et al., lead to decreases in quality
D) All of the above
E) None of the above
Unlock Deck
Unlock for access to all 25 flashcards in this deck.
Unlock Deck
k this deck
6
Review the data in Box 6.1. below. Then select the correct answer or answers to the questions below.
The 2016 National Healthcare Quality and Disparities Report that was published in 2017 reveals that the following health care disparities as measured by access to health care were observable from 2000 to 2014
A) Independently of the racial/ethnic status of Americans, health care access did not improve for impoverished persons from 2000 to 2014
B) Health care quality as measured by access did improve from 2000-2014
C) While access improved for Native Americans/American Indians and Alaskan Natives relative to White Americans, health care quality did not improve for Native Hawaiians or other Pacific Islanders
D) a and b
E) b and c
The 2016 National Healthcare Quality and Disparities Report that was published in 2017 reveals that the following health care disparities as measured by access to health care were observable from 2000 to 2014A) Independently of the racial/ethnic status of Americans, health care access did not improve for impoverished persons from 2000 to 2014
B) Health care quality as measured by access did improve from 2000-2014
C) While access improved for Native Americans/American Indians and Alaskan Natives relative to White Americans, health care quality did not improve for Native Hawaiians or other Pacific Islanders
D) a and b
E) b and c
Unlock Deck
Unlock for access to all 25 flashcards in this deck.
Unlock Deck
k this deck
7
According to the text, Americans in general experienced a 75% improvement from 200-2014 in the :
A) Receipt of effective treatment
B) Healthy living
C) Patient-centered care
D) All of the areas listed above
E) None of the area listed above
A) Receipt of effective treatment
B) Healthy living
C) Patient-centered care
D) All of the areas listed above
E) None of the area listed above
Unlock Deck
Unlock for access to all 25 flashcards in this deck.
Unlock Deck
k this deck
8
Box 6.2 provides data on quality improvements in general from 2000 to 2014. Analyze the data using the percentage difference computations you learned in Chapter 5 in order to answer questions 8 - 10.
-Overall, improvements occurred in 57.56% of all healthcare measures. This was ___% higher than the 14.28% improvement that occurred in the affordability of care.
A) 4.03% higher
B) 43.28% higher
C) 303.08% higher
D) 3.03% higher
E) None of the above
-Overall, improvements occurred in 57.56% of all healthcare measures. This was ___% higher than the 14.28% improvement that occurred in the affordability of care.
A) 4.03% higher
B) 43.28% higher
C) 303.08% higher
D) 3.03% higher
E) None of the above
Unlock Deck
Unlock for access to all 25 flashcards in this deck.
Unlock Deck
k this deck
9
Box 6.2 provides data on quality improvements in general from 2000 to 2014. Analyze the data using the percentage difference computations you learned in Chapter 5 in order to answer questions 8 - 10.
-The above finding demonstrates:
A) Based upon an evaluation of the data in 6.2, we may conclude that the American health care system is having difficulty in managing health care costs
B) That medical tourism is causing America's health care costs to be improve very little
C) a and b
D) None of the above
Unlock Deck
Unlock for access to all 25 flashcards in this deck.
Unlock Deck
k this deck
10
Box 6.2 provides data on quality improvements in general from 2000 to 2014. Analyze the data using the percentage difference computations you learned in Chapter 5 in order to answer questions 8 - 10.
-If you were about to have surgery which of the improvements listed would probability give you the greatest comfort?
A) The 83.33% improvement in patient-centered care
B) The 65.63% improvement in patient safety measures
C) The 48.39% improvement in care coordination
D) The 14.28% improvement in the availability of affordable health care
Unlock Deck
Unlock for access to all 25 flashcards in this deck.
Unlock Deck
k this deck
11
Use Box 6.3. for these questions.
-Which fact or facts about health care quality disparities listed below do you think would be surprising to the American public?
A) African Americans experienced better quality of care than their counterparts of European descent on 12.64% of quality measures
B) Asian Americans received better quality of care than White Americans on 33.7% of the quality measures
C) American Indians/Alaska Natives received better scores on 12.9% of the quality measured relative to White Americans
D) All of the above would surprise many Americans
E) None of the above would surprise most Americans
Unlock Deck
Unlock for access to all 25 flashcards in this deck.
Unlock Deck
k this deck
12
Use Box 6.3. for these questions.
-When the data in Box 6.3. are analytically appraised, which statements below are true:
A) Native Americans had the greatest net negative quality gap of each of the subgroups listed
B) The net negative quality gap was greater for Hispanic/Latino Americans than Native Hawaiians
C) Asian Americans had a net negative quality disparity that was almost as great as that of African Americans
D) No racial/ethnic subgroup had a net positive disparity gap relative to White Americans
Unlock Deck
Unlock for access to all 25 flashcards in this deck.
Unlock Deck
k this deck
13
13. For this question refer to Box 6.3 and Box 6.4.
-Relative to healthcare quality disparities, which statement or statements below are true:
A) When data from Box 6.3 and Box 6.4 are compared, low and middle income groups of all races/ethnicities experienced net disparity losses from 2000-2014 that were higher than those experienced by any racial/ethnic subgroup's losses described in Box 6.3.
B) Middle income groups of all races/ethnicities experienced health care quality losses, but the losses were not very high relative to their higher income counterparts
C) Both a and b
D) None of the above
Unlock Deck
Unlock for access to all 25 flashcards in this deck.
Unlock Deck
k this deck
14
According to the authors, health care administrators, public health personnel, and clinicians are actively and aggressively seeking solutions to the healthcare quality disparities that are affecting poor populations, low-income populations, and middle income populations.
Unlock Deck
Unlock for access to all 25 flashcards in this deck.
Unlock Deck
k this deck
15
When the results of the 2000-2014 health quality outcomes are compared with the outcomes for a previous period, tremendous improvement occurred between middle income and higher income households. Therefore, health disparity researchers have no need to be concerned about these two groups of Americans.
Unlock Deck
Unlock for access to all 25 flashcards in this deck.
Unlock Deck
k this deck
16
In the original research that was carried out to assess whether quality outcomes differed in various states, the analysis was completed by:
A) Comparing the 12 states with the highest overall quality of care and the 9 states with the lowest quality of care
B) Comparing the 9 states with the fewest racial/ethnic disparities in quality of care with the 12 states with the most racial/ethnic disparities in quality of care
C) Researching the mean number of active physicians per 100,000 in each state in both groups
D) Using Census data to identify the percent of the total population who are minority and the 9 percent with incomes below the poverty lie in each state
E) All of the above were steps taken
F) None of the above were steps taken
Unlock Deck
Unlock for access to all 25 flashcards in this deck.
Unlock Deck
k this deck
17
Please refer to Table 6.1. for these questions.
-The states with the highest overall quality had:
A) A lower number of total active physicians per 100,000 population than the states with the lowest overall quality
B) A higher number of total active physicians per 100,000 population than the states with the lowest overall quality
C) The same number of total active physicians per 100,000 population than the states
D) None of the above
Unlock Deck
Unlock for access to all 25 flashcards in this deck.
Unlock Deck
k this deck
18
Please refer to Table 6.1. for these questions.
-The states with the highest overall quality of care had:
A) A lower mean percent of the total population who were minority than the states with the lowest quality
B) A higher mean percent of the total population who were minority than the states with the lowest quality
C) The same mean percent of the total population who were minority as the states with the highest quality
D) None of the above
Unlock Deck
Unlock for access to all 25 flashcards in this deck.
Unlock Deck
k this deck
19
Please refer to Table 6.1. for these questions.
-The states with the highest overall quality of care had:
A) A lower mean percent of the total population who were impoverished than the states with the highest quality
B) A higher mean percent of the total population who were impoverished than the states with the highest quality
C) The same mean percent of the total population who were impoverished than the states with the highest quality
D) None of the above
Unlock Deck
Unlock for access to all 25 flashcards in this deck.
Unlock Deck
k this deck
20
Please refer to Table 6.1. for these questions.
-States with the fewest racial and ethnic disparities had:
A) A higher mean number of total active physicians per 100,000 than the states with the highest racial and ethnic disparities
B) A lower mean number of total active physicians per 100,000 than the states with the highest racial and ethnic disparities
C) The same mean number of total active physicians per 100,000 than the states with the highest racial and ethnic disparities
D) None of the above
Unlock Deck
Unlock for access to all 25 flashcards in this deck.
Unlock Deck
k this deck
21
Please refer to Table 6.1. for these questions.
-States with the fewest racial and ethnic disparities had:
A) A higher mean percent than the population who were minority
B) A lower mean percent than the population who were minority
C) The same mean percent than the population who were minority
D) None of the above
-States with the fewest racial and ethnic disparities had:
A) A higher mean percent than the population who were minority
B) A lower mean percent than the population who were minority
C) The same mean percent than the population who were minority
D) None of the above
Unlock Deck
Unlock for access to all 25 flashcards in this deck.
Unlock Deck
k this deck
22
Please refer to Table 6.1. for these questions.
-States with the fewest racial and ethnic disparities in quality of health care had:
A) A much lower percent of the total population who were in poverty
B) A higher percent of the total population who were in poverty
C) The same proportion of the population who were in poverty
D) None of the above
-States with the fewest racial and ethnic disparities in quality of health care had:
A) A much lower percent of the total population who were in poverty
B) A higher percent of the total population who were in poverty
C) The same proportion of the population who were in poverty
D) None of the above
Unlock Deck
Unlock for access to all 25 flashcards in this deck.
Unlock Deck
k this deck
23
Please refer to Table 6.1. for these questions.
-Based upon the findings from this analysis, it becomes imperative that health care disparity researchers investigate:
A) The unexpected positive relationship between number of physicians per 100,000 population and quality of health care
B) The unexpected negative relationship between number of physicians per 100,000 population and high health care disparities
C) The unexpected closeness of the relationship between the percent of the impoverished in both high and low health care disparity states
D) The unexpected inverse relationship between the % of the population who are minorities in high health care quality states
E) a and b
F) b and c
G) c and d
H) a, b c, and d
I) None of the above
Unlock Deck
Unlock for access to all 25 flashcards in this deck.
Unlock Deck
k this deck
24
Please refer to Table 6.1. for these questions.
-A panel size is:
A) the total number of patients who see a physician on a regular basis
B) a panel of physicians who are seeking a new treatment
C) a panel of patients who are trying out a new treatment
D) All of the above
E) None of the above
-A panel size is:
A) the total number of patients who see a physician on a regular basis
B) a panel of physicians who are seeking a new treatment
C) a panel of patients who are trying out a new treatment
D) All of the above
E) None of the above
Unlock Deck
Unlock for access to all 25 flashcards in this deck.
Unlock Deck
k this deck
25
Please refer to Table 6.1. for these questions.
-At least some findings from the analysis make an original contribution to healthcare disparities research.
-At least some findings from the analysis make an original contribution to healthcare disparities research.
Unlock Deck
Unlock for access to all 25 flashcards in this deck.
Unlock Deck
k this deck
Unlock Deck
Unlock for access to all 25 flashcards in this deck.


