Deck 2: Presenting Data
Full screen (f)
Question
Question
Question
Question
Question
Question
Question
Question
Question
Question
Question
The following is an example of what type of graph?
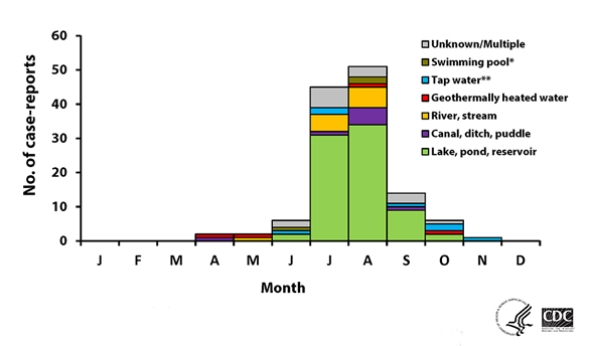
A) bar chart
B) line graph
C) scatterplot
D) histogram
A) bar chart
B) line graph
C) scatterplot
D) histogram
Question
The following table is an example of what type of graph?
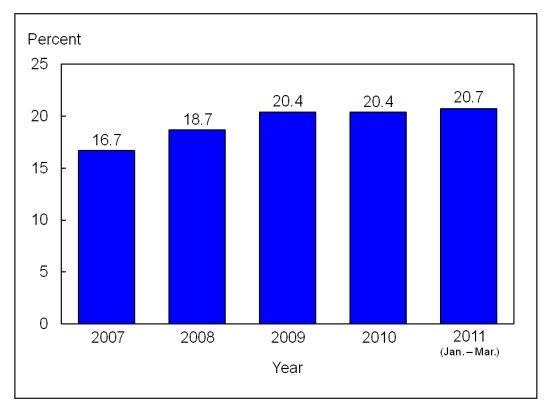
A) bar chart
B) line graph
C) scatterplot
D) histogram
G)
A) bar chart
B) line graph
C) scatterplot
D) histogram
G)
Question
Each dot on the following scatterplot indicates:
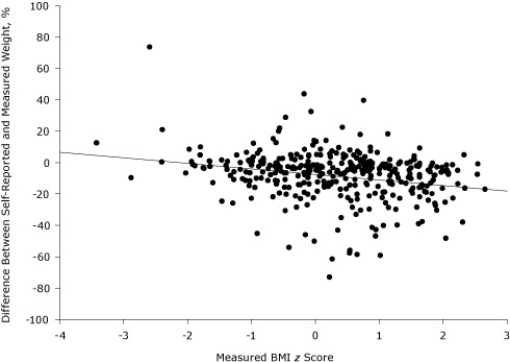
A) the subjects measured BMI (z scor
B) the relationship between caloric intake and self-reported BMI
C) the difference between self-reported and actual BMI Z score
D) the subject's z score
E) and the difference in the subjects measured BMI and self-reported BMI
A) the subjects measured BMI (z scor
B) the relationship between caloric intake and self-reported BMI
C) the difference between self-reported and actual BMI Z score
D) the subject's z score
E) and the difference in the subjects measured BMI and self-reported BMI
Question
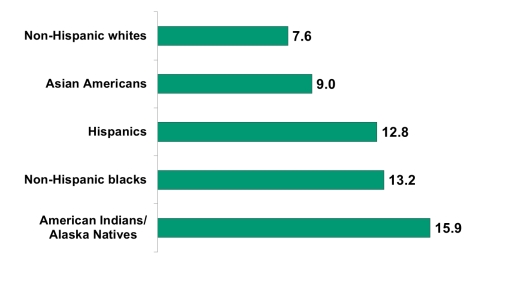
Use the following table to determine which racial group has the highest percent of adults diagnosed with diabetes.
Adults diagnosed with diabetes (%)
 (Source: 2010-2012 National Health Interview Survey and
2012 Indian Health Service's National Patient Information Reporting System. )
A) Hispanics
B) Non-Hispanic Blacks
C) Asian Americans
D) American Indians/Alaska Natives
Adults diagnosed with diabetes (%)
(Source: 2010-2012 National Health Interview Survey and2012 Indian Health Service's National Patient Information Reporting System. )
A) Hispanics
B) Non-Hispanic Blacks
C) Asian Americans
D) American Indians/Alaska Natives
Question
Question
Question
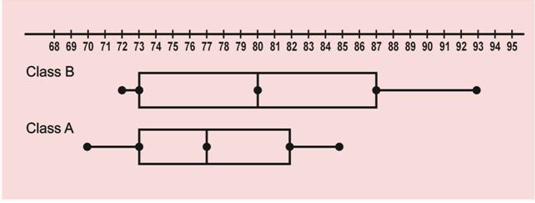 Two groups of nurses attended their CPR recertification class. Group A was in class in the morning and Group B was in class in the afternoon. According to this table which nursing class had a higher median exam score?
A) Group A
B) Group B
C) They had the same median exam score.
D) Unable to determine
Question
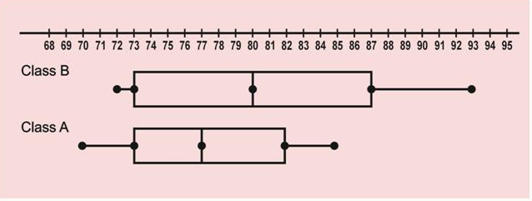 Two groups of nurses attended their CPR recertification class. Group A was in class in the morning and Group B was in class in the afternoon. According to this table Group B had tests scores that ranged between what values?
A) 72-93
B) 72-80
C) 69-85
D) 73-87
Question
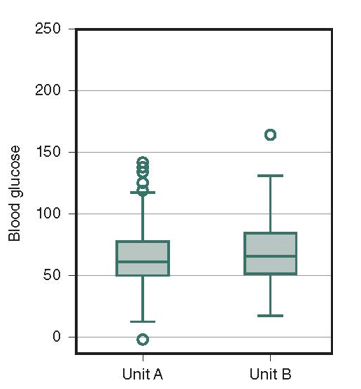 The median blood level was higher on which unit?
A) Unit A
B) Unit B
C) They are the same
D) Unable to determine
Question
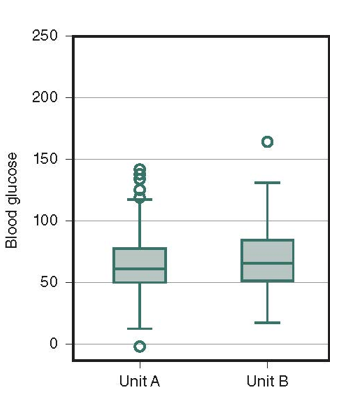 Looking at the box and whiskers plot that is above. How might the outlier in Unit B inpact the average blood glucose level?
A) It would significantly impact the median in Unit A.
B) The median would fall within the second and third quartile in both Unit A and Unit B.
C) There is no impact from outliers in Unit B.
D) It could increase the mean in Unit B.

Unlock Deck
Sign up to unlock the cards in this deck!
Unlock Deck
Unlock Deck
1/20
Play
Full screen (f)
Deck 2: Presenting Data
1
A nurse orientation program director is examining data about nurses in their first year of practice at her hospital. Use the table below to answer the following question.
During what time frame were the most medication errors made?
A) 1-3 months
B) 4-6 months
C) 7-9 months
D) 10-12 months
During what time frame were the most medication errors made?
A) 1-3 months
B) 4-6 months
C) 7-9 months
D) 10-12 months
4-6 months
2
A nurse orientation program director is examining data about nurses in their first year of practice at her hospital. Use the table below to answer the following question.
What percentage of the medication errors were made in the first nine months of practice?
A) 77.8%
B) 26.7%
C) 35.0%
D) 34.3%
What percentage of the medication errors were made in the first nine months of practice?
A) 77.8%
B) 26.7%
C) 35.0%
D) 34.3%
77.8%
3
A nurse orientation program director is examining data about nurses in their first year of practice at her hospital. She notices that the number of medication errors increases after the three month supervised orientation ends and then slowly drops down again. The time period immediately after orientation is considered a critical juncture. What might she suggest to address this concern?
A) Changing orientation to one month
B) Eliminating the math exam required of all nurses
C) Requiring double signed med administration documentation through the first six months of practice
D) Requiring all nurses to be oriented for a 15 months
A) Changing orientation to one month
B) Eliminating the math exam required of all nurses
C) Requiring double signed med administration documentation through the first six months of practice
D) Requiring all nurses to be oriented for a 15 months
Requiring double signed med administration documentation through the first six months of practice
4
Researchers examined the relationship between interpersonal violence and health in college age women. They include an independent variable of exposure to violence from an intimate partner, other personal violence or both. The researchers wish to present a table showing the frequencies for each of these exposures. What might you suggest to best display the data?
A) Line graph
B) Scatterplot
C) Grouped Frequency table
D) Bar chart
A) Line graph
B) Scatterplot
C) Grouped Frequency table
D) Bar chart
Unlock Deck
Unlock for access to all 20 flashcards in this deck.
Unlock Deck
k this deck
5
Researchers examined the relationship between interpersonal violence and health in college age women. They received 490 responses. Of those responses 89 women reported being abused at some point in their lifetime and 355 reported no history of abuse. What percentage of the sample were abused?
A) 25.1%
B) 18.2%
C) 79.4%
D) 92.0%
A) 25.1%
B) 18.2%
C) 79.4%
D) 92.0%
Unlock Deck
Unlock for access to all 20 flashcards in this deck.
Unlock Deck
k this deck
6
Researchers examined the relationship between interpersonal violence and health in college age women. Of those responses 92 women reported being abused at some point in their lifetime and 355 reported no history of abuse. 174 of the non-abused women and 58 of the abused women had a score of three or greater on the psychological distress scale. What was the cumulative frequency of scores less than three in non-abused women?
A) 174
B) 34
C) 181
D) 355
A) 174
B) 34
C) 181
D) 355
Unlock Deck
Unlock for access to all 20 flashcards in this deck.
Unlock Deck
k this deck
7
A study reports the frequency of passing a cultural competency exam for nurses with an associate's degree, nurses with a baccalaureate degree, nurses with a master's degree, and nurses with a doctoral degree. If the researchers were to present this information in a table which one would you recommend?
A) Scatter plot
B) Bar chart
C) Line graph
D) Histogram
A) Scatter plot
B) Bar chart
C) Line graph
D) Histogram
Unlock Deck
Unlock for access to all 20 flashcards in this deck.
Unlock Deck
k this deck
8
Your hospital had 317 reports of patients having allergic reactions in 2016. In 2017, you implemented the hospital wide use of latex free products and eliminated approximately 76% of the allergic reactions among patients. How many allergic reactions were reported in 2017?
A) 76
B) 241
C) 300
D) Unable to determine
A) 76
B) 241
C) 300
D) Unable to determine
Unlock Deck
Unlock for access to all 20 flashcards in this deck.
Unlock Deck
k this deck
9
Which state has the largest percentage of adults with asthma who have fair or poor health?
A) AL
B) AZ
C) AR
D) Unable to determine
A) AL
B) AZ
C) AR
D) Unable to determine
Unlock Deck
Unlock for access to all 20 flashcards in this deck.
Unlock Deck
k this deck
10
Use the following graph.
Which state has the largest number of people who are do not have asthma and live with fair to poor health?
A) AL
B) AZ
C) AR
D) Unable to determine
Which state has the largest number of people who are do not have asthma and live with fair to poor health?
A) AL
B) AZ
C) AR
D) Unable to determine
Unlock Deck
Unlock for access to all 20 flashcards in this deck.
Unlock Deck
k this deck
11
The following is an example of what type of graph?
A) bar chart
B) line graph
C) scatterplot
D) histogram
A) bar chart
B) line graph
C) scatterplot
D) histogram
Unlock Deck
Unlock for access to all 20 flashcards in this deck.
Unlock Deck
k this deck
12
The following table is an example of what type of graph?
A) bar chart
B) line graph
C) scatterplot
D) histogram
G)
A) bar chart
B) line graph
C) scatterplot
D) histogram
G)
Unlock Deck
Unlock for access to all 20 flashcards in this deck.
Unlock Deck
k this deck
13
Each dot on the following scatterplot indicates:
A) the subjects measured BMI (z scor
B) the relationship between caloric intake and self-reported BMI
C) the difference between self-reported and actual BMI Z score
D) the subject's z score
E) and the difference in the subjects measured BMI and self-reported BMI
A) the subjects measured BMI (z scor
B) the relationship between caloric intake and self-reported BMI
C) the difference between self-reported and actual BMI Z score
D) the subject's z score
E) and the difference in the subjects measured BMI and self-reported BMI
Unlock Deck
Unlock for access to all 20 flashcards in this deck.
Unlock Deck
k this deck
14
Use the following table to determine which racial group has the highest percent of adults diagnosed with diabetes.
Adults diagnosed with diabetes (%)
(Source: 2010-2012 National Health Interview Survey and
2012 Indian Health Service's National Patient Information Reporting System. )
A) Hispanics
B) Non-Hispanic Blacks
C) Asian Americans
D) American Indians/Alaska Natives
Adults diagnosed with diabetes (%)
(Source: 2010-2012 National Health Interview Survey and2012 Indian Health Service's National Patient Information Reporting System. )
A) Hispanics
B) Non-Hispanic Blacks
C) Asian Americans
D) American Indians/Alaska Natives
Unlock Deck
Unlock for access to all 20 flashcards in this deck.
Unlock Deck
k this deck
15
The following table presents the number of new cases of an emerging infectious disease. What is the relative frequency of the 2017 cases?
A) 40.5%
B) 117
C) 231/289
D) 54%
A) 40.5%
B) 117
C) 231/289
D) 54%
Unlock Deck
Unlock for access to all 20 flashcards in this deck.
Unlock Deck
k this deck
16
The study you are reading reports that there are 673 subjects in the study and 72 are unlicensed personnel, 514 are licensed personnel, and 87 declined to answer the question. What percentage of the subjects are unlicensed personnel?
A) 72%
B) 10.7%
C) 76.3%
D) 12.3%
A) 72%
B) 10.7%
C) 76.3%
D) 12.3%
Unlock Deck
Unlock for access to all 20 flashcards in this deck.
Unlock Deck
k this deck
17
Two groups of nurses attended their CPR recertification class. Group A was in class in the morning and Group B was in class in the afternoon. According to this table which nursing class had a higher median exam score?A) Group A
B) Group B
C) They had the same median exam score.
D) Unable to determine
Unlock Deck
Unlock for access to all 20 flashcards in this deck.
Unlock Deck
k this deck
18
Two groups of nurses attended their CPR recertification class. Group A was in class in the morning and Group B was in class in the afternoon. According to this table Group B had tests scores that ranged between what values?A) 72-93
B) 72-80
C) 69-85
D) 73-87
Unlock Deck
Unlock for access to all 20 flashcards in this deck.
Unlock Deck
k this deck
19
The median blood level was higher on which unit?A) Unit A
B) Unit B
C) They are the same
D) Unable to determine
Unlock Deck
Unlock for access to all 20 flashcards in this deck.
Unlock Deck
k this deck
20
Looking at the box and whiskers plot that is above. How might the outlier in Unit B inpact the average blood glucose level?A) It would significantly impact the median in Unit A.
B) The median would fall within the second and third quartile in both Unit A and Unit B.
C) There is no impact from outliers in Unit B.
D) It could increase the mean in Unit B.
Unlock Deck
Unlock for access to all 20 flashcards in this deck.
Unlock Deck
k this deck
Unlock Deck
Unlock for access to all 20 flashcards in this deck.


