Deck 1: The Web of Life
Full screen (f)
Question
Question
Question
Question
Question
Question
Question
Refer to the figure.
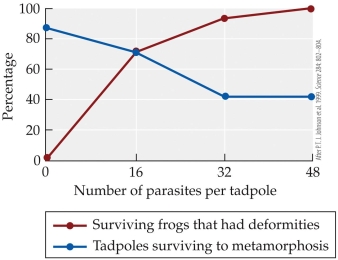
-The figure is based on Johnson's experiment on the effects of trematode parasites on tadpoles. Which statement best describes the control group in the experiment?
A) Tadpoles were grown in the absence of trematode parasites.
B) Tadpoles were allowed to grow in nets in their natural environment.
C) Tadpoles were grown in the presence of only one trematode parasite.
D) Tadpoles were grown in a tank in which the concentration of trematode parasites was similar to the parasite concentration of ponds in which deformed frogs were found.
Question
Refer to the figure.
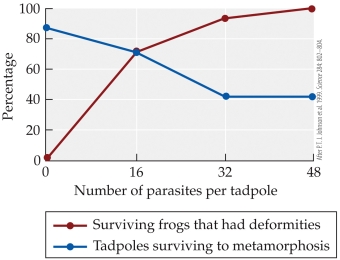
- The figure is based on Johnson's experiment on the effects of trematode parasites on tadpoles. Which claim is supported by the figure?
A) As the number of parasites that the tadpoles were exposed to decreased, the percentage of surviving frogs with deformities increased.
B) As the number of parasites that the tadpoles were exposed to increased, the percentage of surviving tadpoles decreased.
C) If there were no parasites present, 100% of the tadpoles survived to metamorphosis.
D) Tadpoles with moderate levels of parasites had the lowest percent of deformities in adults.
Question
Refer to the figure.

-The figure is based on Johnson's experiment on the effects of trematode parasites on tadpoles. Suppose that 60 tadpoles are exposed to 32 parasites per tadpole. Based on the results of the figure, about how many tadpoles would you expect to survive to metamorphosis?
A) 12
B) 25
C) 40
D) 58
-The figure is based on Johnson's experiment on the effects of trematode parasites on tadpoles. Suppose that 60 tadpoles are exposed to 32 parasites per tadpole. Based on the results of the figure, about how many tadpoles would you expect to survive to metamorphosis?
A) 12
B) 25
C) 40
D) 58
Question
Refer to the figure.
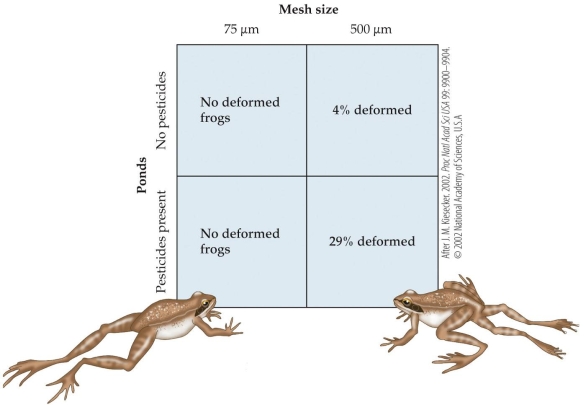
-The figure is based on Kiesecker's field experiments testing the effects of parasites and pesticides on frogs. Which statement is the most valid interpretation of the results?
A) Exposure to parasites was necessary for the frogs to become deformed.
B) All frogs exposed to parasites were deformed.
C) Exposure to pesticides was necessary for frogs to become deformed.
D) Exposure to pesticides had no effect on the percentage of frogs that became deformed.
Question
Refer to the figure.
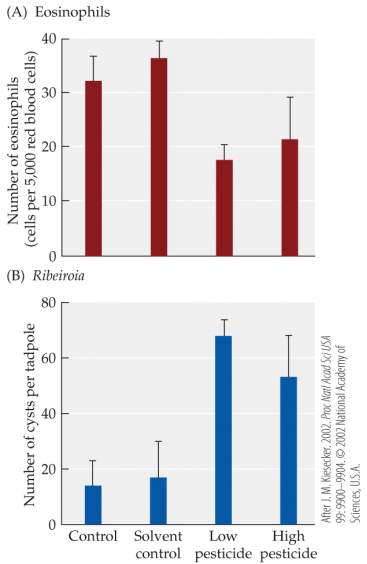
-The figure is based on studies of the effects of pesticides on the tadpole immune system. In a laboratory experiment, wood frog (Rana sylvatica) tadpoles were exposed to low or high concentrations of a pesticide, and then Ribeiroia parasites. The tadpoles were then examined for (A) numbers of eosinophils and (B) numbers of Ribeiroia cysts. Error bars show one SE of the mean. Which statement is supported by the evidence shown in the figure?
A) Tadpoles exposed to high levels of pesticides had more cysts per tadpole than those exposed to low levels of pesticides.
B) Tadpoles exposed to pesticides had fewer eosinophils than those not exposed to pesticides.
C) The number of cysts per tadpole was similar in the solvent control and low pesticide groups.
D) Pesticides decreased eosinophils more when tadpoles were exposed to high concentrations of pesticides than when they were exposed to low concentrations.
Question
Refer to the figure.

- The figure is based on studies of the effects of pesticides on the tadpole immune system. In a laboratory experiment, wood frog (Rana sylvatica) tadpoles were exposed to low or high concentrations of a pesticide, and then Ribeiroia parasites. The tadpoles were then examined for (A) numbers of eosinophils and (B) numbers of Ribeiroia cysts. Error bars show one SE of the mean. Compared with the control group, the frogs exposed to low concentrations of pesticides showed an increase _______ percent in the number of eosinophils.
A) 18
B) 32
C) 55
D) 78
Question
Question
Question
Question
Question
Question
Question
Question
Question
Question
Question
Question
Question
Question
Question
Question
Question
Question
Question
Question
Refer to the figure.
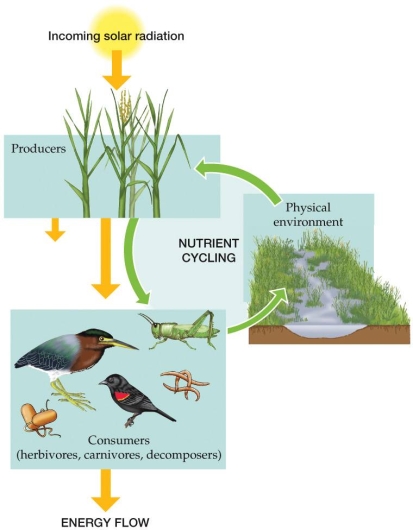 The figure represents energy flow and nutrient cycling through the major components of natural ecosystems. Based on the figure, which statement best describes a major difference between nutrient cycling and energy flow?
A) Nutrients flow through producers and consumers but not through the physical environment.
B) Energy flows through producers and consumers but not through the physical environment.
C) Both nutrients and energy are lost as they travel through the ecosystem.
D) Incoming solar radiation plays a limited role in both nutrient cycling and energy flow.
The figure represents energy flow and nutrient cycling through the major components of natural ecosystems. Based on the figure, which statement best describes a major difference between nutrient cycling and energy flow?A) Nutrients flow through producers and consumers but not through the physical environment.
B) Energy flows through producers and consumers but not through the physical environment.
C) Both nutrients and energy are lost as they travel through the ecosystem.
D) Incoming solar radiation plays a limited role in both nutrient cycling and energy flow.
Question
Question
Question
Refer to the figure.
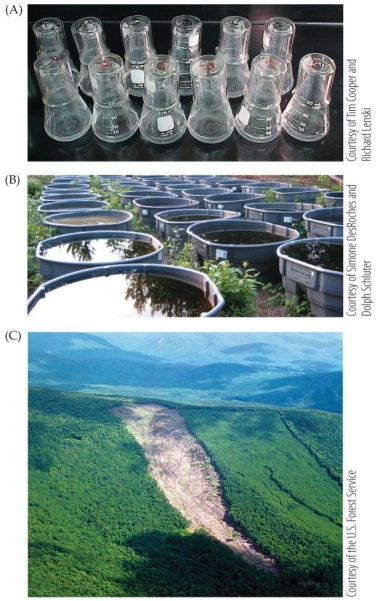 The figure shows three types of experimental setups: laboratory, small-scale field study, and large-scale field study. In which of the following cases would the large-scale field study be the most appropriate?
A) When very detailed, precise measurements are required
B) When the organisms being studied are small and rare
C) When events being studied are long-term or cover large geographic areas
D) When the study is being conducted by environmental scientists rather than ecologists
The figure shows three types of experimental setups: laboratory, small-scale field study, and large-scale field study. In which of the following cases would the large-scale field study be the most appropriate?A) When very detailed, precise measurements are required
B) When the organisms being studied are small and rare
C) When events being studied are long-term or cover large geographic areas
D) When the study is being conducted by environmental scientists rather than ecologists
Question
Question
Question
Question
Question
Refer to the figure.
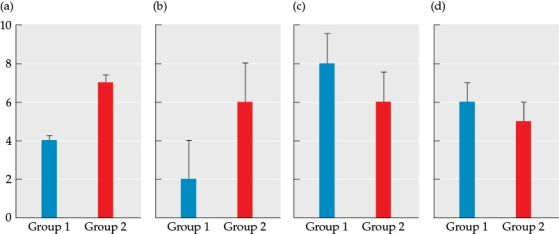 Which figure provides the clearest evidence of a biologically important difference between two treatment groups?
A) Figure a
B) Figure b
C) Figure c
D) Figure d
Which figure provides the clearest evidence of a biologically important difference between two treatment groups?A) Figure a
B) Figure b
C) Figure c
D) Figure d
Question
Question
Refer to the figure.
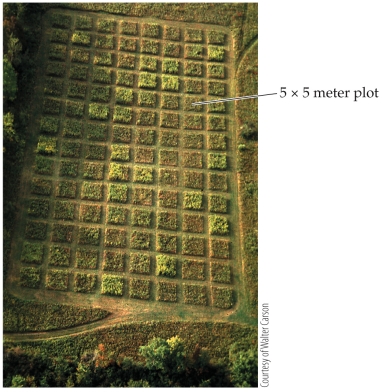
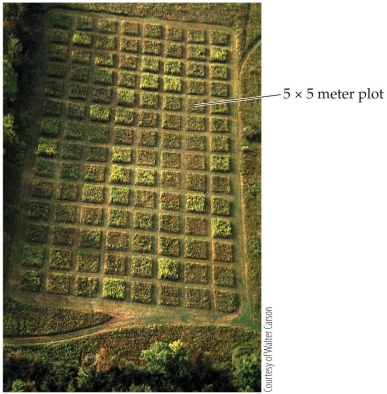 The figure shows a field set up to do controlled ecological experiments, divided into 112 plots each 5 × 5 meters. Suppose 40 plots are chosen for a study, 20 as controls and 20 as experimental plots. The control plots are left untreated. The 20 experimental plots all receive the same treatment: a specific level of insecticide. These experimental plots represent
A) 20 separate experimental treatments.
B) 20 replications of the same treatment.
C) the minimum number of plots needed for statistical analysis.
D) the number of plots needed to match the control plots.
The figure shows a field set up to do controlled ecological experiments, divided into 112 plots each 5 × 5 meters. Suppose 40 plots are chosen for a study, 20 as controls and 20 as experimental plots. The control plots are left untreated. The 20 experimental plots all receive the same treatment: a specific level of insecticide. These experimental plots representA) 20 separate experimental treatments.
B) 20 replications of the same treatment.
C) the minimum number of plots needed for statistical analysis.
D) the number of plots needed to match the control plots.
Question
Refer to the table.
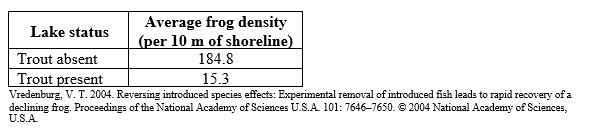 The table represents the result of a survey of 39 lakes, some with and some without introduced rainbow or brook trout. The values are averages of the number of frogs present along a 10-meter piece of shoreline in lakes with and without trout. Given these results, one can conclude that
A) introducing trout into a lake seriously depletes the number of frogs present.
B) introducing trout into a lake has little or no effect on the number of frogs present.
C) introduced rainbow trout decrease frog populations but introduced brook trout do not.
D) introduced brook trout decrease frog populations but introduced rainbow trout do not.
The table represents the result of a survey of 39 lakes, some with and some without introduced rainbow or brook trout. The values are averages of the number of frogs present along a 10-meter piece of shoreline in lakes with and without trout. Given these results, one can conclude thatA) introducing trout into a lake seriously depletes the number of frogs present.
B) introducing trout into a lake has little or no effect on the number of frogs present.
C) introduced rainbow trout decrease frog populations but introduced brook trout do not.
D) introduced brook trout decrease frog populations but introduced rainbow trout do not.
Question
Refer to the figure.
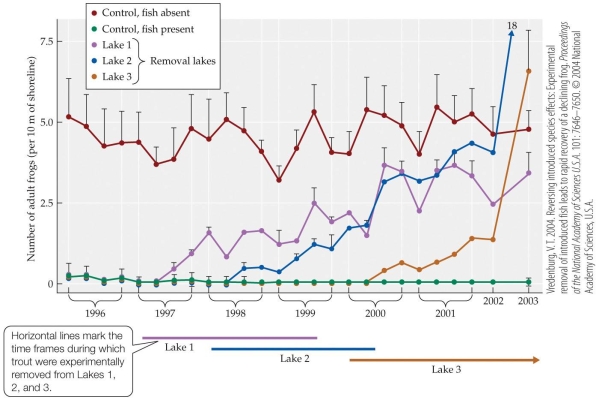 The figure represents the results of an experiment by Vredenburg, who compared the numbers of frogs in several categories of lakes: lakes never having trout (control), lakes having trout (control), and lakes from which he removed trout at different times. He observed changes in frog populations over eight years in all lakes. Based on evidence from the figure, which conclusion can be made about the effect of trout removal on frog populations?
A) Frog populations in some lakes overpopulate after the removal of trout.
B) Frog populations increase in some removal lakes but not in others.
C) Frog populations never recover once trout have been introduced.
D) Frog populations begin to recover once trout are removed.
The figure represents the results of an experiment by Vredenburg, who compared the numbers of frogs in several categories of lakes: lakes never having trout (control), lakes having trout (control), and lakes from which he removed trout at different times. He observed changes in frog populations over eight years in all lakes. Based on evidence from the figure, which conclusion can be made about the effect of trout removal on frog populations?A) Frog populations in some lakes overpopulate after the removal of trout.
B) Frog populations increase in some removal lakes but not in others.
C) Frog populations never recover once trout have been introduced.
D) Frog populations begin to recover once trout are removed.
Question
Question
Question
Question
Question
Question
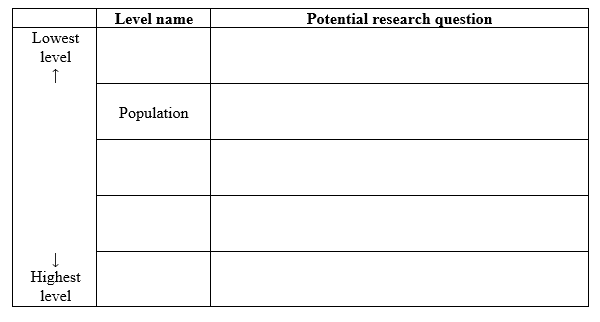
A rare, highly endangered bird species lives in a very remote area of the Amazonian rainforest. Almost nothing is currently known about this species' diet, behavior, life-span, breeding system, or its interactions with other species. Ecological research can be conducted at five major levels or scales (note that one has already been entered into the table). Complete the table, listing the four other potential levels of ecological study in order from the lowest to the highest level. For each level, list one potential research question that could be asked in a study of the endangered bird species.
Question
Question
Question
Question
Question
Refer to the figure.
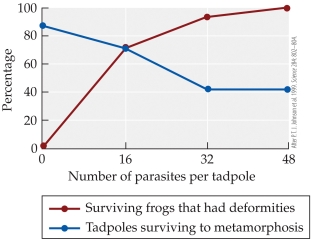 The figure is based on Johnson's experiment on the effects of trematode parasites on tadpoles. According to the figure, how did adding 16 parasites per tadpole to a group of tadpoles affect their survival?
A) It caused a 20% increase.
B) It resulted in no change.
C) It caused a 10% decrease.
D) It caused a 20% decrease.
The figure is based on Johnson's experiment on the effects of trematode parasites on tadpoles. According to the figure, how did adding 16 parasites per tadpole to a group of tadpoles affect their survival?A) It caused a 20% increase.
B) It resulted in no change.
C) It caused a 10% decrease.
D) It caused a 20% decrease.
Question
Refer to the figures.
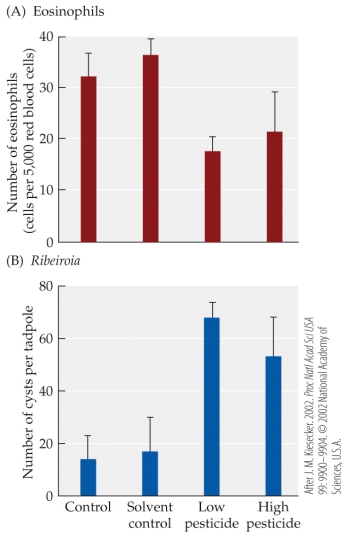 The figures are based on studies of the effects of pesticides on the tadpole immune system. In a laboratory experiment, wood frog (Rana sylvatica) tadpoles were exposed to low or high concentrations of a pesticide, and then to Ribeiroia parasites. The tadpoles were then examined for (A) numbers of eosinophils and (B) numbers of Ribeiroia cysts. Error bars show one SD of the mean. Compared with the control group, the frogs exposed to low concentrations of pesticides had about how many times as many parasite cysts?
A) 1.5
B) 3
C) 4.5
D) 10
The figures are based on studies of the effects of pesticides on the tadpole immune system. In a laboratory experiment, wood frog (Rana sylvatica) tadpoles were exposed to low or high concentrations of a pesticide, and then to Ribeiroia parasites. The tadpoles were then examined for (A) numbers of eosinophils and (B) numbers of Ribeiroia cysts. Error bars show one SD of the mean. Compared with the control group, the frogs exposed to low concentrations of pesticides had about how many times as many parasite cysts?A) 1.5
B) 3
C) 4.5
D) 10
Question
Question
Question
Question
Question
Question
Question
Question
Refer to the figure.
 The figure represents an ecological study done by Carson and Root to study how herbivorous insects affected a plant community. Based on the figure, what type of study were Carson and Root most likely performing?
A) A controlled field experiment
B) An uncontrolled field experiment
C) A laboratory experiment
D) An observational study
The figure represents an ecological study done by Carson and Root to study how herbivorous insects affected a plant community. Based on the figure, what type of study were Carson and Root most likely performing?A) A controlled field experiment
B) An uncontrolled field experiment
C) A laboratory experiment
D) An observational study
Question
Refer to the figure.
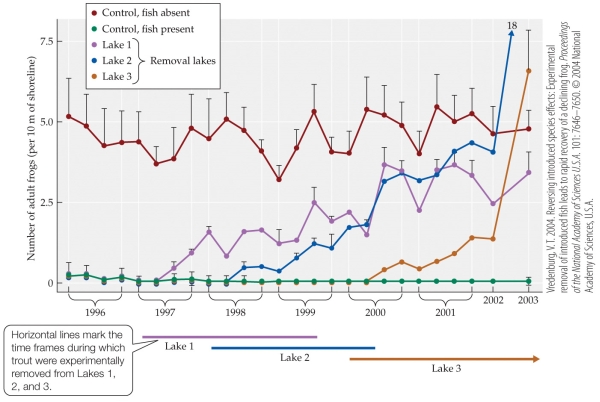 Vredenburg studied the impact of the introduction of rainbow and brook trout on a species of amphibian, the mountain yellow-legged frog (Rana muscosa). After showing greatly decreased frog populations in lakes with trout, he set up an experiment using three categories of lakes: lakes from which he removed trout, lakes that had never had trout, and lakes that still contained trout. He compared the number of adult frogs per 10 m of shoreline in all groups, as shown in the figure. What is the most likely reason that Vredenburg chose to use a large-scale experimental design such as this, rather than a single lake or laboratory experiments?
A) The larger design allowed Vredenburg the ability to do replications.
B) A smaller study would not adequately answer the experimental question.
C) In a larger study, it is easier to manipulate the various experimental treatments.
D) In a real-world situation such as this, all variables can be more easily controlled.
Vredenburg studied the impact of the introduction of rainbow and brook trout on a species of amphibian, the mountain yellow-legged frog (Rana muscosa). After showing greatly decreased frog populations in lakes with trout, he set up an experiment using three categories of lakes: lakes from which he removed trout, lakes that had never had trout, and lakes that still contained trout. He compared the number of adult frogs per 10 m of shoreline in all groups, as shown in the figure. What is the most likely reason that Vredenburg chose to use a large-scale experimental design such as this, rather than a single lake or laboratory experiments?A) The larger design allowed Vredenburg the ability to do replications.
B) A smaller study would not adequately answer the experimental question.
C) In a larger study, it is easier to manipulate the various experimental treatments.
D) In a real-world situation such as this, all variables can be more easily controlled.
Question
Refer to the figure.
 The figure is based on Johnson's controlled experiment on the effects of trematode parasites on tadpoles. The groups in the experiment were the groups containing a specific and different number of parasites per tadpole (0, 16, 32, 48). Which of these groups is the control group?
A) 0.
B) 16
C) 32
D) 48
The figure is based on Johnson's controlled experiment on the effects of trematode parasites on tadpoles. The groups in the experiment were the groups containing a specific and different number of parasites per tadpole (0, 16, 32, 48). Which of these groups is the control group?A) 0.
B) 16
C) 32
D) 48
Question
Question
Refer to the figure.
 Vredenburg studied the impact of introduction of rainbow and brook trout on a species of amphibian, the mountain yellow-legged frog (Rana muscosa). After showing greatly decreased frog populations in lakes with trout, he set up an experiment using three categories of lakes: lakes from which he removed trout, lakes that had never had trout, and lakes that still contained trout. He compared the number of adult frogs per 10 m of shoreline in all groups, as shown in the figure. In Vredenburg's experimental design, why did he use two control groups?
A) To be doubly sure his results were correct
B) To ensure that he had enough data for statistical analysis
C) To control for unknown factors that might be present in the lakes
D) To control for the effects of two known natural conditions
Vredenburg studied the impact of introduction of rainbow and brook trout on a species of amphibian, the mountain yellow-legged frog (Rana muscosa). After showing greatly decreased frog populations in lakes with trout, he set up an experiment using three categories of lakes: lakes from which he removed trout, lakes that had never had trout, and lakes that still contained trout. He compared the number of adult frogs per 10 m of shoreline in all groups, as shown in the figure. In Vredenburg's experimental design, why did he use two control groups?A) To be doubly sure his results were correct
B) To ensure that he had enough data for statistical analysis
C) To control for unknown factors that might be present in the lakes
D) To control for the effects of two known natural conditions

Unlock Deck
Sign up to unlock the cards in this deck!
Unlock Deck
Unlock Deck
1/68
Play
Full screen (f)
Deck 1: The Web of Life
1
What is one reason that amphibians are especially good biological indicators of environmental conditions?
A) They live in both terrestrial and aquatic environments.
B) It is difficult for pollutants to pass through their skin.
C) They are declining in number.
D) They can tolerate high levels of pollution.
A) They live in both terrestrial and aquatic environments.
B) It is difficult for pollutants to pass through their skin.
C) They are declining in number.
D) They can tolerate high levels of pollution.
A
2
The ecological study of the effect of Ribeiroia and pesticides on frog populations suggests that all of these statements about the study of ecology are true except that
A) it describes how organisms affect the environment.
B) it describes how the environment affects organisms.
C) it studies how biotic and abiotic factors affect each other.
D) humans are not part of its subject matter.
A) it describes how organisms affect the environment.
B) it describes how the environment affects organisms.
C) it studies how biotic and abiotic factors affect each other.
D) humans are not part of its subject matter.
D
3
West Nile virus can be considered an example of an unintended consequence of ecological interactions because it
A) originated in Africa.
B) is transmitted by mosquitoes.
C) emerged due to human impacts on the environment.
D) is increasing rapidly due to a rise in trematode populations.
A) originated in Africa.
B) is transmitted by mosquitoes.
C) emerged due to human impacts on the environment.
D) is increasing rapidly due to a rise in trematode populations.
C
4
In 1878, seal hunters introduced rabbits to Macquarie Island, between Australia and Antarctica. The rabbit population soared and the Myxoma virus was then introduced to kill off rabbits. It worked, but the islands' cats, which had depended on the rabbits for food, began eating seabirds instead. To save the seabirds, scientists started a program to kill off the cats. Twenty-four years later, in 2009, the rabbit population had exploded again, and rabbits were ravaging native plant species and devastating the island's ecosystem. This story appears to be an example of
A) sound, responsible ecological management.
B) unintended ecological consequences.
C) predictable but unavoidable consequences.
D) a series of catastrophes resulting from random chance.
A) sound, responsible ecological management.
B) unintended ecological consequences.
C) predictable but unavoidable consequences.
D) a series of catastrophes resulting from random chance.
Unlock Deck
Unlock for access to all 68 flashcards in this deck.
Unlock Deck
k this deck
5
What evidence led Ruth and Sessions to conclude that parasites could be the cause of some of the deformities in the frogs found in the ponds of Northern California?
A) None of the deformed frogs found in the ponds were infected with the parasites.
B) They directly observed the parasites causing the deformities.
C) Glass beads placed near the location of limb development in tadpoles mimicked the effect of parasites and caused deformities.
D) Deformities in the frogs occurred in nature but not in the laboratory.
Unlock Deck
Unlock for access to all 68 flashcards in this deck.
Unlock Deck
k this deck
6
In addition to the frogs themselves, which organisms act as hosts for the flatworm that has been linked to deformities in frogs?
A) Birds and snails
B) Snails and turtles
C) Turtles and birds
D) Snails and clams
A) Birds and snails
B) Snails and turtles
C) Turtles and birds
D) Snails and clams
Unlock Deck
Unlock for access to all 68 flashcards in this deck.
Unlock Deck
k this deck
7
Refer to the figure.
-The figure is based on Johnson's experiment on the effects of trematode parasites on tadpoles. Which statement best describes the control group in the experiment?
A) Tadpoles were grown in the absence of trematode parasites.
B) Tadpoles were allowed to grow in nets in their natural environment.
C) Tadpoles were grown in the presence of only one trematode parasite.
D) Tadpoles were grown in a tank in which the concentration of trematode parasites was similar to the parasite concentration of ponds in which deformed frogs were found.
Unlock Deck
Unlock for access to all 68 flashcards in this deck.
Unlock Deck
k this deck
8
Refer to the figure.
- The figure is based on Johnson's experiment on the effects of trematode parasites on tadpoles. Which claim is supported by the figure?
A) As the number of parasites that the tadpoles were exposed to decreased, the percentage of surviving frogs with deformities increased.
B) As the number of parasites that the tadpoles were exposed to increased, the percentage of surviving tadpoles decreased.
C) If there were no parasites present, 100% of the tadpoles survived to metamorphosis.
D) Tadpoles with moderate levels of parasites had the lowest percent of deformities in adults.
Unlock Deck
Unlock for access to all 68 flashcards in this deck.
Unlock Deck
k this deck
9
Refer to the figure.
-The figure is based on Johnson's experiment on the effects of trematode parasites on tadpoles. Suppose that 60 tadpoles are exposed to 32 parasites per tadpole. Based on the results of the figure, about how many tadpoles would you expect to survive to metamorphosis?
A) 12
B) 25
C) 40
D) 58
-The figure is based on Johnson's experiment on the effects of trematode parasites on tadpoles. Suppose that 60 tadpoles are exposed to 32 parasites per tadpole. Based on the results of the figure, about how many tadpoles would you expect to survive to metamorphosis?
A) 12
B) 25
C) 40
D) 58
Unlock Deck
Unlock for access to all 68 flashcards in this deck.
Unlock Deck
k this deck
10
Refer to the figure.
-The figure is based on Kiesecker's field experiments testing the effects of parasites and pesticides on frogs. Which statement is the most valid interpretation of the results?
A) Exposure to parasites was necessary for the frogs to become deformed.
B) All frogs exposed to parasites were deformed.
C) Exposure to pesticides was necessary for frogs to become deformed.
D) Exposure to pesticides had no effect on the percentage of frogs that became deformed.
Unlock Deck
Unlock for access to all 68 flashcards in this deck.
Unlock Deck
k this deck
11
Refer to the figure.
-The figure is based on studies of the effects of pesticides on the tadpole immune system. In a laboratory experiment, wood frog (Rana sylvatica) tadpoles were exposed to low or high concentrations of a pesticide, and then Ribeiroia parasites. The tadpoles were then examined for (A) numbers of eosinophils and (B) numbers of Ribeiroia cysts. Error bars show one SE of the mean. Which statement is supported by the evidence shown in the figure?
A) Tadpoles exposed to high levels of pesticides had more cysts per tadpole than those exposed to low levels of pesticides.
B) Tadpoles exposed to pesticides had fewer eosinophils than those not exposed to pesticides.
C) The number of cysts per tadpole was similar in the solvent control and low pesticide groups.
D) Pesticides decreased eosinophils more when tadpoles were exposed to high concentrations of pesticides than when they were exposed to low concentrations.
Unlock Deck
Unlock for access to all 68 flashcards in this deck.
Unlock Deck
k this deck
12
Refer to the figure.
- The figure is based on studies of the effects of pesticides on the tadpole immune system. In a laboratory experiment, wood frog (Rana sylvatica) tadpoles were exposed to low or high concentrations of a pesticide, and then Ribeiroia parasites. The tadpoles were then examined for (A) numbers of eosinophils and (B) numbers of Ribeiroia cysts. Error bars show one SE of the mean. Compared with the control group, the frogs exposed to low concentrations of pesticides showed an increase _______ percent in the number of eosinophils.
A) 18
B) 32
C) 55
D) 78
Unlock Deck
Unlock for access to all 68 flashcards in this deck.
Unlock Deck
k this deck
13
Which statement is least accurate in describing the field of ecology?
A) Ecology involves the scientific study of interactions between organisms and their environment.
B) Ecology is an interdisciplinary field that incorporates concepts from the natural sciences, politics, and ethics.
C) Ecology involves the scientific study of interactions that determine the distribution and abundance of organisms.
D) Ecological research can focus on many scales, from individuals up to biospheres.
Unlock Deck
Unlock for access to all 68 flashcards in this deck.
Unlock Deck
k this deck
14
An ecologist studying ecosystems would be most interested in which question?
A) Is a predator species maintaining species diversity by selectively preying on the most abundant prey species?
B) How much nitrogen is being taken up by organisms in a given place?
C) How does temperature affect survivorship of marmots?
D) How do features of the landscape affect the movement of bears?
Unlock Deck
Unlock for access to all 68 flashcards in this deck.
Unlock Deck
k this deck
15
Scientists are concerned about the growing problem of dead zones in the Gulf of Mexico, which are caused primarily by fertilizer runoff entering the Mississippi River. Which question related to this topic would most likely be studied by an environmental scientist, as opposed to an ecologist?
A) How does the presence of fertilizers in river water affect fish populations along the river?
B) What is the total amount of fertilizer runoff reaching the Gulf of Mexico per year?
C) What economic incentives might be offered to farmers to encourage them to decrease fertilizer runoff?
D) Which types of algae and bacteria undergo population explosions in the Gulf due to increased nutrient content, and during what times of year do they occur?
Unlock Deck
Unlock for access to all 68 flashcards in this deck.
Unlock Deck
k this deck
16
Scientist A works in a laboratory, studying the effects of CO2 levels on algae and zooplankton. Scientist B works at a field station studying how changing CO2 levels in the atmosphere affect algae and zooplankton in the ocean. Scientist C works in Washington, D.C., lobbying members of Congress to pass legislation to lower CO2 emissions from cars and power plants. How would these three scientists most likely be classified?
A) Scientists A and B are ecologists; Scientist C is an environmental scientist.
B) Scientist A is an ecologist; Scientists B and C are environmental scientists.
C) Scientists A and B are environmental scientists; Scientist C is an ecologist.
D) All three are environmental scientists.
A) Scientists A and B are ecologists; Scientist C is an environmental scientist.
B) Scientist A is an ecologist; Scientists B and C are environmental scientists.
C) Scientists A and B are environmental scientists; Scientist C is an ecologist.
D) All three are environmental scientists.
Unlock Deck
Unlock for access to all 68 flashcards in this deck.
Unlock Deck
k this deck
17
The most appropriate spatial scale for a study of world climatic processes would likely be
A) cubic millimeters.
B) cubic centimeters.
C) cubic meters.
D) cubic kilometers.
A) cubic millimeters.
B) cubic centimeters.
C) cubic meters.
D) cubic kilometers.
Unlock Deck
Unlock for access to all 68 flashcards in this deck.
Unlock Deck
k this deck
18
It is difficult to study the process of evolution in most species of organisms because
A) evolution occurs over many generations, so time scales required for studies are very long.
B) the effects of evolution are usually difficult or impossible to observe.
C) evolutionary studies require collecting data on many species at the same time.
D) there is no way to know what a species' ancestors were like.
Unlock Deck
Unlock for access to all 68 flashcards in this deck.
Unlock Deck
k this deck
19
Suppose that individuals of a particular strain of the fruit fly, Drosophila melanogaster, reproduces rapidly and uses up its food supply quickly, resulting in a population explosion and rapid die-off within its laboratory container. This phenomenon can be considered evidence that
A) nature requires a balance that must be maintained.
B) all species are interconnected and interact with each other.
C) all species are dependent on the non-living environment.
D) a change in one aspect of a life cycle can alter other parts.
A) nature requires a balance that must be maintained.
B) all species are interconnected and interact with each other.
C) all species are dependent on the non-living environment.
D) a change in one aspect of a life cycle can alter other parts.
Unlock Deck
Unlock for access to all 68 flashcards in this deck.
Unlock Deck
k this deck
20
Which statement is not likely to be true within an ecological community?
A) Organisms have unlimited resources.
B) Environmental conditions change over time.
C) Environmental conditions change from one place to another.
D) Species evolve over time.
A) Organisms have unlimited resources.
B) Environmental conditions change over time.
C) Environmental conditions change from one place to another.
D) Species evolve over time.
Unlock Deck
Unlock for access to all 68 flashcards in this deck.
Unlock Deck
k this deck
21
An ecosystem undergoes a disturbance, and as it recovers, its species composition changes: the new ecosystem is different from the original. This suggests that
A) the necessary balance of nature has been maintained.
B) ecosystems remain unchanged through time.
C) ecosystems may change with changing circumstances.
D) the new ecosystem was incorrectly described; it is the same as the original.
A) the necessary balance of nature has been maintained.
B) ecosystems remain unchanged through time.
C) ecosystems may change with changing circumstances.
D) the new ecosystem was incorrectly described; it is the same as the original.
Unlock Deck
Unlock for access to all 68 flashcards in this deck.
Unlock Deck
k this deck
22
A group of individuals of a single species of swamp sparrows lives in the Quabbin Reservoir in Massachusetts, and these individuals interact with one another. This is an example of a(n)
A) biosphere.
B) community.
C) ecosystem.
D) population.
A) biosphere.
B) community.
C) ecosystem.
D) population.
Unlock Deck
Unlock for access to all 68 flashcards in this deck.
Unlock Deck
k this deck
23
Which sequence represents the correct order of levels of biological organization, from largest to smallest?
A) Biosphere > ecosystem > population > community
B) Biosphere > population > ecosystem > community
C) Biosphere > ecosystem > community > population
D) Ecosystem > biosphere > community > population
A) Biosphere > ecosystem > population > community
B) Biosphere > population > ecosystem > community
C) Biosphere > ecosystem > community > population
D) Ecosystem > biosphere > community > population
Unlock Deck
Unlock for access to all 68 flashcards in this deck.
Unlock Deck
k this deck
24
Which quality is a biotic feature of the environment?
A) The density of consumers
B) The average minimum temperature at night
C) The number of days during which at least 1 mm of rain falls
D) The pH of the soils
A) The density of consumers
B) The average minimum temperature at night
C) The number of days during which at least 1 mm of rain falls
D) The pH of the soils
Unlock Deck
Unlock for access to all 68 flashcards in this deck.
Unlock Deck
k this deck
25
Which statement about the concept of natural selection is false?
A) During natural selection, different individuals survive and reproduce at different rates based on their specific characteristics.
B) During natural selection, organisms who survive and reproduce at a greater rate pass on more of their genes to the next generation.
C) The frequency of a trait favored by natural selection will increase over generations whether the trait is heritable or not.
D) Only natural selection can produce adaptations consistently.
Unlock Deck
Unlock for access to all 68 flashcards in this deck.
Unlock Deck
k this deck
26
An example of a trait that cannot evolve by natural selection is a trait that
A) increases the time during which females are capable of reproduction.
B) increases the ability of an organism to survive high temperatures but not low temperatures.
C) increases the ability of an organism to survive low temperatures but not high temperatures
D) results from an individual's life experiences and does not have a genetic basis.
Unlock Deck
Unlock for access to all 68 flashcards in this deck.
Unlock Deck
k this deck
27
A plant species has two different varieties, the characteristics of which are heritable. One grows very quickly to a large size, while the other grows slowly and remains small. The large plants produce 500 seeds when they reproduce; 20 of those seeds sprout and survive to become large adult plants. The small plants produce 100 seeds; 40 of those seeds sprout and survive to become small adult plants. Which variety is more likely to be better adapted to its environment?
A) The small plant variety is better adapted.
B) The large plant variety is better adapted.
C) The two varieties are equally well adapted.
D) There is not enough information to decide.
A) The small plant variety is better adapted.
B) The large plant variety is better adapted.
C) The two varieties are equally well adapted.
D) There is not enough information to decide.
Unlock Deck
Unlock for access to all 68 flashcards in this deck.
Unlock Deck
k this deck
28
Which statement about the relationship between consumers and producers is true?
A) Consumers obtain energy by eating other organisms; producers obtain energy by decomposing dead matter.
B) Consumers obtain energy from an external source to produce their own food; producers obtain energy by decomposing dead matter.
C) Consumers obtain energy by eating other organisms; producers use energy from an external source to produce their own food.
D) Consumers and producers both obtain energy by eating other organisms; the difference lies in what types of organisms they eat.
Unlock Deck
Unlock for access to all 68 flashcards in this deck.
Unlock Deck
k this deck
29
Net primary production (NPP) is the amount of
A) heat lost through respiration, minus the energy gained by photosynthesis or other means.
B) energy that producers fix by photosynthesis or other means, minus the amount lost as heat in cellular respiration.
C) energy gained through consumption, minus the amount lost as heat in cellular respiration.
D) energy that producers fix by photosynthesis or other means, minus the amount lost through death of tissue.
Unlock Deck
Unlock for access to all 68 flashcards in this deck.
Unlock Deck
k this deck
30
In a grassland ecosystem, plants capture 180 units per day of solar energy, and use 70 units per day in respiration. Animals consume about 20 units per day of the plants. The NPP of this system, in units per day, is
A) 70.
B) 90.
C) 110.
D) 180.
A) 70.
B) 90.
C) 110.
D) 180.
Unlock Deck
Unlock for access to all 68 flashcards in this deck.
Unlock Deck
k this deck
31
Which statement about the movement of energy through ecosystems is true?
A) Energy can be recycled through consumers and producers.
B) Energy can move in one direction only and cannot be recycled.
C) Energy can reverse direction if organisms are allowed to decompose.
D) Recent technology allows us to recycle the energy in our ecosystem.
A) Energy can be recycled through consumers and producers.
B) Energy can move in one direction only and cannot be recycled.
C) Energy can reverse direction if organisms are allowed to decompose.
D) Recent technology allows us to recycle the energy in our ecosystem.
Unlock Deck
Unlock for access to all 68 flashcards in this deck.
Unlock Deck
k this deck
32
Refer to the figure.
The figure represents energy flow and nutrient cycling through the major components of natural ecosystems. Based on the figure, which statement best describes a major difference between nutrient cycling and energy flow?
A) Nutrients flow through producers and consumers but not through the physical environment.
B) Energy flows through producers and consumers but not through the physical environment.
C) Both nutrients and energy are lost as they travel through the ecosystem.
D) Incoming solar radiation plays a limited role in both nutrient cycling and energy flow.
The figure represents energy flow and nutrient cycling through the major components of natural ecosystems. Based on the figure, which statement best describes a major difference between nutrient cycling and energy flow?A) Nutrients flow through producers and consumers but not through the physical environment.
B) Energy flows through producers and consumers but not through the physical environment.
C) Both nutrients and energy are lost as they travel through the ecosystem.
D) Incoming solar radiation plays a limited role in both nutrient cycling and energy flow.
Unlock Deck
Unlock for access to all 68 flashcards in this deck.
Unlock Deck
k this deck
33
An ecologist wants to study a large forest ecosystem which was last studied more than 50 years ago. She hopes to document the changes that have occurred in plant species composition, in light of recent global warming. She will probably begin her study using which method?
A) Field observations
B) Field experiments
C) Controlled laboratory experiments
D) Quantitative mathematical models
A) Field observations
B) Field experiments
C) Controlled laboratory experiments
D) Quantitative mathematical models
Unlock Deck
Unlock for access to all 68 flashcards in this deck.
Unlock Deck
k this deck
34
An ecologist is studying the impacts of the aquaculture of a fish species on an estuary. His study involves three experimental setups: 1) A controlled laboratory experiment in which fish are kept in small aquaria, 2) A controlled field experiment in which the fish are kept in large tanks, and 3) A field experiment in the estuary itself, in which the fish are kept in mesh cages so their secretions enter the estuary water. In all cases, the ecologist measures specific chemical factors to determine the fishes' effect on water quality. Later, he will combine results of all experiments into an aquaculture model. Why might the ecologist choose to use this complex set of experimental setups rather than just choosing one?
A) Each spatial scale provides different types of information, resulting in a more thorough and precise picture of the aquaculture ecosystem's impacts.
B) Each spatial scale gives one part of the total picture; putting them all together provides complete information on all characteristics of the aquaculture ecosystem.
C) Using several types of experimental designs allows the scientist to compare the different sets of data and decide which one is most accurate.
D) The different experimental setups represent replications of the aquaculture ecosystem; averaging them gives an accurate picture of the total system.
Unlock Deck
Unlock for access to all 68 flashcards in this deck.
Unlock Deck
k this deck
35
Refer to the figure.
The figure shows three types of experimental setups: laboratory, small-scale field study, and large-scale field study. In which of the following cases would the large-scale field study be the most appropriate?
A) When very detailed, precise measurements are required
B) When the organisms being studied are small and rare
C) When events being studied are long-term or cover large geographic areas
D) When the study is being conducted by environmental scientists rather than ecologists
The figure shows three types of experimental setups: laboratory, small-scale field study, and large-scale field study. In which of the following cases would the large-scale field study be the most appropriate?A) When very detailed, precise measurements are required
B) When the organisms being studied are small and rare
C) When events being studied are long-term or cover large geographic areas
D) When the study is being conducted by environmental scientists rather than ecologists
Unlock Deck
Unlock for access to all 68 flashcards in this deck.
Unlock Deck
k this deck
36
Biologists find that worms treated with a hormone live 1.3 days longer than untreated worms. To assess whether these differences are significant, the biologists would most likely use which aspect of the scientific process?
A) A control group
B) Replication
C) Mathematical modeling
D) Statistical analysis
A) A control group
B) Replication
C) Mathematical modeling
D) Statistical analysis
Unlock Deck
Unlock for access to all 68 flashcards in this deck.
Unlock Deck
k this deck
37
Ecologists try to reduce the likelihood that variables that are not under the control of the experimenter will unduly influence the results of an experiment by
A) replicating each treatment, including the control.
B) assigning treatments to subjects or plots methodically.
C) never performing the same experiment twice, but trying instead to improve each experiment.
D) carefully setting up experiments so that the results are identical and do not need to be statistically analyzed to prove the result.
Unlock Deck
Unlock for access to all 68 flashcards in this deck.
Unlock Deck
k this deck
38
In studies of seed production, why is it important to assign plots of land to either the control group or treatment group at random?
A) It increases the likelihood that the treatment group will show a difference from the control group.
B) It decreases the likelihood that plots receiving a particular treatment share other characteristics that might influence seed production.
C) It increases the likelihood that the study can be scaled up to a higher level.
D) It decreases the likelihood that the results of the study will be challenged.
Unlock Deck
Unlock for access to all 68 flashcards in this deck.
Unlock Deck
k this deck
39
Which of the following is not part of the scientific method used in studying frog deformities?
A) Observations of nature leading to questions about those observations
B) Understanding the social and political consequences of the study
C) Use of previous knowledge to develop possible answers to the hypotheses
D) Evaluation of competing hypotheses by means of experiments and careful observation
Unlock Deck
Unlock for access to all 68 flashcards in this deck.
Unlock Deck
k this deck
40
Refer to the figure.
Which figure provides the clearest evidence of a biologically important difference between two treatment groups?
A) Figure a
B) Figure b
C) Figure c
D) Figure d
Which figure provides the clearest evidence of a biologically important difference between two treatment groups?A) Figure a
B) Figure b
C) Figure c
D) Figure d
Unlock Deck
Unlock for access to all 68 flashcards in this deck.
Unlock Deck
k this deck
41
Suppose you were examining whether a synthetic chemical reduced the growth rate of mice. Which action would you take to ensure a controlled experiment?
A) Allow some mice to roam between cages, while having others remained confined to a single cage.
B) Exclude one group of mice from exposure to the chemical, but otherwise treat all of the mice in the same manner.
C) Compare a natural population of mice exposed to the chemical to a natural population not exposed to the chemical.
D) Use computer programs to analyze the results from all treatment groups.
Unlock Deck
Unlock for access to all 68 flashcards in this deck.
Unlock Deck
k this deck
42
Refer to the figure.
The figure shows a field set up to do controlled ecological experiments, divided into 112 plots each 5 × 5 meters. Suppose 40 plots are chosen for a study, 20 as controls and 20 as experimental plots. The control plots are left untreated. The 20 experimental plots all receive the same treatment: a specific level of insecticide. These experimental plots represent
A) 20 separate experimental treatments.
B) 20 replications of the same treatment.
C) the minimum number of plots needed for statistical analysis.
D) the number of plots needed to match the control plots.
The figure shows a field set up to do controlled ecological experiments, divided into 112 plots each 5 × 5 meters. Suppose 40 plots are chosen for a study, 20 as controls and 20 as experimental plots. The control plots are left untreated. The 20 experimental plots all receive the same treatment: a specific level of insecticide. These experimental plots representA) 20 separate experimental treatments.
B) 20 replications of the same treatment.
C) the minimum number of plots needed for statistical analysis.
D) the number of plots needed to match the control plots.
Unlock Deck
Unlock for access to all 68 flashcards in this deck.
Unlock Deck
k this deck
43
Refer to the table.
The table represents the result of a survey of 39 lakes, some with and some without introduced rainbow or brook trout. The values are averages of the number of frogs present along a 10-meter piece of shoreline in lakes with and without trout. Given these results, one can conclude that
A) introducing trout into a lake seriously depletes the number of frogs present.
B) introducing trout into a lake has little or no effect on the number of frogs present.
C) introduced rainbow trout decrease frog populations but introduced brook trout do not.
D) introduced brook trout decrease frog populations but introduced rainbow trout do not.
The table represents the result of a survey of 39 lakes, some with and some without introduced rainbow or brook trout. The values are averages of the number of frogs present along a 10-meter piece of shoreline in lakes with and without trout. Given these results, one can conclude thatA) introducing trout into a lake seriously depletes the number of frogs present.
B) introducing trout into a lake has little or no effect on the number of frogs present.
C) introduced rainbow trout decrease frog populations but introduced brook trout do not.
D) introduced brook trout decrease frog populations but introduced rainbow trout do not.
Unlock Deck
Unlock for access to all 68 flashcards in this deck.
Unlock Deck
k this deck
44
Refer to the figure.
The figure represents the results of an experiment by Vredenburg, who compared the numbers of frogs in several categories of lakes: lakes never having trout (control), lakes having trout (control), and lakes from which he removed trout at different times. He observed changes in frog populations over eight years in all lakes. Based on evidence from the figure, which conclusion can be made about the effect of trout removal on frog populations?
A) Frog populations in some lakes overpopulate after the removal of trout.
B) Frog populations increase in some removal lakes but not in others.
C) Frog populations never recover once trout have been introduced.
D) Frog populations begin to recover once trout are removed.
The figure represents the results of an experiment by Vredenburg, who compared the numbers of frogs in several categories of lakes: lakes never having trout (control), lakes having trout (control), and lakes from which he removed trout at different times. He observed changes in frog populations over eight years in all lakes. Based on evidence from the figure, which conclusion can be made about the effect of trout removal on frog populations?A) Frog populations in some lakes overpopulate after the removal of trout.
B) Frog populations increase in some removal lakes but not in others.
C) Frog populations never recover once trout have been introduced.
D) Frog populations begin to recover once trout are removed.
Unlock Deck
Unlock for access to all 68 flashcards in this deck.
Unlock Deck
k this deck
45
What is the current consensus view regarding the primary cause of amphibian deformities and declines?
A) The primary cause is habitat loss.
B) The primary cause is parasites and diseases.
C) The primary cause is global warming.
D) There is no current consensus as more research is needed.
A) The primary cause is habitat loss.
B) The primary cause is parasites and diseases.
C) The primary cause is global warming.
D) There is no current consensus as more research is needed.
Unlock Deck
Unlock for access to all 68 flashcards in this deck.
Unlock Deck
k this deck
46
Humans often build dams on rivers for hydroelectric power or other purposes. Dam-building obstructs fish movement and alters fish populations above and below the dam, sometimes leading to declines in threatened species. One effect is delayed movement of fish to new locations. This increases fish densities in certain locations, resulting in greater competition for space and likelihood of spread of diseases. Fish may be slower in reaching spawning or feeding grounds, and have less energy available for reproduction and for later attempts to reach the new location. What unexpected or unintended ecological consequences would occur in this scenario?
Unlock Deck
Unlock for access to all 68 flashcards in this deck.
Unlock Deck
k this deck
47
A college student is trying to choose a major and is deciding between ecology and environmental science. She enjoys delving into ecological questions, especially ones related to climate change that require detailed and concentrated research in the field and the computer lab. She is also extremely concerned about the impact of humans on world climate, loss of habitat and species, and other ecological problems, but she is often uncomfortable in social or political situations. Given this information, what would you advise this student to major in? Justify your answer.
Unlock Deck
Unlock for access to all 68 flashcards in this deck.
Unlock Deck
k this deck
48
A team of researchers is investigating the effects of fertilizer on the growth of forest trees. They use an old Christmas tree plantation with pine trees of the same species and age, and divide a section of the plantation into 4,000 plots, with each plot measuring 10 cm * 10 cm. They separate the plots into two groups of 2,000 and apply different amounts of fertilizer to the two groups. They collect data on tree growth in each plot for 12 hours and quantify the growth rates with high and low fertilizer applications. Discuss the validity of this design, concentrating on possible spatial and temporal flaws. Based on this experimental design, would the researchers be able to draw valid conclusions about the effect of fertilizer on tree growth rates? Why or why not? Consider the spatial and temporal scales of the design.
Unlock Deck
Unlock for access to all 68 flashcards in this deck.
Unlock Deck
k this deck
49
A rare, highly endangered bird species lives in a very remote area of the Amazonian rainforest. Almost nothing is currently known about this species' diet, behavior, life-span, breeding system, or its interactions with other species. Which ecological level or levels, from organism to biome, would you focus on in a research study? Consider scale when justifying why you would choose this level or levels, and explain why you would not choose the others.
Unlock Deck
Unlock for access to all 68 flashcards in this deck.
Unlock Deck
k this deck
50
A rare, highly endangered bird species lives in a very remote area of the Amazonian rainforest. Almost nothing is currently known about this species' diet, behavior, life-span, breeding system, or its interactions with other species. Ecological research can be conducted at five major levels or scales (note that one has already been entered into the table). Complete the table, listing the four other potential levels of ecological study in order from the lowest to the highest level. For each level, list one potential research question that could be asked in a study of the endangered bird species.
Unlock Deck
Unlock for access to all 68 flashcards in this deck.
Unlock Deck
k this deck
51
Create a table showing a cost and a benefit of conducting research in a lab versus in the field.
Unlock Deck
Unlock for access to all 68 flashcards in this deck.
Unlock Deck
k this deck
52
Would you use an observational, experimental, or modeling approach to study a rare, endangered bird species? Why would the approach you chose be a better choice than the others for your study?
Unlock Deck
Unlock for access to all 68 flashcards in this deck.
Unlock Deck
k this deck
53
A team of researchers is investigating the effects of fertilizer on the growth of forest trees. They use an old Christmas tree plantation with pine trees of the same species and age, and divide a section of the plantation into 60 plots. They separate the plots into two groups of 30. They apply high fertilizer levels to the group to the east of the plantation and low fertilizer levels to the western group. They set up the experiment to run for ten years and measure growth of all trees at the end of each year. Discuss the validity of the experimental design, concentrating on the formation of treatment groups and the use of controls. Based on this design, would the researchers be able to draw valid conclusions about the effect of fertilizer on tree growth rates? Why or why not?
Unlock Deck
Unlock for access to all 68 flashcards in this deck.
Unlock Deck
k this deck
54
A team of researchers investigated the effects of fertilizer on the growth of forest trees. They used an old Christmas tree plantation with pine trees of the same species and age, dividing it into plots and testing growth rates at different levels of fertilization. They calculate averages from their treatment groups, and see that the low-fertilizer group had a higher growth rate than the high-fertilizer group. They conclude that applying a small amount of fertilizer always causes all trees to grow faster than applying a large amount. Is this conclusion valid? Explain.
Unlock Deck
Unlock for access to all 68 flashcards in this deck.
Unlock Deck
k this deck
55
Refer to the figure.
The figure is based on Johnson's experiment on the effects of trematode parasites on tadpoles. According to the figure, how did adding 16 parasites per tadpole to a group of tadpoles affect their survival?
A) It caused a 20% increase.
B) It resulted in no change.
C) It caused a 10% decrease.
D) It caused a 20% decrease.
The figure is based on Johnson's experiment on the effects of trematode parasites on tadpoles. According to the figure, how did adding 16 parasites per tadpole to a group of tadpoles affect their survival?A) It caused a 20% increase.
B) It resulted in no change.
C) It caused a 10% decrease.
D) It caused a 20% decrease.
Unlock Deck
Unlock for access to all 68 flashcards in this deck.
Unlock Deck
k this deck
56
Refer to the figures.
The figures are based on studies of the effects of pesticides on the tadpole immune system. In a laboratory experiment, wood frog (Rana sylvatica) tadpoles were exposed to low or high concentrations of a pesticide, and then to Ribeiroia parasites. The tadpoles were then examined for (A) numbers of eosinophils and (B) numbers of Ribeiroia cysts. Error bars show one SD of the mean. Compared with the control group, the frogs exposed to low concentrations of pesticides had about how many times as many parasite cysts?
A) 1.5
B) 3
C) 4.5
D) 10
The figures are based on studies of the effects of pesticides on the tadpole immune system. In a laboratory experiment, wood frog (Rana sylvatica) tadpoles were exposed to low or high concentrations of a pesticide, and then to Ribeiroia parasites. The tadpoles were then examined for (A) numbers of eosinophils and (B) numbers of Ribeiroia cysts. Error bars show one SD of the mean. Compared with the control group, the frogs exposed to low concentrations of pesticides had about how many times as many parasite cysts?A) 1.5
B) 3
C) 4.5
D) 10
Unlock Deck
Unlock for access to all 68 flashcards in this deck.
Unlock Deck
k this deck
57
How do connections in nature lead to unanticipated side effects in the case of amphibian deformities?
A) Increased pollution levels decrease predation, which allows even deformed frogs to survive and reproduce.
B) Increased nutrients in ponds stimulate algal growth and provide the snails with a more abundant food source, which also increases the number of Ribeiroia.
C) The increased pollution kills off the frogs' prey and makes it more difficult for them to survive.
D) Higher levels of pesticides increase the number of eosinophils in frogs.
Unlock Deck
Unlock for access to all 68 flashcards in this deck.
Unlock Deck
k this deck
58
A scientist monitors both the pollution entering a city's water supply and the changing populations of fish and other organisms thought to be affected by this pollution. He also speaks regularly at city council meetings, giving the results of his studies, and suggests changes in local laws that could help control the pollution. Based on his activities, this person could best be described as
A) an ecologist.
B) an environmental scientist.
C) a politician.
D) an activist.
A) an ecologist.
B) an environmental scientist.
C) a politician.
D) an activist.
Unlock Deck
Unlock for access to all 68 flashcards in this deck.
Unlock Deck
k this deck
59
Many species live in the Quabbin Reservoir in Massachusetts, and these different species interact to varying degrees. This is an example of a(n)
A) biosphere.
B) community.
C) ecosystem.
D) population.
A) biosphere.
B) community.
C) ecosystem.
D) population.
Unlock Deck
Unlock for access to all 68 flashcards in this deck.
Unlock Deck
k this deck
60
One ecologist is studying the genetic changes in a fish species in Africa over several decades, monitoring several populations of the species in different lakes. A second ecologist is studying changes in the same fish species throughout history, relying not only on present-day data, but on information from fossils, preserved specimens, and DNA changes over time. Both scientists are interested in how this species fits into its environment and how it's changed as its environment has changed. What is the difference in the approach of these two scientists?
A) Both are studying fish evolution, but they are using different temporal scales.
B) Both are studying fish evolution, but they are using different spatial scales.
C) The first scientist is studying ecology; the second is studying evolution.
D) The first scientist is studying evolution; the second is studying ecology.
Unlock Deck
Unlock for access to all 68 flashcards in this deck.
Unlock Deck
k this deck
61
Which statement is not correct in regards to the basic tenets of ecology?
A) At some point, every population will experience checks on its growth and resource use.
B) Whatever affects one organism can affect others as well.
C) Evolution took place in the past, but it is no longer occurring.
D) Ecosystems change over space and time.
A) At some point, every population will experience checks on its growth and resource use.
B) Whatever affects one organism can affect others as well.
C) Evolution took place in the past, but it is no longer occurring.
D) Ecosystems change over space and time.
Unlock Deck
Unlock for access to all 68 flashcards in this deck.
Unlock Deck
k this deck
62
Which of the following is an abiotic feature of the environment?
A) The average minimum temperature at night
B) The number of days during which a predator is actively hunting
C) The prevalence of parasites in an area
D) The density of plants in an area
A) The average minimum temperature at night
B) The number of days during which a predator is actively hunting
C) The prevalence of parasites in an area
D) The density of plants in an area
Unlock Deck
Unlock for access to all 68 flashcards in this deck.
Unlock Deck
k this deck
63
In a desert ecosystem, plants capture 120 units per day of solar energy and they use up to 70 units per day in respiration. Animals consume about 30 units per day of the plants. The NPP of this system is how many units per day?
A) 20
B) 30
C) 50
D) 120
A) 20
B) 30
C) 50
D) 120
Unlock Deck
Unlock for access to all 68 flashcards in this deck.
Unlock Deck
k this deck
64
Refer to the figure.
The figure represents an ecological study done by Carson and Root to study how herbivorous insects affected a plant community. Based on the figure, what type of study were Carson and Root most likely performing?
A) A controlled field experiment
B) An uncontrolled field experiment
C) A laboratory experiment
D) An observational study
The figure represents an ecological study done by Carson and Root to study how herbivorous insects affected a plant community. Based on the figure, what type of study were Carson and Root most likely performing?A) A controlled field experiment
B) An uncontrolled field experiment
C) A laboratory experiment
D) An observational study
Unlock Deck
Unlock for access to all 68 flashcards in this deck.
Unlock Deck
k this deck
65
Refer to the figure.
Vredenburg studied the impact of the introduction of rainbow and brook trout on a species of amphibian, the mountain yellow-legged frog (Rana muscosa). After showing greatly decreased frog populations in lakes with trout, he set up an experiment using three categories of lakes: lakes from which he removed trout, lakes that had never had trout, and lakes that still contained trout. He compared the number of adult frogs per 10 m of shoreline in all groups, as shown in the figure. What is the most likely reason that Vredenburg chose to use a large-scale experimental design such as this, rather than a single lake or laboratory experiments?
A) The larger design allowed Vredenburg the ability to do replications.
B) A smaller study would not adequately answer the experimental question.
C) In a larger study, it is easier to manipulate the various experimental treatments.
D) In a real-world situation such as this, all variables can be more easily controlled.
Vredenburg studied the impact of the introduction of rainbow and brook trout on a species of amphibian, the mountain yellow-legged frog (Rana muscosa). After showing greatly decreased frog populations in lakes with trout, he set up an experiment using three categories of lakes: lakes from which he removed trout, lakes that had never had trout, and lakes that still contained trout. He compared the number of adult frogs per 10 m of shoreline in all groups, as shown in the figure. What is the most likely reason that Vredenburg chose to use a large-scale experimental design such as this, rather than a single lake or laboratory experiments?A) The larger design allowed Vredenburg the ability to do replications.
B) A smaller study would not adequately answer the experimental question.
C) In a larger study, it is easier to manipulate the various experimental treatments.
D) In a real-world situation such as this, all variables can be more easily controlled.
Unlock Deck
Unlock for access to all 68 flashcards in this deck.
Unlock Deck
k this deck
66
Refer to the figure.
The figure is based on Johnson's controlled experiment on the effects of trematode parasites on tadpoles. The groups in the experiment were the groups containing a specific and different number of parasites per tadpole (0, 16, 32, 48). Which of these groups is the control group?
A) 0.
B) 16
C) 32
D) 48
The figure is based on Johnson's controlled experiment on the effects of trematode parasites on tadpoles. The groups in the experiment were the groups containing a specific and different number of parasites per tadpole (0, 16, 32, 48). Which of these groups is the control group?A) 0.
B) 16
C) 32
D) 48
Unlock Deck
Unlock for access to all 68 flashcards in this deck.
Unlock Deck
k this deck
67
Biologists find that tomato plants treated with an insecticide produce 2.2% more tomatoes compared to untreated plants. To assess whether these differences are significant, the biologists would most likely use
A) a control group.
B) statistical analysis.
C) replication.
D) mathematical modeling.
A) a control group.
B) statistical analysis.
C) replication.
D) mathematical modeling.
Unlock Deck
Unlock for access to all 68 flashcards in this deck.
Unlock Deck
k this deck
68
Refer to the figure.
Vredenburg studied the impact of introduction of rainbow and brook trout on a species of amphibian, the mountain yellow-legged frog (Rana muscosa). After showing greatly decreased frog populations in lakes with trout, he set up an experiment using three categories of lakes: lakes from which he removed trout, lakes that had never had trout, and lakes that still contained trout. He compared the number of adult frogs per 10 m of shoreline in all groups, as shown in the figure. In Vredenburg's experimental design, why did he use two control groups?
A) To be doubly sure his results were correct
B) To ensure that he had enough data for statistical analysis
C) To control for unknown factors that might be present in the lakes
D) To control for the effects of two known natural conditions
Vredenburg studied the impact of introduction of rainbow and brook trout on a species of amphibian, the mountain yellow-legged frog (Rana muscosa). After showing greatly decreased frog populations in lakes with trout, he set up an experiment using three categories of lakes: lakes from which he removed trout, lakes that had never had trout, and lakes that still contained trout. He compared the number of adult frogs per 10 m of shoreline in all groups, as shown in the figure. In Vredenburg's experimental design, why did he use two control groups?A) To be doubly sure his results were correct
B) To ensure that he had enough data for statistical analysis
C) To control for unknown factors that might be present in the lakes
D) To control for the effects of two known natural conditions
Unlock Deck
Unlock for access to all 68 flashcards in this deck.
Unlock Deck
k this deck
Unlock Deck
Unlock for access to all 68 flashcards in this deck.


