Deck 7: Inferences About the Difference Between Two Means
Full screen (f)
Question
Question
Question
Question
Question
Question
Question
Question
Question
Question
Question
Question
Question
Question
Question
Question
Question
Question
Question
Question
Question
Question
Question
Question
Question
Question
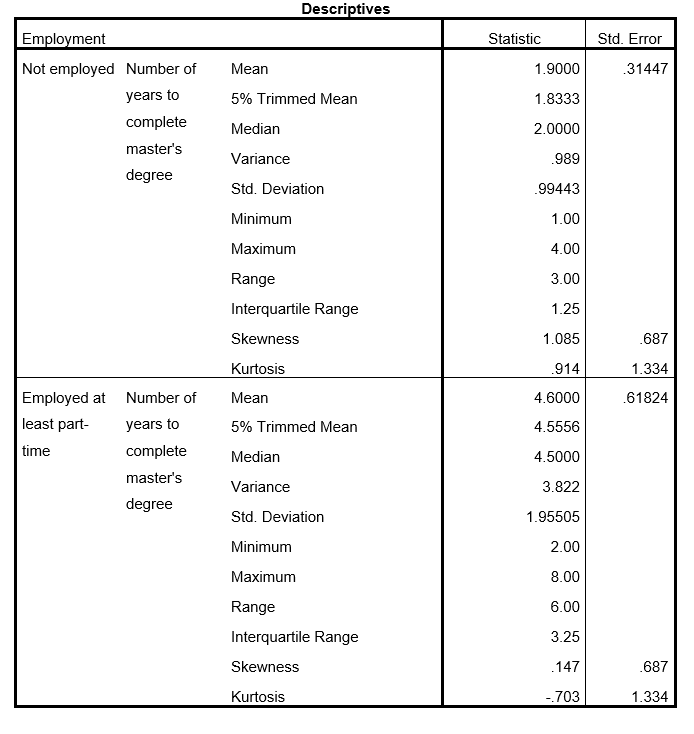
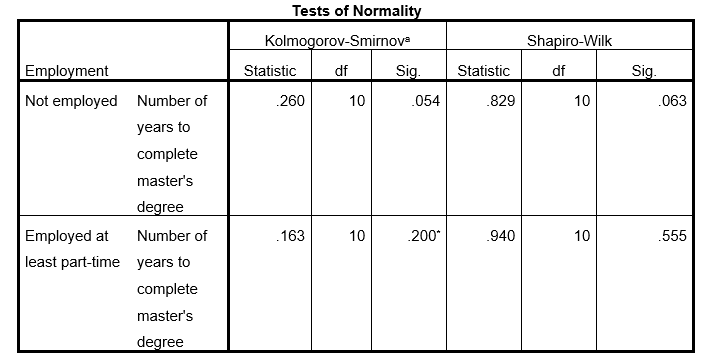
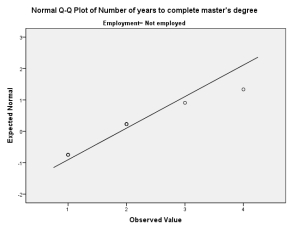
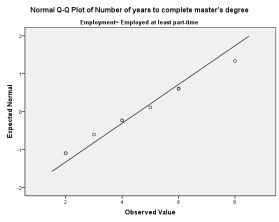
Interpret the following SPSS output in terms of the extent to which the assumption of normality has been met. Include appropriate evidence (e.g., statistical values from the output).
a. Lilliefors Significance Correction
*. This is a lower bound of the true significance.
a. Lilliefors Significance Correction
*. This is a lower bound of the true significance.
Question
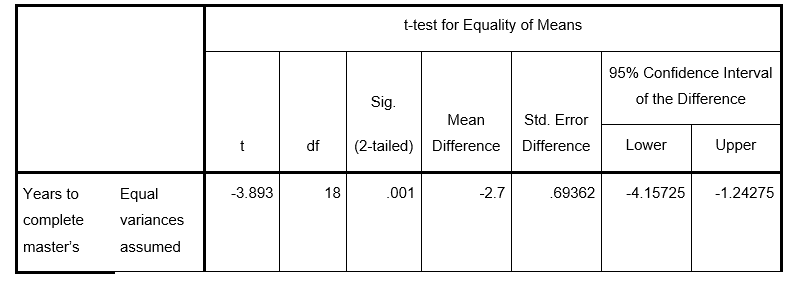
Review the following SPSS output. Interpret the output including identifying the specific statistical procedure that has been used and reporting the extent to which the test is statistically significant. Include appropriate evidence (e.g., values from the output).
Question
Review the following SPSS output. Interpret the output including identifying the specific statistical procedure that has been used and reporting the extent to which the test is statistically significant. Include appropriate evidence (e.g., test statistic value, degrees of freedom, and p value).
Question
Question
Calculate and interpret Cohen's d using the following output.

Unlock Deck
Sign up to unlock the cards in this deck!
Unlock Deck
Unlock Deck
1/30
Play
Full screen (f)
Deck 7: Inferences About the Difference Between Two Means
1
A swim coach designs an experiment to determine if children who participate in group versus individual swim lessons have different swimming skills, on average. She randomly selects 20 children who have registered for swim lessons and randomly assigns them to group or individual swim lessons and collects data on the following: 1) type of swim lesson participated (two categories: group or individual); and 2) swimming skills (measured on a a scale from 0 to 200). Her research question reads: Is there a mean difference in swimming skills for children who participate in individual versus group swimming lessons? Which of the following represents the INDEPENDENT variable?
A) 20 children
B) Random assignment
C) Swimming skills
D) Type of swim lesson
A) 20 children
B) Random assignment
C) Swimming skills
D) Type of swim lesson
D
2
A swim coach designs an experiment to determine if children who participate in group versus individual swim lessons have different swimming skills, on average. She randomly selects 20 children who have registered for swim lessons and randomly assigns them to group or individual swim lessons and collects data on the following: 1) type of swim lesson participated (two categories: group or individual); and 2) swimming skills (measured on a scale from 0 to 200). Her research question reads: Is there a mean difference in swimming skills for children who participate in individual versus group swimming lessons? Which of the following represents the DEPENDENT variable?
A) 20 children
B) Random assignment
C) Swimming skills
D) Type of swim lesson
A) 20 children
B) Random assignment
C) Swimming skills
D) Type of swim lesson
C
3
A professor is examining success of tenure-track faculty in attaining tenure at their postsecondary institution. He surveys tenure-track faculty who have went through the tenure process in the past year and gathers data on two variables: 1) the number of publications in refereed journals (measured in whole numbers); and 2) whether or not they attained tenure (yes or no). The research question is: Is there an average difference in the number of publications based on faculty who attain tenure as compared to faculty who do not attain tenure? Which of the following represents the INDEPENDENT variable?
A) Attainment of tenure
B) Faculty in tenure track programs
C) Number of publications
D) Postsecondary institution
A) Attainment of tenure
B) Faculty in tenure track programs
C) Number of publications
D) Postsecondary institution
A
4
A professor is examining success of tenure-track faculty in attaining tenure at their postsecondary institution. He surveys tenure-track faculty who have went through the tenure process in the past year and gathers data on two variables: 1) the number of publications in refereed journals (measured in whole numbers); and 2) whether or not they attained tenure (yes or no). The research question is: Is there an average difference in the number of publications based on faculty who attain tenure as compared to faculty who do not attain tenure? Which of the following represents the DEPENDENT variable?
A) Attainment of tenure
B) Faculty in tenure track programs
C) Number of publications
D) Postsecondary institution
A) Attainment of tenure
B) Faculty in tenure track programs
C) Number of publications
D) Postsecondary institution
Unlock Deck
Unlock for access to all 30 flashcards in this deck.
Unlock Deck
k this deck
5
A professor is examining success of tenure-track faculty in attaining tenure at their postsecondary institution. He surveys tenure-track faculty who have went through the tenure process in the past year and gathers data on two variables: 1) the number of publications in refereed journals (measured in whole numbers); and 2) whether or not they attained tenure (yes or no). The research question is: Is there an average difference in the number of publications based on faculty who attain tenure as compared to faculty who do not attain tenure? Which one of the following represents how the NULL hypothesis will be written?
A) The number of publications differs, on average for faculty who attain tenure as compared to faculty who do not attain tenure.
B) The average number of publications for faculty who attain tenure is the same as the average number of publications of faculty who do not attain tenure.
C) The average number of publications of faculty who attain tenure is less than or equal to the average number of publications of faculty who do not attain tenure.
D) The average number of publications of faculty who attain tenure is greater than or equal to the average number of publications of faculty who do not attain tenure.
Unlock Deck
Unlock for access to all 30 flashcards in this deck.
Unlock Deck
k this deck
6
A professor is examining success of tenure-track faculty in attaining tenure at their postsecondary institution. He surveys tenure-track faculty who have went through the tenure process in the past year and gathers data on two variables: 1) the number of publications in refereed journals (measured in whole numbers); and 2) whether or not they attained tenure (yes or no). The research question is: Is there an average difference in the number of publications based on faculty who attain tenure as compared to faculty who do not attain tenure? Which one of the following represents how the ALTERNATIVE hypothesis will be written?
A) The number of publications differs, on average for faculty who attain tenure as compared to faculty who do not attain tenure.
B) The average number of publications for faculty who attain tenure is the same as the average number of publications of faculty who do not attain tenure.
C) The average number of publications of faculty who attain tenure is less than or equal to the average number of publications of faculty who do not attain tenure.
D) The average number of publications of faculty who attain tenure is greater than or equal to the average number of publications of faculty who do not attain tenure.
Unlock Deck
Unlock for access to all 30 flashcards in this deck.
Unlock Deck
k this deck
7
In which one of the following is evidence of normality suggested?
A) Alpha level = .05; Levene's test p value = .80
B) Curvilinear Q-Q plot
C) Histogram where each value on the X axis has the same frequency
D) Shapiro Wilk's p value = .08; level of significance = .01
A) Alpha level = .05; Levene's test p value = .80
B) Curvilinear Q-Q plot
C) Histogram where each value on the X axis has the same frequency
D) Shapiro Wilk's p value = .08; level of significance = .01
Unlock Deck
Unlock for access to all 30 flashcards in this deck.
Unlock Deck
k this deck
8
A recent article you read indicates that the p value for Levene's test for homogeneity of variances was .19. Which of the following is a correct interpretation based on this information?
A) The assumption of the test of normality is met.
B) The results of the independent t test are not statistically significant.
C) The variances of the groups are not statistically significantly different.
D) There is a small effect present.
A) The assumption of the test of normality is met.
B) The results of the independent t test are not statistically significant.
C) The variances of the groups are not statistically significantly different.
D) There is a small effect present.
Unlock Deck
Unlock for access to all 30 flashcards in this deck.
Unlock Deck
k this deck
9
In examining the distribution of a ratio level measurement scale variable, Wesley finds that the skewness of the distribution is -2.96 and the kurtosis is +1.72. He also finds that the p value for the Shapiro Wilks test for the variable is .03. Which of the following is suggested?
A) There is evidence that the assumption of homogeneity of variance has been met.
B) There is evidence that the assumption of homogeneity of variance has been violated.
C) There is evidence that the assumption of normality has been met.
D) There is evidence that the assumption of normality has been violated.
Unlock Deck
Unlock for access to all 30 flashcards in this deck.
Unlock Deck
k this deck
10
You read the following in a published research study: 1) Shapiro Wilk's p value of .05; 2) alpha level of .001; 3) eta squared of .25; 4) Levene's test p value of .005. Which of the following statements is correct?
A) The alpha level is rejected.
B) The assumption of equal variances has been met.
C) The assumption of homogeneity of variance has been violated.
D) There is a large effect size.
A) The alpha level is rejected.
B) The assumption of equal variances has been met.
C) The assumption of homogeneity of variance has been violated.
D) There is a large effect size.
Unlock Deck
Unlock for access to all 30 flashcards in this deck.
Unlock Deck
k this deck
11
You read the following in a published research study: 1) test statistic value of 2.56; 2) alpha level of .10; 3) phi coefficient of .75; 4) Shapiro-Wilk's p value of .05. Which of the following statements is correct?
A) The alpha level is rejected.
B) The assumption of equal variances has been met.
C) The assumption of homogeneity of variance has been violated.
D) There is a large effect size.
A) The alpha level is rejected.
B) The assumption of equal variances has been met.
C) The assumption of homogeneity of variance has been violated.
D) There is a large effect size.
Unlock Deck
Unlock for access to all 30 flashcards in this deck.
Unlock Deck
k this deck
12
In which one of the following is evidence of normality suggested?
A) Quadratic distributional shape
B) Shapiro Wilk's p value = .09; level of significance = .10
C) Skewness statistic = 1.65 and kurtosis statistic = 1.90
D) Test statistic value of 1.79; alpha level of .05
A) Quadratic distributional shape
B) Shapiro Wilk's p value = .09; level of significance = .10
C) Skewness statistic = 1.65 and kurtosis statistic = 1.90
D) Test statistic value of 1.79; alpha level of .05
Unlock Deck
Unlock for access to all 30 flashcards in this deck.
Unlock Deck
k this deck
13
A researcher draws a random sample of 500 participants for a study with the intent to perform a dependent t test for a directional hypothesis. He reviews the normality indices and finds slight non-normality. What is the most appropriate recommendation for the researcher?
A) Abort and find a different procedure. The t test is not robust to violations of normality.
B) Proceed with the t test. The t test is robust to violations of normality.
C) Suggest a different sample be selected and start over.
A) Abort and find a different procedure. The t test is not robust to violations of normality.
B) Proceed with the t test. The t test is robust to violations of normality.
C) Suggest a different sample be selected and start over.
Unlock Deck
Unlock for access to all 30 flashcards in this deck.
Unlock Deck
k this deck
14
In conducting an independent t test, a researcher finds a p value of .356 for Levene's test of homogeneity of variance. Has the homogeneity assumption been violated?
Unlock Deck
Unlock for access to all 30 flashcards in this deck.
Unlock Deck
k this deck
15
A researcher conducts an independent t test. She computes eta squared and finds the value to be .16. What interpretation can be made from this?
A) This is a small effect. Approximately 16% of the variation in the dependent variable can be accounted for by the independent variable.
B) This is a small effect. Approximately 16% of the variation in the independent variable can be accounted for by the dependent variable.
C) This is a moderate effect. Approximately 16% of the variation in the dependent variable can be accounted for by the independent variable.
D) This is a moderate effect. Approximately 16% of the variation in the independent variable can be accounted for by the dependent variable.
E) This is a large effect. Approximately 16% of the variation in the dependent variable can be accounted for by the independent variable. f. This is a large effect. Approximately 16% of the variation in the independent variable can be accounted for by the dependent variable.
Unlock Deck
Unlock for access to all 30 flashcards in this deck.
Unlock Deck
k this deck
16
Malani is examining the following research question: Is there a mean difference in the weight of garbage thrown away per week by homeowners as compared to renters? Use the 'Garbage' dataset. "Weight" is a ratio level measurement scale variable. "Own_Rent" is a nominal level measurement scale variable. Conduct the the appropriate inferential statistical procedure at an alpha level of .05. Do NOT exclude any cases when conducting the test. Which one of the following is correct based on reviewing the assumptions?
A) The assumption of homogeneity of varianes is met at alpha of .05.
B) The assumption of homogeneity of variances is NOT met at alpha of .05.
C) The assumption of linearity is met.
D) The assumption of linearity is NOT met.
A) The assumption of homogeneity of varianes is met at alpha of .05.
B) The assumption of homogeneity of variances is NOT met at alpha of .05.
C) The assumption of linearity is met.
D) The assumption of linearity is NOT met.
Unlock Deck
Unlock for access to all 30 flashcards in this deck.
Unlock Deck
k this deck
17
Malani is examining the following research question: Is there a mean difference in the weight of garbage thrown away per week by homeowners as compared to renters? Use the 'Garbage' dataset. "Weight" is a ratio level measurement scale variable. "Own_Rent" is a nominal level measurement scale variable. Conduct the the appropriate inferential statistical procedure at an alpha level of .05. Do NOT exclude any cases when conducting the test. Which one of the following is correct based on reviewing the assumptions?
A) Skewness and kurtosis statistics provide some evidence to suggest that homogeneity of variance is a reasonable assumption.
B) Skewness and kurtosis statistics provide some evidence to suggest that homogeneity of variance is NOT a reasonable assumption.
C) Skewness and kurtosis statistics provide some evidence to suggest that independence is a reasonable assumption.
D) Skewness and kurtosis statistics provide some evidence to suggest that independence is NOT a reasonable assumption.
E) Skewness and kurtosis statistics provide some evidence to suggest that normality is a reasonable assumption. f. Skewness and kurtosis statistics provide some evidence to suggest that normality is NOT a reasonable assumption.
Unlock Deck
Unlock for access to all 30 flashcards in this deck.
Unlock Deck
k this deck
18
Malani is examining the following research question: Is there a mean difference in the weight of garbage thrown away per week by homeowners as compared to renters? Use the 'Garbage' dataset. "Weight" is a ratio level measurement scale variable. "Own_Rent" is a nominal level measurement scale variable. Conduct the the appropriate inferential statistical procedure at an alpha level of .05. Do NOT exclude any cases when conducting the test. Which one of the following is correct based on reviewing the results of the test?
A) The probability the means are not equal is about 30%.
B) There is a good probability that renters throw out more garbage than homeowners.
C) There is about a 30% probability of finding a mean difference of about 16 or greater by chance if the true mean difference is zero.
D) There is less than a 1% probability of finding a mean difference of about 16 or greater by chance if the true mean difference is zero.
Unlock Deck
Unlock for access to all 30 flashcards in this deck.
Unlock Deck
k this deck
19
Malani is examining the following research question: Is there a mean difference in the weight of garbage thrown away per week by homeowners as compared to renters? Use the 'Garbage' dataset. "Weight" is a ratio level measurement scale variable. "Own_Rent" is a nominal level measurement scale variable. Conduct the the appropriate inferential statistical procedure at an alpha level of .05. Do NOT exclude any cases when conducting the test. Which one of the following is correct based on reviewing eta squared calculated from the data?
A) Eta squared indicates that close to 24% of the variation in whether the person owns or rents their home can be attributed to the weight of garbage disposed.
B) Eta squared indicates that close to 24% of the variation in the weight of garbage disposed can be attributed to whether the person owns or rents their home.
C) Eta squared indicates that there are about 2.5 standard deviation units between homeowners and renters.
D) Eta squared indicates that the effect size is generally a small effect.
Unlock Deck
Unlock for access to all 30 flashcards in this deck.
Unlock Deck
k this deck
20
A researcher collects data on shyness for two groups: 1) high school students who have their own cell phone; and 2) high school students who do NOT have a cell phone. Shyness is measured by the Shyness Inventory (an interval scaled variable). For group one (students who have their own cell phone), the following values are measured from the Shyness Inventory: 89, 95, 72, 68, 91, 86. For group two (students who do NOT have their own cell phone), the following values are measured from the Shyness Inventory: 56, 78, 61, 43, 80, 50. Conduct the appropriate statistical procedure at alpha of .05 to determine if there is a difference, on average, of the shyness of students who have versus do not have a cell phone. Is the assumption of homogeneity of variances met?
Unlock Deck
Unlock for access to all 30 flashcards in this deck.
Unlock Deck
k this deck
21
A researcher collects data on shyness for two groups: 1) high school students who have their own cell phone; and 2) high school students who do NOT have a cell phone. Shyness is measured by the Shyness Inventory (an interval scaled variable). For group one (students who have their own cell phone), the following values are measured from the Shyness Inventory: 89, 95, 72, 68, 91, 86. For group two (students who do NOT have their own cell phone), the following values are measured from the Shyness Inventory: 56, 78, 61, 43, 80, 50. Conduct the appropriate statistical procedure at alpha of .05 to determine if there is a difference, on average, of the shyness of students who have versus do not have a cell phone. What is the t test statistic value?
A) .544
B) 2.571
C) +/-2.776
D) -2.927
A) .544
B) 2.571
C) +/-2.776
D) -2.927
Unlock Deck
Unlock for access to all 30 flashcards in this deck.
Unlock Deck
k this deck
22
A researcher collects data on shyness for two groups: 1) high school students who have their own cell phone; and 2) high school students who do NOT have a cell phone. Shyness is measured by the Shyness Inventory (an interval scaled variable). For group one (students who have their own cell phone), the following values are measured from the Shyness Inventory: 89, 95, 72, 68, 91, 86. For group two (students who do NOT have their own cell phone), the following values are measured from the Shyness Inventory: 56, 78, 61, 43, 80, 50. Conduct the appropriate statistical procedure at alpha of .05 to determine if there is a difference, on average, of the shyness of students who have versus do not have a cell phone. What is the p value?
A) .015
B) .05
C) .478
D) .544
A) .015
B) .05
C) .478
D) .544
Unlock Deck
Unlock for access to all 30 flashcards in this deck.
Unlock Deck
k this deck
23
A researcher collects information on students enrolled in a statistics course to determine if their level of anxiety changes from the time they begin the course to the time they end the course. Lower scores on the instrument reflect decreased anxiety toward statistics. The pretest and posttest scores for the students were: 88, 94, 91, 84, 80, 76, 96, 90, 83, 95. The posttest scores were: 56, 64, 72, 80, 42, 40, 51, 32, 61, 59. (The data are in respective order. For example, for student A the pretest score was 88 and posttest score was 56; for student B the pretest score was 94 and posttest score was 64, and so forth.) Conduct the appropriate statistical procedure at alpha of .05 to determine if there is a difference in statistics anxiety, on average, prior to and after completion of a statistics course. What is the t test statistic value?
A) 2.201
B) +/-2.262
C) 6.840
D) 14.795
A) 2.201
B) +/-2.262
C) 6.840
D) 14.795
Unlock Deck
Unlock for access to all 30 flashcards in this deck.
Unlock Deck
k this deck
24
A researcher collects information on students enrolled in a statistics course to determine if their level of anxiety changes from the time they begin the course to the time they end the course. Lower scores on the instrument reflect decreased anxiety toward statistics. The pretest scores for the students were: 88, 94, 91, 84, 80, 76, 96, 90, 83, 95. The posttest scores were: 56, 64, 72, 80, 42, 40, 51, 32, 61, 59. (The data are in respective order. For example, for student A the pretest score was 88 and posttest score was 56; for student B the pretest score was 94 and posttest score was 64, and so forth.) Conduct the appropriate statistical procedure at alpha of .05 to determine if there is a difference in statistics anxiety, on average, prior to and after completion of a statistics course. Is there a statistically significant difference between the pretest and posttest means?
A) Yes at p < .001
B) Yes at p = .01
C) Yes at p = .023
D) Yes at p = .05
A) Yes at p < .001
B) Yes at p = .01
C) Yes at p = .023
D) Yes at p = .05
Unlock Deck
Unlock for access to all 30 flashcards in this deck.
Unlock Deck
k this deck
25
A researcher collects information on students enrolled in a statistics course to determine if their level of anxiety changes from the time they begin the course to the time they end the course. Lower scores on the instrument reflect decreased anxiety toward statistics. The pretest and posttest scores for the students were: 88, 94, 91, 84, 80, 76, 96, 90, 83, 95. The posttest scores were: 56, 64, 72, 80, 42, 40, 51, 32, 61, 59. (The data are in respective order. For example, for student A the pretest score was 88 and posttest score was 56; for student B the pretest score was 94 and posttest score was 64, and so forth.) Conduct the appropriate statistical procedure at alpha of .05 to determine if there is a difference in statistics anxiety, on average, prior to and after completion of a statistics course. What is the confidence interval of the mean difference?
A) 4.68 to 14.79
B) 21.42 to 42.58
C) 53.42 to 74.58
D) 55.70 to 87.70
A) 4.68 to 14.79
B) 21.42 to 42.58
C) 53.42 to 74.58
D) 55.70 to 87.70
Unlock Deck
Unlock for access to all 30 flashcards in this deck.
Unlock Deck
k this deck
26
Interpret the following SPSS output in terms of the extent to which the assumption of normality has been met. Include appropriate evidence (e.g., statistical values from the output).
a. Lilliefors Significance Correction
*. This is a lower bound of the true significance.
a. Lilliefors Significance Correction
*. This is a lower bound of the true significance.
Unlock Deck
Unlock for access to all 30 flashcards in this deck.
Unlock Deck
k this deck
27
Review the following SPSS output. Interpret the output including identifying the specific statistical procedure that has been used and reporting the extent to which the test is statistically significant. Include appropriate evidence (e.g., values from the output).
Unlock Deck
Unlock for access to all 30 flashcards in this deck.
Unlock Deck
k this deck
28
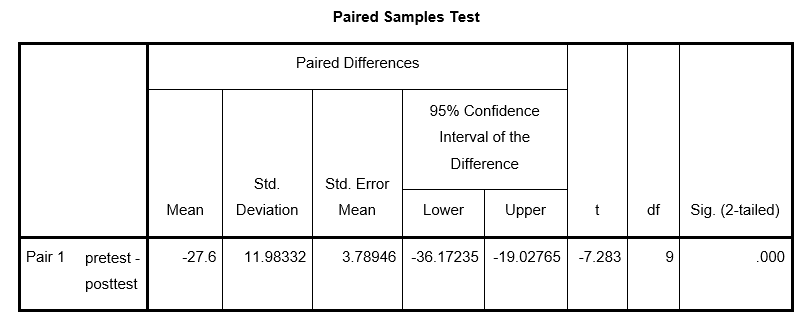
Review the following SPSS output. Interpret the output including identifying the specific statistical procedure that has been used and reporting the extent to which the test is statistically significant. Include appropriate evidence (e.g., test statistic value, degrees of freedom, and p value).
Unlock Deck
Unlock for access to all 30 flashcards in this deck.
Unlock Deck
k this deck
29
A research report indicates that the mean birth weight of twins that participated in their study was 5.5 pounds (variance = .25; n =15) and the mean birth weight of singleton babies was 7.7 pounds (variance = .40; n = 15). Calculate and interpret Cohen's d effect size.
Unlock Deck
Unlock for access to all 30 flashcards in this deck.
Unlock Deck
k this deck
30
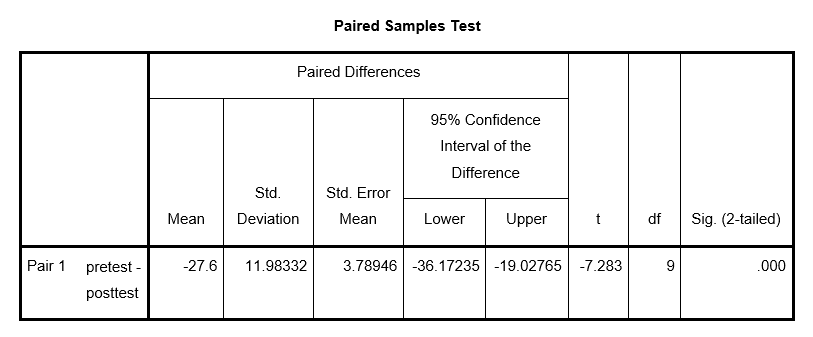
Calculate and interpret Cohen's d using the following output.
Unlock Deck
Unlock for access to all 30 flashcards in this deck.
Unlock Deck
k this deck
Unlock Deck
Unlock for access to all 30 flashcards in this deck.


