Deck 4: Bivariate Description: Crosstabulation, Risk Indexes, and Correlation
Full screen (f)
Question
Question
Question
Question
Question
Question
Question
Question
Question
Question
Question
Question
Question
Question
Question
Question
Question
Question
Question
Question
Question
Questions pertain to the following table (Table 4):
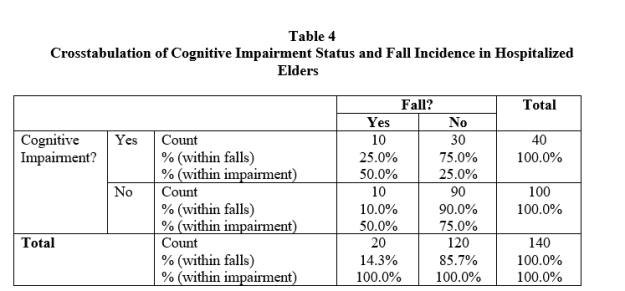
-Refer to Table 4. What percentage of elders in this sample had a fall?
A) 14.3%
B) 20.0%
C) 25.0%
D) 85.7%
-Refer to Table 4. What percentage of elders in this sample had a fall?
A) 14.3%
B) 20.0%
C) 25.0%
D) 85.7%
Question
Questions pertain to the following table (Table 4):
-Refer to Table 4. What numbers are in the denominator for calculating row percentages?
A) 20, 120, 140
B) 10, 10, 20
C) 40, 100, 140
D) 30, 90, 120
-Refer to Table 4. What numbers are in the denominator for calculating row percentages?
A) 20, 120, 140
B) 10, 10, 20
C) 40, 100, 140
D) 30, 90, 120
Question
Questions pertain to the following table (Table 4):
-Refer to Table 4. What percentage of people who fell were not cognitively impaired?
A) 0.0%
B) 10.0%
C) 14.3%
D) 50.0%
-Refer to Table 4. What percentage of people who fell were not cognitively impaired?
A) 0.0%
B) 10.0%
C) 14.3%
D) 50.0%
Question
Questions pertain to the following table (Table 4):
-Refer to Table 4. What was the absolute risk of falling for elders who were cognitively compared?
A) .100
B) .143
C) .250
D) .500
-Refer to Table 4. What was the absolute risk of falling for elders who were cognitively compared?
A) .100
B) .143
C) .250
D) .500
Question
Questions pertain to the following table (Table 4):
-Refer to Table 4. In this example, what is the value of ARR?
A) .100
B) .150
C) .250
D) .500
-Refer to Table 4. In this example, what is the value of ARR?
A) .100
B) .150
C) .250
D) .500

Unlock Deck
Sign up to unlock the cards in this deck!
Unlock Deck
Unlock Deck
1/25
Play
Full screen (f)
Deck 4: Bivariate Description: Crosstabulation, Risk Indexes, and Correlation
1
Another name for a crosstab table is a:
A) Scatterplot
B) Frequency distribution
C) Contingency table
D) Relative risk table
A) Scatterplot
B) Frequency distribution
C) Contingency table
D) Relative risk table
C
2
In a 4 % 3 crosstab table, how many variables would there be?
A) 2
B) 4
C) 7
D) 12
A) 2
B) 4
C) 7
D) 12
A
3
In a 4 % 3 crosstab table, how many cells would there be?
A) 2
B) 4
C) 7
D) 12
A) 2
B) 4
C) 7
D) 12
D
4
Which measurement scale(s) are most amenable to crosstabulation?
A) Nominal only
B) Nominal and ordinal
C) Nominal, ordinal, and interval
D) Nominal, ordinal, interval, and ratio
A) Nominal only
B) Nominal and ordinal
C) Nominal, ordinal, and interval
D) Nominal, ordinal, interval, and ratio
Unlock Deck
Unlock for access to all 25 flashcards in this deck.
Unlock Deck
k this deck
5
A concept often used in connection with the calculation of all risk indexes is:
A) EBP
B) Crosstabulation
C) Exposure to risk
D) Odds
A) EBP
B) Crosstabulation
C) Exposure to risk
D) Odds
Unlock Deck
Unlock for access to all 25 flashcards in this deck.
Unlock Deck
k this deck
6
The two approaches to expressing amount of risk involve:
A) Exposure and nonexposure
B) Risk and risk reduction
C) Odds and odds ratios
D) Absolute risk and relative risk
A) Exposure and nonexposure
B) Risk and risk reduction
C) Odds and odds ratios
D) Absolute risk and relative risk
Unlock Deck
Unlock for access to all 25 flashcards in this deck.
Unlock Deck
k this deck
7
A widely reported and intuitively appealing risk index for comparing risk outcomes is:
A) Relative risk (RR)
B) Absolute risk (AR)
C) Odds ratio (OR)
D) Number needed to treat (NNT)
A) Relative risk (RR)
B) Absolute risk (AR)
C) Odds ratio (OR)
D) Number needed to treat (NNT)
Unlock Deck
Unlock for access to all 25 flashcards in this deck.
Unlock Deck
k this deck
8
The value of the RR is close to the value of the OR when:
A) A retrospective case-control design was used
B) Absolute risk reduction is modest
C) Sample size is large
D) Sample size is small
A) A retrospective case-control design was used
B) Absolute risk reduction is modest
C) Sample size is large
D) Sample size is small
Unlock Deck
Unlock for access to all 25 flashcards in this deck.
Unlock Deck
k this deck
9
Risk indexes such as ARR, RR, OR, and NNT are not appropriate when:
A) The study involves testing the effects of an intervention
B) A prospective (cohort) design comparing risk groups is used
C) The independent and/or dependent variable is not dichotomous
D) The outcome is a nominal-level variable
A) The study involves testing the effects of an intervention
B) A prospective (cohort) design comparing risk groups is used
C) The independent and/or dependent variable is not dichotomous
D) The outcome is a nominal-level variable
Unlock Deck
Unlock for access to all 25 flashcards in this deck.
Unlock Deck
k this deck
10
The risk index that corresponds to a cell percentage in a crosstab table is:
A) AR
B) ARR
C) RR
D) RRR
A) AR
B) ARR
C) RR
D) RRR
Unlock Deck
Unlock for access to all 25 flashcards in this deck.
Unlock Deck
k this deck
11
When the value of RR is close to 1.0, this means that:
A) The OR and the RR are far apart in value
B) Absolute risk is low
C) Exposure to the risk factor had a large effect on the outcome
D) Exposure versus nonexposure to the risk factor is unrelated to the outcome
A) The OR and the RR are far apart in value
B) Absolute risk is low
C) Exposure to the risk factor had a large effect on the outcome
D) Exposure versus nonexposure to the risk factor is unrelated to the outcome
Unlock Deck
Unlock for access to all 25 flashcards in this deck.
Unlock Deck
k this deck
12
Pearson's r is an index that communicates:
A) Relative risk
B) Relative risk reduction
C) Correlation between two variables
D) None of the above
A) Relative risk
B) Relative risk reduction
C) Correlation between two variables
D) None of the above
Unlock Deck
Unlock for access to all 25 flashcards in this deck.
Unlock Deck
k this deck
13
If a scatterplot has data points that are tightly packed along a diagonal that slopes from the upper left to the lower right of the graph, the correlation between variables is:
A) Strongly positive
B) Weakly positive
C) Strongly negative
D) Weakly negative
A) Strongly positive
B) Weakly positive
C) Strongly negative
D) Weakly negative
Unlock Deck
Unlock for access to all 25 flashcards in this deck.
Unlock Deck
k this deck
14
Product-moment correlation coefficients are used to communicate information about:
A) Risks
B) Intervention effects
C) The magnitude and direction of curvilinear relationships
D) The magnitude and direction of linear relationships
A) Risks
B) Intervention effects
C) The magnitude and direction of curvilinear relationships
D) The magnitude and direction of linear relationships
Unlock Deck
Unlock for access to all 25 flashcards in this deck.
Unlock Deck
k this deck
15
Which of the following coefficients indicates the strongest relationship?
A) .77
B) -.89
C) .00
D) .50
A) .77
B) -.89
C) .00
D) .50
Unlock Deck
Unlock for access to all 25 flashcards in this deck.
Unlock Deck
k this deck
16
If the value of r between X and Y is .90, what percentage of the variance in Y is explained by X?
A) 0%
B) 45%
C) 81%
D) .90%
A) 0%
B) 45%
C) 81%
D) .90%
Unlock Deck
Unlock for access to all 25 flashcards in this deck.
Unlock Deck
k this deck
17
For which of the following pairs of variables would it make sense to compute a product-moment correlation coefficient?
A) Height and weight
B) Race/ethnicity and height
C) Race/ethnicity and marital status
D) Marital status and weight
A) Height and weight
B) Race/ethnicity and height
C) Race/ethnicity and marital status
D) Marital status and weight
Unlock Deck
Unlock for access to all 25 flashcards in this deck.
Unlock Deck
k this deck
18
A researcher found a correlation of -.24 between scores on a self-esteem scale and number of alcoholic drinks consumed in the prior month. What does this mean?
A) People who drank more alcohol had a slight tendency to have higher self-esteem.
B) People who drank more alcohol had a slight tendency to have lower self-esteem.
C) Drinking more alcohol tended to cause lower self-esteem.
D) Having lower self-esteem tended to cause people to drink more alcohol.
A) People who drank more alcohol had a slight tendency to have higher self-esteem.
B) People who drank more alcohol had a slight tendency to have lower self-esteem.
C) Drinking more alcohol tended to cause lower self-esteem.
D) Having lower self-esteem tended to cause people to drink more alcohol.
Unlock Deck
Unlock for access to all 25 flashcards in this deck.
Unlock Deck
k this deck
19
How many variables are in a correlation matrix with four rows and four columns?
A) 4
B) 8
C) 16
D) It cannot be determined.
A) 4
B) 8
C) 16
D) It cannot be determined.
Unlock Deck
Unlock for access to all 25 flashcards in this deck.
Unlock Deck
k this deck
20
Which of the following values is likely to appear on the diagonal of a correlation matrix?
A) -1.00
B) .00
C) .10
D) 1.00
A) -1.00
B) .00
C) .10
D) 1.00
Unlock Deck
Unlock for access to all 25 flashcards in this deck.
Unlock Deck
k this deck
21
Questions pertain to the following table (Table 4):
-Refer to Table 4. What percentage of elders in this sample had a fall?
A) 14.3%
B) 20.0%
C) 25.0%
D) 85.7%
-Refer to Table 4. What percentage of elders in this sample had a fall?
A) 14.3%
B) 20.0%
C) 25.0%
D) 85.7%
Unlock Deck
Unlock for access to all 25 flashcards in this deck.
Unlock Deck
k this deck
22
Questions pertain to the following table (Table 4):
-Refer to Table 4. What numbers are in the denominator for calculating row percentages?
A) 20, 120, 140
B) 10, 10, 20
C) 40, 100, 140
D) 30, 90, 120
-Refer to Table 4. What numbers are in the denominator for calculating row percentages?
A) 20, 120, 140
B) 10, 10, 20
C) 40, 100, 140
D) 30, 90, 120
Unlock Deck
Unlock for access to all 25 flashcards in this deck.
Unlock Deck
k this deck
23
Questions pertain to the following table (Table 4):
-Refer to Table 4. What percentage of people who fell were not cognitively impaired?
A) 0.0%
B) 10.0%
C) 14.3%
D) 50.0%
-Refer to Table 4. What percentage of people who fell were not cognitively impaired?
A) 0.0%
B) 10.0%
C) 14.3%
D) 50.0%
Unlock Deck
Unlock for access to all 25 flashcards in this deck.
Unlock Deck
k this deck
24
Questions pertain to the following table (Table 4):
-Refer to Table 4. What was the absolute risk of falling for elders who were cognitively compared?
A) .100
B) .143
C) .250
D) .500
-Refer to Table 4. What was the absolute risk of falling for elders who were cognitively compared?
A) .100
B) .143
C) .250
D) .500
Unlock Deck
Unlock for access to all 25 flashcards in this deck.
Unlock Deck
k this deck
25
Questions pertain to the following table (Table 4):
-Refer to Table 4. In this example, what is the value of ARR?
A) .100
B) .150
C) .250
D) .500
-Refer to Table 4. In this example, what is the value of ARR?
A) .100
B) .150
C) .250
D) .500
Unlock Deck
Unlock for access to all 25 flashcards in this deck.
Unlock Deck
k this deck
Unlock Deck
Unlock for access to all 25 flashcards in this deck.


