Deck 9: Its All Relative: Dichotomies As Independent Variables in Regression
Full screen (f)
Question
Question
Question
Question
Question
Question
Question
Question
Question
Question
Question
Question
Question
Question
Question
Question
Question
Question
Question
Question
Question
Question
Question
Question
Question
Question
Question
Question
Question
Question
Question
Question
Question
Here is a box of SPSS output using GSS2008 data, using whites as the reference group:
 Do whites work fewer weeks than those from other racial groups? Explain.
Do whites work fewer weeks than those from other racial groups? Explain. Question
Question

Unlock Deck
Sign up to unlock the cards in this deck!
Unlock Deck
Unlock Deck
1/35
Play
Full screen (f)
Deck 9: Its All Relative: Dichotomies As Independent Variables in Regression
1
Here is a regression equation using GSS2008 data, people aged 21 to 29, where men were coded as 0, and women were coded as 1:
# OF TIMES GO TO BAR PER MONTH = 4.00 - 1.73 (SEX)
If women had been coded as 0, and men had been coded as 1, the regression equation would have been:
A) # OF TIMES GO TO BAR PER MONTH = 4.00 - 1.73 (SEX)
B) # OF TIMES GO TO BAR PER MONTH = 2.27 + 1.73 (SEX)
C) # OF TIMES GO TO BAR PER MONTH = 5.73 - 1.73 (SEX)
D) # OF TIMES GO TO BAR PER MONTH = 4.00 - 2.27 (SEX)
B
2
In the GSS, the original race variable was coded as: whites=1, blacks=2, others=3. Which of the following is the best way to recode this variable into a dichotomy?
A) whites=1, non-whites=2
B) non-whites=1, whites=2
C) whites=0, non-whites=1
D) whites=-1, non-whites=+1
A) whites=1, non-whites=2
B) non-whites=1, whites=2
C) whites=0, non-whites=1
D) whites=-1, non-whites=+1
C
3
For which of the following variables would you most likely want to use the reference group technique?
A) Religious denomination (Catholic, Protestant, Jewish, Muslim)
B) Sex (male, female)
C) Income (in dollars)
D) Age (in years)
A) Religious denomination (Catholic, Protestant, Jewish, Muslim)
B) Sex (male, female)
C) Income (in dollars)
D) Age (in years)
A
4
With which of the following variables would you most likely NOT use the reference-grouping technique?
A) a nominal-level variable
B) an ordinal-level variable
C) a ratio-level variable
D) all are equally likely
A) a nominal-level variable
B) an ordinal-level variable
C) a ratio-level variable
D) all are equally likely
Unlock Deck
Unlock for access to all 35 flashcards in this deck.
Unlock Deck
k this deck
5
If we wanted to use the GSS variable HEALTH (self-assessment of health: Excellent, Good, Fair, or Poor) as an independent variable in a regression model, how many independent variables would we have to create?
A) None, this variable is perfectly fine as is to use in a regression equation.
B) 2
C) 3
D) 4
A) None, this variable is perfectly fine as is to use in a regression equation.
B) 2
C) 3
D) 4
Unlock Deck
Unlock for access to all 35 flashcards in this deck.
Unlock Deck
k this deck
6
Here is a regression equation using GSS2008 data. The independent variables are two reference group variables, one for blacks and one for others (those not white and not black). Therefore, whites are the reference group. The dependent variable is the number of siblings the respondent has.
SIBLINGS = 3.36 + 1.61 (BLACK) + .87 (OTHER)
If we had run a similar regression, but with a dichotomy for race (white=0, non-white=1), what would the resulting equation likely have looked like?
A) SIBLINGS = 3.36 + 2.48 (RACE)
B) SIBLINGS = 3.36 + 1.34 (RACE)
D) SIBLINGS = 3.36 + .80 (RACE)
D) SIBLINGS = 3.36 + 1.61 (RACE)
Unlock Deck
Unlock for access to all 35 flashcards in this deck.
Unlock Deck
k this deck
7
Here is a regression equation using GSS2008 data. The independent variables are two reference group variables, one for blacks and one for others (those not white and not black). Therefore, whites are the reference group. The dependent variable is the number of siblings the respondent has.
SIBLINGS = 3.36 + 1.61 (BLACK) + .87 (OTHER)
If we had run a similar regression, but with blacks as the reference group, what would the resulting equation likely have looked like?
A) SIBLINGS = 3.36 +1.61 (WHITE) + .87 (OTHER)
B) SIBLINGS = 3.36 + 1.61 (BLACK) + .87 (OTHER)
C) SIBLINGS = 3.45 + 1.52 (BLACK)
D) SIBLINGS = 4.97 - 1.61 (WHITE) - .74 (OTHER)
Unlock Deck
Unlock for access to all 35 flashcards in this deck.
Unlock Deck
k this deck
8
Here is a regression using GSS2008 data. The independent variables are two reference group variables, one for blacks and one for others (those not white and not black). Therefore, whites are the reference group. The dependent variable is the number of times the respondent has been to a zoo in the past year.
ZOOVISITS = 1.05 - .32 (BLACK) + .59 (OTHER)
The exact significance of the slope for the BLACK variable was .081, while the exact significance of the OTHER variable was .008. From this information, what is the best conclusion?
A) With regard to zoo visits, the population of whites and the population of others differ.
B) With regard to zoo visits, the population of whites and the population of others differ; and in addition, the population of whites and the population of blacks differ.
C) With regard to zoo visits, the population of whites and the population of others differ; and in addition, the population of blacks and the population of others differ.
D) With regard to zoo visits, the population of blacks and the population of others differ.
Unlock Deck
Unlock for access to all 35 flashcards in this deck.
Unlock Deck
k this deck
9
Another word for the reference group is:
A) the omitted variable
B) the omitted slope
C) the omitted category
D) the omitted constant
A) the omitted variable
B) the omitted slope
C) the omitted category
D) the omitted constant
Unlock Deck
Unlock for access to all 35 flashcards in this deck.
Unlock Deck
k this deck
10
Here is a box of SPSS output using GSS2008 data (with whites coded as 0 and blacks coded as 1):
Which of the following is a correct statement based on these results?
A) Whites have 1.61 more siblings than blacks do.
B) Blacks have 1.61 more siblings than whites do.
C) Whites have 1.61 times more siblings than blacks do.
D) Blacks have 1.61 times more siblings than whites do.
Which of the following is a correct statement based on these results?
A) Whites have 1.61 more siblings than blacks do.
B) Blacks have 1.61 more siblings than whites do.
C) Whites have 1.61 times more siblings than blacks do.
D) Blacks have 1.61 times more siblings than whites do.
Unlock Deck
Unlock for access to all 35 flashcards in this deck.
Unlock Deck
k this deck
11
Here is a box of SPSS output using GSS 2008 data:
How many times per month does the average woman in the GSS2008 sample go to a bar?
A) -.84
B) 1.87
C) 1.03
D) 0.00
How many times per month does the average woman in the GSS2008 sample go to a bar?
A) -.84
B) 1.87
C) 1.03
D) 0.00
Unlock Deck
Unlock for access to all 35 flashcards in this deck.
Unlock Deck
k this deck
12
A researcher creates a set of four reference-group variables to include in a regression. What can you assume about the variable from which she built these variables?
A) It likely had three categories
B) It likely had four categories
C) It likely had five categories
D) It likely had six categories
A) It likely had three categories
B) It likely had four categories
C) It likely had five categories
D) It likely had six categories
Unlock Deck
Unlock for access to all 35 flashcards in this deck.
Unlock Deck
k this deck
13
Which of the following is the best reason to designate a group as the reference group?
A) We want to be able to compare all of the other groups to this group
B) We don't want to include this group in our analyses
C) This group is the largest of the groups we are comparing
D) This group is already coded as 0
A) We want to be able to compare all of the other groups to this group
B) We don't want to include this group in our analyses
C) This group is the largest of the groups we are comparing
D) This group is already coded as 0
Unlock Deck
Unlock for access to all 35 flashcards in this deck.
Unlock Deck
k this deck
14
In the scientific knowledge example in the textbook, who had the highest scores on the scientific knowledge quiz?
A) political liberals
B) political moderates
C) political conservatives
D) all of these groups had similar scores
A) political liberals
B) political moderates
C) political conservatives
D) all of these groups had similar scores
Unlock Deck
Unlock for access to all 35 flashcards in this deck.
Unlock Deck
k this deck
15
Here is a box of SPSS output using GSS2008 data:
What is the correct way to write the regression equation?
A) HAPPYINDEX = 2.94 - .30 (BLACK) - .08 (OTHER)
B) HAPPYINDEX = 2.94 - .30 (BLACK)
C) HAPPYINDEX = 2.94 - .01 (BLACK) - .49 (OTHER)
D) HAPPYINDEX = 2.94 (WHITE) - .30 (BLACK) - .08 (OTHER)
What is the correct way to write the regression equation?
A) HAPPYINDEX = 2.94 - .30 (BLACK) - .08 (OTHER)
B) HAPPYINDEX = 2.94 - .30 (BLACK)
C) HAPPYINDEX = 2.94 - .01 (BLACK) - .49 (OTHER)
D) HAPPYINDEX = 2.94 (WHITE) - .30 (BLACK) - .08 (OTHER)
Unlock Deck
Unlock for access to all 35 flashcards in this deck.
Unlock Deck
k this deck
16
A researcher uses a set of reference-group variables in a regression. One variable has a small slope and achieves statistical significance. Another variable has a larger slope but does not achieve statistical significance. What can you surmise from this?
A) The researcher created his variables incorrectly.
B) The r-squared value will be zero.
C) The variable with the large slope is based on a category with a small frequency.
D) the variable with the small slope is based on a category with a small frequency.
A) The researcher created his variables incorrectly.
B) The r-squared value will be zero.
C) The variable with the large slope is based on a category with a small frequency.
D) the variable with the small slope is based on a category with a small frequency.
Unlock Deck
Unlock for access to all 35 flashcards in this deck.
Unlock Deck
k this deck
17
In the "happiness and partnership status" example in the textbook, who was the most happy:
A) married people whose partners were living with them
B) married people whose partners were not living with them
C) people who were not married nor partnered
D) all were equally happy
A) married people whose partners were living with them
B) married people whose partners were not living with them
C) people who were not married nor partnered
D) all were equally happy
Unlock Deck
Unlock for access to all 35 flashcards in this deck.
Unlock Deck
k this deck
18
What dataset did South and Spitze use in their research on housework?
A) The National Survey of Families and Households
B) The Panel Study of Income Dynamics
C) The International Study of Unpaid Labor
D) The Wisconsin Longitudinal Study
A) The National Survey of Families and Households
B) The Panel Study of Income Dynamics
C) The International Study of Unpaid Labor
D) The Wisconsin Longitudinal Study
Unlock Deck
Unlock for access to all 35 flashcards in this deck.
Unlock Deck
k this deck
19
In South and Spitze research on housework, what do they use as their reference group?
A) those who have never been married
B) those who have been married but are now currently single
C) those who are currently married
D) those who are cohabitating but not married
A) those who have never been married
B) those who have been married but are now currently single
C) those who are currently married
D) those who are cohabitating but not married
Unlock Deck
Unlock for access to all 35 flashcards in this deck.
Unlock Deck
k this deck
20
The South and Spitze article uses which types of variables as independent variables?
A) a set of reference-group variables
B) dichotomies
C) ratio-level variables
D) all of the above
A) a set of reference-group variables
B) dichotomies
C) ratio-level variables
D) all of the above
Unlock Deck
Unlock for access to all 35 flashcards in this deck.
Unlock Deck
k this deck
21
You meet a recent widow. According to the South and Spitze findings, you can cheer her up by telling her:
A) Grief usually last less than a year.
B) Widows are happier than married women, on average.
C) Widows do less housework than married women, on average.
D) Widows have more free time than married women, on average.
A) Grief usually last less than a year.
B) Widows are happier than married women, on average.
C) Widows do less housework than married women, on average.
D) Widows have more free time than married women, on average.
Unlock Deck
Unlock for access to all 35 flashcards in this deck.
Unlock Deck
k this deck
22
In their article on judges and their daughters, Glynn and Sen attempted to study:
A) judicial empathy
B) judicial identity
C) judicial responsibility
D) judicial networks
A) judicial empathy
B) judicial identity
C) judicial responsibility
D) judicial networks
Unlock Deck
Unlock for access to all 35 flashcards in this deck.
Unlock Deck
k this deck
23
In their article on judges and their daughters, Glynn and Sen studied:
A) divorce court judges
B) bankruptcy court judges
C) appeals court judges
D) Supreme Court judges
A) divorce court judges
B) bankruptcy court judges
C) appeals court judges
D) Supreme Court judges
Unlock Deck
Unlock for access to all 35 flashcards in this deck.
Unlock Deck
k this deck
24
Which of the following types of variables did Glynn and Sen NOT use in their article on judges and their daughters?
A) dichotomies
B) reference-group variables
C) ratio-level variables
D) they used all of these types of variables
A) dichotomies
B) reference-group variables
C) ratio-level variables
D) they used all of these types of variables
Unlock Deck
Unlock for access to all 35 flashcards in this deck.
Unlock Deck
k this deck
25
According to Glenn and Sen's results, having at least one daughter increased a judge's proportion of cases she voted in a feminist direction by:
A) 1%
B) 7%
C) 25%
D) 50%
A) 1%
B) 7%
C) 25%
D) 50%
Unlock Deck
Unlock for access to all 35 flashcards in this deck.
Unlock Deck
k this deck
26
If you have a dichotomous variable that is coded 1 and 2, explain why it is a good idea to recode this variable so that it is coded 0 and 1.
Unlock Deck
Unlock for access to all 35 flashcards in this deck.
Unlock Deck
k this deck
27
Explain how one could use religiosity in a regression equation using a ratio-level variable, using a dichotomy, and using the reference group technique.
Unlock Deck
Unlock for access to all 35 flashcards in this deck.
Unlock Deck
k this deck
28
We use 2006GSS data to analyze the effect of children on a fulltime working mother's hours to relax per day (only women under 40 years old). Here are two equations (all slopes are statistically significant). The first equation uses a ratio-level variable (# of children); the second equation uses a set of reference group variables where "0 children" is the reference group:
HRSRELAX=3.70-.52(# OF CHILDREN)
HRSRELAX=3.90-1.17(1CHILD)-1.44(2CHILDREN)-1.70(3CHILDREN)-1.62(4ORMORECHILDREN)
Using each equation, predict hours to relax for 3 different women:
a woman with no children
a woman with one child
a woman with five children
Then, explain the difference between what the ratio-level version tells you about the effect of children in contrast to what the reference-group version tells you about the effect of children.
Unlock Deck
Unlock for access to all 35 flashcards in this deck.
Unlock Deck
k this deck
29
The original SEX variable in the GSS is coded 1=Male, 2=Female. Explain why it is a good idea, if we want to use the SEX variable in a regression equation, to recode the variable so that one group is coded as 0 and the other group is coded as 1. In your explanation, use income as the dependent variable.
Unlock Deck
Unlock for access to all 35 flashcards in this deck.
Unlock Deck
k this deck
30
A researcher wants to use a nominal-level variable as an independent variable in a regression equation. It measures the type of school a child attends, and it has three categories: public school, private school, and homeschooled. The researcher creates three variables: one where those who attend public school are coded as 1, one where those who attend private school are coded as 1, and one where those who are homeschooled are coded as 1. The researcher then runs a regression with all three of these variables in the regression equation. Explain what the researcher has done wrong.
Unlock Deck
Unlock for access to all 35 flashcards in this deck.
Unlock Deck
k this deck
31
Explain why, if you are using the reference-group technique, you must leave one of the categories out when you are creating your reference-group variables.
Unlock Deck
Unlock for access to all 35 flashcards in this deck.
Unlock Deck
k this deck
32
Here is one of the reference-group regression equations from the textbook:
IMMINDEX = 12.13 + 1.95(ONEOUT) + 3.51(BOTHOUT)
with the reference group being respondents who had both parents born inside the U.S.
It seems that having both parents born outside the U.S. makes one more supportive than having just one parent born outside the U.S. What would you have to do in order to definitely claim this?
Unlock Deck
Unlock for access to all 35 flashcards in this deck.
Unlock Deck
k this deck
33
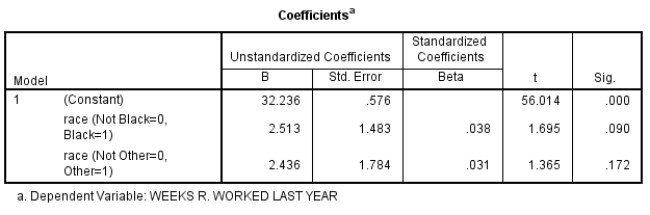
Here is a box of SPSS output using GSS2008 data, using whites as the reference group:
Do whites work fewer weeks than those from other racial groups? Explain.
Do whites work fewer weeks than those from other racial groups? Explain. Unlock Deck
Unlock for access to all 35 flashcards in this deck.
Unlock Deck
k this deck
34
Here is a regression equation using GSS2006 data. The dependent variable is an index of happiness (0=not happy, up to 4=very happy), and the independent variables are four reference group variables where "married" is the reference group. All slopes are statistically significant.
HAPPYINDEX = 2.87 - .39 (NEVER MARRIED) - .51 (SEPARATED) -
.47 (DIVORCED) - .56 (WIDOWED)
Someone looks at this equation and says: "well, if a woman got separated, then got divorced, but then got remarried, and then her husband died, leaving the woman a widow, her score on the index would be 1.33." Explain how this interpreter is misinterpreting the equation, and then interpret it correctly.
Unlock Deck
Unlock for access to all 35 flashcards in this deck.
Unlock Deck
k this deck
35
Explain how South and Spitze used a regular ratio-level variable, dichotomies, and a set of reference group variables to explain variation in housework.
Unlock Deck
Unlock for access to all 35 flashcards in this deck.
Unlock Deck
k this deck
Unlock Deck
Unlock for access to all 35 flashcards in this deck.


