Deck 7: Give Me One Good Reason Why: Bivariate Correlation and Regression
Full screen (f)
Question
Question
Question
Question
Question
Question
Question
Question
Question
Question
Question
Question
Question
Question
Question
Question
Question
Question
Question
Question
Question
Question
Question
Question
Question
Question
In the 2008GSS, we have the years of education and hours of television watched for five Native Hawaiians:
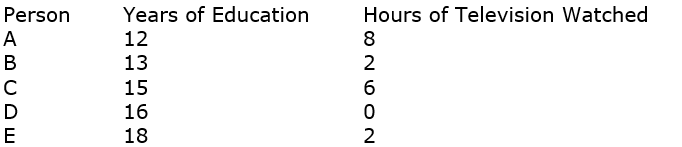 Using years of education as the independent variable and hours of television watched as the dependent variable, calculate the regression equation and correlation coefficient. Interpret your results.
Using years of education as the independent variable and hours of television watched as the dependent variable, calculate the regression equation and correlation coefficient. Interpret your results. Question
Question
Question
Question
Question
Question
Question
Question

Unlock Deck
Sign up to unlock the cards in this deck!
Unlock Deck
Unlock Deck
1/34
Play
Full screen (f)
Deck 7: Give Me One Good Reason Why: Bivariate Correlation and Regression
1
The most common form of simple regression uses:
A) two ratio-level variables
B) two ordinal-level variables
C) a ratio-level variable and a nominal-level variable
D) a ratio-level variable and an ordinal-level variable
A) two ratio-level variables
B) two ordinal-level variables
C) a ratio-level variable and a nominal-level variable
D) a ratio-level variable and an ordinal-level variable
A
2
If b=3, the mean of X is 5, and the mean of Y is 10, what is the value of the constant?
A) -5
B) 0
C) 5
D) 10
A) -5
B) 0
C) 5
D) 10
A
Explanation:10 = a + 3(5). Solving for a, we get -5
Explanation:10 = a + 3(5). Solving for a, we get -5
3
If the slope is 4, the mean of X is 7, and the constant is 3, what is the mean of Y?
A) -15
B) 0
C) 5
D) 31
A) -15
B) 0
C) 5
D) 31
D
Explanation:mean of Y = 3 + 4(7) = 31.
Explanation:mean of Y = 3 + 4(7) = 31.
4
When we want to visually examine the relationship between two ratio-level variables, the most common type of graph to use is:
A) the pie graph
B) the bar graph
C) the line graph
D) the scatterplot
A) the pie graph
B) the bar graph
C) the line graph
D) the scatterplot
Unlock Deck
Unlock for access to all 34 flashcards in this deck.
Unlock Deck
k this deck
5
If the value of the covariance is negative, which of the following cannot be true?
A) the slope is negative
B) the correlation coefficient is negative
C) the slope is exactly zero
D) the constant is exactly zero
A) the slope is negative
B) the correlation coefficient is negative
C) the slope is exactly zero
D) the constant is exactly zero
Unlock Deck
Unlock for access to all 34 flashcards in this deck.
Unlock Deck
k this deck
6
With simple regression, if we want to know the size of the effect, the best statistic to look at is:
A) the slope
B) the correlation coefficient
C) r-squared
D) the constant
A) the slope
B) the correlation coefficient
C) r-squared
D) the constant
Unlock Deck
Unlock for access to all 34 flashcards in this deck.
Unlock Deck
k this deck
7
We run a simple regression using an independent variable X and a dependent variable Y. We find that there is absolutely no relationship between the two variables. What will the regression line look like?
A) There can be no regression line in this situation.
B) It will be a completely vertical line at the mean of X.
C) It will be a completely horizontal line at the mean of Y.
D) It will take on a U-shape.
A) There can be no regression line in this situation.
B) It will be a completely vertical line at the mean of X.
C) It will be a completely horizontal line at the mean of Y.
D) It will take on a U-shape.
Unlock Deck
Unlock for access to all 34 flashcards in this deck.
Unlock Deck
k this deck
8
With simple regression, the best-fitting line is the one that:
A) touches the most points
B) has the least squared distances from the points
C) has the least squared vertical distances from the points
D) has the least squared horizontal distances from the points
A) touches the most points
B) has the least squared distances from the points
C) has the least squared vertical distances from the points
D) has the least squared horizontal distances from the points
Unlock Deck
Unlock for access to all 34 flashcards in this deck.
Unlock Deck
k this deck
9
Regular regression is also called OLS, or:
A) ordinary least squares regression
B) only linear situations regression
C) obvious latent summary regression
D) original longitudinal survey regression
A) ordinary least squares regression
B) only linear situations regression
C) obvious latent summary regression
D) original longitudinal survey regression
Unlock Deck
Unlock for access to all 34 flashcards in this deck.
Unlock Deck
k this deck
10
With simple regression, if we want to know the strength of the relationship, the best statistic to look at is:
A) the slope
B) the correlation coefficient
C) r-squared
D) the constant
A) the slope
B) the correlation coefficient
C) r-squared
D) the constant
Unlock Deck
Unlock for access to all 34 flashcards in this deck.
Unlock Deck
k this deck
11
A researcher looks at two variables: the number of cats people own, and the number of dogs people own. She finds that the correlation coefficient is -.84. The best interpretation of this value is:
A) Few people with cats have dogs.
B) Few people with dogs have cats.
C) As the number of dogs people own goes up, the number of cats people tend to own goes down.
D) The relationship between cats and dogs is negative.
A) Few people with cats have dogs.
B) Few people with dogs have cats.
C) As the number of dogs people own goes up, the number of cats people tend to own goes down.
D) The relationship between cats and dogs is negative.
Unlock Deck
Unlock for access to all 34 flashcards in this deck.
Unlock Deck
k this deck
12
With regard to positive signs and negative signs, which of the following is most accurate?
A) The correlation coefficient and the slope are always the same sign.
B) The correlation coefficient and the slope are never the same sign.
C) The correlation coefficient and the slope are usually the same sign.
D) The correlation coefficient and the slope are almost always the same sign.
A) The correlation coefficient and the slope are always the same sign.
B) The correlation coefficient and the slope are never the same sign.
C) The correlation coefficient and the slope are usually the same sign.
D) The correlation coefficient and the slope are almost always the same sign.
Unlock Deck
Unlock for access to all 34 flashcards in this deck.
Unlock Deck
k this deck
13
A correlation coefficient of -.40 is ________ a correlation coefficient of +.40.
A) not as strong as
B) .80 less strong as
C) just as strong as
D) twice as strong as
A) not as strong as
B) .80 less strong as
C) just as strong as
D) twice as strong as
Unlock Deck
Unlock for access to all 34 flashcards in this deck.
Unlock Deck
k this deck
14
With simple regression, if we want to know the proportion of variation in the dependent variable that is explained by its relationship with the independent variable, the best statistic to look at is:
A) the slope
B) the correlation coefficient
C) r-squared
D) the constant
A) the slope
B) the correlation coefficient
C) r-squared
D) the constant
Unlock Deck
Unlock for access to all 34 flashcards in this deck.
Unlock Deck
k this deck
15
In the movie gross forecasting example in the textbook, the removal of the James Cameron films from the sample:
A) made the relationship weaker
B) made the relationship stronger
C) made the relationship perfect
D) had no effect on the strength of the relationship
A) made the relationship weaker
B) made the relationship stronger
C) made the relationship perfect
D) had no effect on the strength of the relationship
Unlock Deck
Unlock for access to all 34 flashcards in this deck.
Unlock Deck
k this deck
16
The textbook suggests that if you're using a large number of cases and you end up with a small r-squared value of, say, 0.02, you should:
A) use a smaller number of cases
B) start over with different variables
C) check your math
D) be unphased, as this can happen
A) use a smaller number of cases
B) start over with different variables
C) check your math
D) be unphased, as this can happen
Unlock Deck
Unlock for access to all 34 flashcards in this deck.
Unlock Deck
k this deck
17
In the textbook example about health and work, which had the weakest correlation?
A) men's missed work with men's physical health
B) men's missed work with men's emotional health
C) women's missed work with women's physical health
D) women's missed work with women's emotional health
A) men's missed work with men's physical health
B) men's missed work with men's emotional health
C) women's missed work with women's physical health
D) women's missed work with women's emotional health
Unlock Deck
Unlock for access to all 34 flashcards in this deck.
Unlock Deck
k this deck
18
In their article on U.S. politics, Healy and Lenz examine the correlation between:
A) campaign spending and vote share
B) negative advertisements and vote share
C) candidate age and vote share
D) economic growth and vote share
A) campaign spending and vote share
B) negative advertisements and vote share
C) candidate age and vote share
D) economic growth and vote share
Unlock Deck
Unlock for access to all 34 flashcards in this deck.
Unlock Deck
k this deck
19
In Healy and Lenz's article on U.S. politics, they find __________ between economic growth and vote share.
A) no correlation
B) a weak correlation
C) a moderately strong correlation
D) a perfect correlation
A) no correlation
B) a weak correlation
C) a moderately strong correlation
D) a perfect correlation
Unlock Deck
Unlock for access to all 34 flashcards in this deck.
Unlock Deck
k this deck
20
Jaeger uses which dataset in his study of physical attractiveness?
A) The National Longitudinal Study of Adolescent to Adult Health
B) The Wisconsin Longitudinal Survey
C) The Panel Study of Health Dynamics
D) The General Social Survey
A) The National Longitudinal Study of Adolescent to Adult Health
B) The Wisconsin Longitudinal Survey
C) The Panel Study of Health Dynamics
D) The General Social Survey
Unlock Deck
Unlock for access to all 34 flashcards in this deck.
Unlock Deck
k this deck
21
In presenting his findings, Jaeger uses what technique?
A) a scatterplot
B) a regression equation
C) a correlation matrix
D) a crosstabulation
A) a scatterplot
B) a regression equation
C) a correlation matrix
D) a crosstabulation
Unlock Deck
Unlock for access to all 34 flashcards in this deck.
Unlock Deck
k this deck
22
With regard to BMI and physical attractiveness, which of the following best describes what Jaeger found?
A) Men's BMI was positively correlated with physical attractiveness
B) Men's BMI was negatively correlated with physical attractiveness
C) Women's BMI was positively correlated with physical attractiveness
D) Women's BMI was negatively correlated with physical attractiveness
A) Men's BMI was positively correlated with physical attractiveness
B) Men's BMI was negatively correlated with physical attractiveness
C) Women's BMI was positively correlated with physical attractiveness
D) Women's BMI was negatively correlated with physical attractiveness
Unlock Deck
Unlock for access to all 34 flashcards in this deck.
Unlock Deck
k this deck
23
When you run a scatterplot in SPSS, you put the dependent variable on the:
A) x-axis
B) y-axis
C) z-axis
D) h-axis
A) x-axis
B) y-axis
C) z-axis
D) h-axis
Unlock Deck
Unlock for access to all 34 flashcards in this deck.
Unlock Deck
k this deck
24
The textbook suggests that if you want to run a scatterplot in SPSS:
A) use a small number of cases
B) use a large number of cases
C) you should run a chi-square test as well
D) you should run a t-test as well
A) use a small number of cases
B) use a large number of cases
C) you should run a chi-square test as well
D) you should run a t-test as well
Unlock Deck
Unlock for access to all 34 flashcards in this deck.
Unlock Deck
k this deck
25
Both crosstabs and simple regression can be used to look at relationships between two variables. Explain how you would choose which one of these to use.
Unlock Deck
Unlock for access to all 34 flashcards in this deck.
Unlock Deck
k this deck
26
In the 2008GSS, we have the years of education and hours of television watched for five Native Hawaiians:
Using years of education as the independent variable and hours of television watched as the dependent variable, calculate the regression equation and correlation coefficient. Interpret your results.
Using years of education as the independent variable and hours of television watched as the dependent variable, calculate the regression equation and correlation coefficient. Interpret your results. Unlock Deck
Unlock for access to all 34 flashcards in this deck.
Unlock Deck
k this deck
27
Among Buddhists in the GSS2008, does education affect how often one visits an art museum? Here are the regression results:
TIMES VISIT ART MUSEUM IN PAST YEAR = -3.94 + .31 (YRS. EDUC)
r = .62, r2 = .38 n = 10
Interpret these results, and make predictions for a Buddhist who has 16 years of education, and a Buddhist who has 22 years of education.
TIMES VISIT ART MUSEUM IN PAST YEAR = -3.94 + .31 (YRS. EDUC)
r = .62, r2 = .38 n = 10
Interpret these results, and make predictions for a Buddhist who has 16 years of education, and a Buddhist who has 22 years of education.
Unlock Deck
Unlock for access to all 34 flashcards in this deck.
Unlock Deck
k this deck
28
Explain why regular regression is sometimes called Ordinary Least Squares regression.
Unlock Deck
Unlock for access to all 34 flashcards in this deck.
Unlock Deck
k this deck
29
Someone shows you some regression results they just developed. They have a negative slope and a positive correlation coefficient. Explain to them why they must have done something wrong.
Unlock Deck
Unlock for access to all 34 flashcards in this deck.
Unlock Deck
k this deck
30
To assess the relationship between number of absences and grades, an instructor collects data from the 10 students in a class and runs a simple regression. She finds a perfect negative relationship: as number of absences goes up, grades go down. But then, the instructor remembers that there is an 11th person in the class: someone who never came to class but still managed somehow to get a perfect grade in the course. Conceptually (not mathematically) describe what will happen to the slope and correlation coefficient.
Unlock Deck
Unlock for access to all 34 flashcards in this deck.
Unlock Deck
k this deck
31
Using the relationship between education and income, explain what an outlier is, and why it is likely to affect regression results more dramatically in a small sample than a larger sample.
Unlock Deck
Unlock for access to all 34 flashcards in this deck.
Unlock Deck
k this deck
32
Using only the American Indians in the GSS2008, we run regressions to see if education affects income, and we do so for men and women. The r2 for men is .28 and the r2 for women is .03. Interpret this difference.
Unlock Deck
Unlock for access to all 34 flashcards in this deck.
Unlock Deck
k this deck
33
Explain why there is a diagonal of "1.00"s in every correlation matrix.
Unlock Deck
Unlock for access to all 34 flashcards in this deck.
Unlock Deck
k this deck
34
Explain how the health and work example in the textbook uses regression to dispel an important gender stereotype.
Unlock Deck
Unlock for access to all 34 flashcards in this deck.
Unlock Deck
k this deck
Unlock Deck
Unlock for access to all 34 flashcards in this deck.


