Deck 15: Questioning the Greatness of Straightness: Nonlinear Relationships
Full screen (f)
Question
Question
Question
Question
Question
Question
Question
Question
Question
Question
Question
Question
Question
Question
Question
Question
Question
Question
Question
Question
Question
Question
Question
Question
Question
Question
We hypothesize that there is a non-linear relationship between internet usage and television usage. Here are two regression models. Interpret them, addressing the hypothesis.
Dependent Variable: Hours Spent Per Week Watching TV
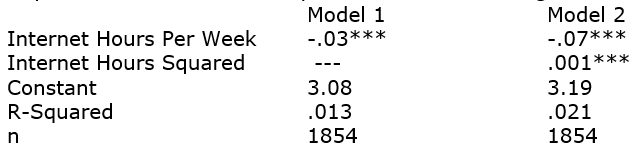
Dependent Variable: Hours Spent Per Week Watching TV
Question
Below are two sets of nested models using GSS2006 data. The first set includes only white women, the second set includes only black women.
Dependent Variable: Respondent's Income in Thousands of Dollars
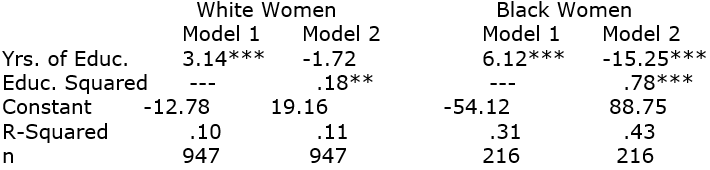 By describing key differences between the effects for white and black women, address this question: for which group is there a more pronounced non-linear relationship?
Dependent Variable: Respondent's Income in Thousands of Dollars
By describing key differences between the effects for white and black women, address this question: for which group is there a more pronounced non-linear relationship? Question
Question
Question
Question
Question
Question
Question
Question

Unlock Deck
Sign up to unlock the cards in this deck!
Unlock Deck
Unlock Deck
1/35
Play
Full screen (f)
Deck 15: Questioning the Greatness of Straightness: Nonlinear Relationships
1
Which of the following does not belong in this list?
A) non-linear
B) curvilinear
C) quadratic
D) logistic
A) non-linear
B) curvilinear
C) quadratic
D) logistic
D
2
What is the most common format for a simple non-linear regression equation?
A) y = a2 + bx
B) y = a + b2x
C) y = a + bx2
D) y = a + bx +cx2
A) y = a2 + bx
B) y = a + b2x
C) y = a + bx2
D) y = a + bx +cx2
D
3
A researcher hypothesizes that there is a non-linear relationship between hours of internet use per week and happiness. He gets the following equation:
HAPPINESS = 2.37 + .03 (INTERNETHOURS)2
The slope is statistically significant.
What is the best conclusion to make based on this equation?
A) Internet use has a linear relationship with happiness.
B) Internet use has a nonlinear relationship with happiness.
C) Internet use has no relationship with happiness.
D) Cannot determine, since non-squared variable is not present.
D
4
We suspect that the amount you eat (as measured by number of calories) affects happiness in a nonlinear way: those who eat very little will not be happy, those who eat a good amount will be happy, and those who eat a whole lot will not be happy. If we are correct, what form will the model take?
A) HAPPINESS = constant + # (CALORIES) - # (CALORIES)2
B) HAPPINESS = constant - # (CALORIES) + # (CALORIES)2
C) HAPPINESS = constant + # (CALORIES) + # (CALORIES)2
D) HAPPINESS = constant - # (CALORIES) - # (CALORIES)2
A) HAPPINESS = constant + # (CALORIES) - # (CALORIES)2
B) HAPPINESS = constant - # (CALORIES) + # (CALORIES)2
C) HAPPINESS = constant + # (CALORIES) + # (CALORIES)2
D) HAPPINESS = constant - # (CALORIES) - # (CALORIES)2
Unlock Deck
Unlock for access to all 35 flashcards in this deck.
Unlock Deck
k this deck
5
We suspect that the average monthly outside temperature affects electricity costs in a nonlinear way: during a very cold month electricity costs will be high, during a moderate month electricity costs will be low, and during a very hot month electricity costs will be high. If we are correct, what form will the model take?
A) COST = constant + # (TEMPERATURE) - # (TEMPERATURE)2
B) COST = constant - # (TEMPERATURE) + # (TEMPERATURE)2
C) COST = constant + # (TEMPERATURE) + # (TEMPERATURE)2
D) COST = constant - # (TEMPERATURE) - # (TEMPERATURE)2
A) COST = constant + # (TEMPERATURE) - # (TEMPERATURE)2
B) COST = constant - # (TEMPERATURE) + # (TEMPERATURE)2
C) COST = constant + # (TEMPERATURE) + # (TEMPERATURE)2
D) COST = constant - # (TEMPERATURE) - # (TEMPERATURE)2
Unlock Deck
Unlock for access to all 35 flashcards in this deck.
Unlock Deck
k this deck
6
Here is a set of nested models:
A) Because the linear effect does not lose its statistical significance in Model 2, the linear model is the better model.
B) Neither the linear model nor the non-linear model is better.
C) Because the squared slope is statistically significant, the non-linear model is the better model.
D) Because the R-squared for the non-linear model is much higher than the R-squared for the linear model, the non-linear model is the better model.
Unlock Deck
Unlock for access to all 35 flashcards in this deck.
Unlock Deck
k this deck
7
Using GSS2008 data (respondents aged 18 to 49), here is a non-linear regression equation, using "number of times respondent goes to the zoo" as the dependent variable:
ZOOVISIT = -2.65 + .25 (AGE) - .0038 (AGE)2
According to this equation, who goes to the zoo the most often?
A) an 18-year-old
B) a 25-year-old
C) a 33-year-old
D) a 49-year-old
ZOOVISIT = -2.65 + .25 (AGE) - .0038 (AGE)2
According to this equation, who goes to the zoo the most often?
A) an 18-year-old
B) a 25-year-old
C) a 33-year-old
D) a 49-year-old
Unlock Deck
Unlock for access to all 35 flashcards in this deck.
Unlock Deck
k this deck
8
Using GSS2006 data, here is a non-linear regression equation, using "hours per day respondent has to relax" as the dependent variable:
HRSRELAX = 5.83 - .11 (AGE) + .00135 (AGE)2
According to this equation, who has the least amount of time to relax?
A) an 18-year-old
B) a 33-year-old
C) a 41-year-old
D) a 53-year-old
HRSRELAX = 5.83 - .11 (AGE) + .00135 (AGE)2
According to this equation, who has the least amount of time to relax?
A) an 18-year-old
B) a 33-year-old
C) a 41-year-old
D) a 53-year-old
Unlock Deck
Unlock for access to all 35 flashcards in this deck.
Unlock Deck
k this deck
9
What shape does this nonlinear equation take:
Y = -136.82 +10.24(x) - .10(x2)
A) a u-shape
B) an n-shape
C) a w-shape
D) a v-shape
Y = -136.82 +10.24(x) - .10(x2)
A) a u-shape
B) an n-shape
C) a w-shape
D) a v-shape
Unlock Deck
Unlock for access to all 35 flashcards in this deck.
Unlock Deck
k this deck
10
What shape does this nonlinear equation take:
Y = 13.62 -.49(x) + .005(x2)
A) a u-shape
B) an n-shape
C) a w-shape
D) a v-shape
Y = 13.62 -.49(x) + .005(x2)
A) a u-shape
B) an n-shape
C) a w-shape
D) a v-shape
Unlock Deck
Unlock for access to all 35 flashcards in this deck.
Unlock Deck
k this deck
11
Using GSS2006 data, here is a non-linear regression equation, using hours of television watched as the dependent variable (EDUC stands for years of education, all slopes are statistically significant):
TVHOURS = 3.36 + .12 (EDUC) -.011 (EDUC)2
Which of the following is the most accurate description of what is going on?
A) People with low levels of education watch a lot of television, then people with moderate levels of education watch less television, and then people with high levels of education watch a lot of television.
B) People with low levels of education watch a little of television, then people with moderate levels of education watch more television, and then people with high levels of education watch a little of television.
C) People with low levels of education watch the most television, and for each additional year of education, hours of television watched goes down by the same amount.
D) People with low levels of education watch the most television, and as education increases, hours of television watched starts going down, slowly at first, and then more and more rapidly.
Unlock Deck
Unlock for access to all 35 flashcards in this deck.
Unlock Deck
k this deck
12
At early levels of income, each additional rise in income produces a sharp rise in financial satisfaction, but at high levels of income, each additional rise in income produces a very small rise in financial satisfaction. This is known as:
A) a quadratic equation
B) diminishing returns
C) a squared term
D) rich people's malaise
A) a quadratic equation
B) diminishing returns
C) a squared term
D) rich people's malaise
Unlock Deck
Unlock for access to all 35 flashcards in this deck.
Unlock Deck
k this deck
13
Here is a set of nested models:
What is the most appropriate conclusion to make based on these models?
A) The relationship between education and income is linear.
B) The relationship between education and income is non-linear.
C) There is no relationship between education and income.
D) Education has a larger effect on income than hours worked.
Unlock Deck
Unlock for access to all 35 flashcards in this deck.
Unlock Deck
k this deck
14
To investigate a possible nonlinear relationship, you use an income variable, which is income in dollars, as well as its square. In your SPSS results, the slope for the squared variable is a statistically significant +0.00054. When you write up your results, and calculate examples using your results, which would be the best version of this result to use?
A) +0.0
B) +0.001
C) +0.0005
D) +0.00054
A) +0.0
B) +0.001
C) +0.0005
D) +0.00054
Unlock Deck
Unlock for access to all 35 flashcards in this deck.
Unlock Deck
k this deck
15
Using base 10, what is the log of 1000?
A) 0
B) 1
C) 2
D) 3
A) 0
B) 1
C) 2
D) 3
Unlock Deck
Unlock for access to all 35 flashcards in this deck.
Unlock Deck
k this deck
16
If we're using income as an independent variable, but our dataset for some reason has people with incomes ranging from $3,000 to $30,000,000. What might we want to do?
A) use a squared version of the income variable in addition to the regular version
B) divide each person's income by 1000
C) use the log of the income variable
D) find another dataset
A) use a squared version of the income variable in addition to the regular version
B) divide each person's income by 1000
C) use the log of the income variable
D) find another dataset
Unlock Deck
Unlock for access to all 35 flashcards in this deck.
Unlock Deck
k this deck
17
Which of the following variables would you most likely want to log for use in regression?
A) income of respondent
B) number of children a respondent has had
C) age of respondent
D) sex of respondent
A) income of respondent
B) number of children a respondent has had
C) age of respondent
D) sex of respondent
Unlock Deck
Unlock for access to all 35 flashcards in this deck.
Unlock Deck
k this deck
18
Volden, Wiseman, and Wittmer's measure of effectiveness concerns:
A) the number of committees on which she serves
B) the number of bills she helps become law
C) the percentage of the vote she gets during re-election
D) her favorability rating among her constituents
A) the number of committees on which she serves
B) the number of bills she helps become law
C) the percentage of the vote she gets during re-election
D) her favorability rating among her constituents
Unlock Deck
Unlock for access to all 35 flashcards in this deck.
Unlock Deck
k this deck
19
According to Volden, Wiseman, and Wittmer, who would be the most effective congressperson?
A) a congressman from the majority party
B) a congressman from the minority party
C) a congresswoman from the majority party
D) a congresswoman from the minority party
A) a congressman from the majority party
B) a congressman from the minority party
C) a congresswoman from the majority party
D) a congresswoman from the minority party
Unlock Deck
Unlock for access to all 35 flashcards in this deck.
Unlock Deck
k this deck
20
Volden, Wiseman, and Wittmer's research on congresspeople identifies a non-linear relationship between seniority and effectiveness. Which of the following best characterizes what they found?
A) a u-shaped curve: those with low seniority have low effectiveness, those with medium seniority have high effectiveness, and those with high seniority have low effectiveness
B) a ∩-shaped curve: those with low seniority have high effectiveness, those with medium seniority have low effectiveness, and those with high seniority have high effectiveness
C) seniority has a big effect at first, but then this effect tapers off as seniority gets very high
D) seniority has a small effect at first, but then starts to have larger effects as seniority gets very high
Unlock Deck
Unlock for access to all 35 flashcards in this deck.
Unlock Deck
k this deck
21
If you want effective government, according to Volden, Wiseman, and Wittmer, make sure that your congressperson:
A) wins by a small margin
B) wins by a fair amount but not too much
C) wins by a very wide margin
D) wins by running unopposed
A) wins by a small margin
B) wins by a fair amount but not too much
C) wins by a very wide margin
D) wins by running unopposed
Unlock Deck
Unlock for access to all 35 flashcards in this deck.
Unlock Deck
k this deck
22
Eagle's research on congregation size concentrates on:
A) churches
B) temples
C) mosques
D) all of the above
A) churches
B) temples
C) mosques
D) all of the above
Unlock Deck
Unlock for access to all 35 flashcards in this deck.
Unlock Deck
k this deck
23
Which of the following does Eagle use in his models examining the relationship between congregation size and religious attendance?
A) logistic regression
B) logged variables
C) nonlinear regression
D) all of the above
A) logistic regression
B) logged variables
C) nonlinear regression
D) all of the above
Unlock Deck
Unlock for access to all 35 flashcards in this deck.
Unlock Deck
k this deck
24
In his research on congregation size, Eagle finds that with regard to the number of regular attenders per congregation, which statistic has grown larger over time:
A) the median
B) the mean
C) the standard deviation
D) all of the above
A) the median
B) the mean
C) the standard deviation
D) all of the above
Unlock Deck
Unlock for access to all 35 flashcards in this deck.
Unlock Deck
k this deck
25
You are a Catholic priest who wants to ensure that your congregants are very likely to attend religious services. According to Eagle's findings, what ideal size church should you aim for?
A) one with 100 members
B) one with 400 members
C) one with 1000 members
D) one with 3000 members
A) one with 100 members
B) one with 400 members
C) one with 1000 members
D) one with 3000 members
Unlock Deck
Unlock for access to all 35 flashcards in this deck.
Unlock Deck
k this deck
26
We hypothesize that there is a non-linear relationship between internet usage and television usage. Here are two regression models. Interpret them, addressing the hypothesis.
Dependent Variable: Hours Spent Per Week Watching TV
Dependent Variable: Hours Spent Per Week Watching TV
Unlock Deck
Unlock for access to all 35 flashcards in this deck.
Unlock Deck
k this deck
27
Below are two sets of nested models using GSS2006 data. The first set includes only white women, the second set includes only black women.
Dependent Variable: Respondent's Income in Thousands of Dollars
By describing key differences between the effects for white and black women, address this question: for which group is there a more pronounced non-linear relationship?
Dependent Variable: Respondent's Income in Thousands of Dollars
By describing key differences between the effects for white and black women, address this question: for which group is there a more pronounced non-linear relationship? Unlock Deck
Unlock for access to all 35 flashcards in this deck.
Unlock Deck
k this deck
28
What if you hypothesized that there is a nonlinear relationship between number of dogs you have and your stress level: having a dog or two, or even three lowers your stress level, but then if you have lots and lots of dogs, that ends up causing more stress. Describe the equations you would create to see if this hypothesis is supported, and then describe what the equations would likely look like if the hypothesis was indeed supported.
Unlock Deck
Unlock for access to all 35 flashcards in this deck.
Unlock Deck
k this deck
29
What if you hypothesized that there is a nonlinear relationship between amount of responsibility at work and job satisfaction: having some responsibility at work raises job satisfaction to a level higher than if someone had no responsibility at work; but having too much responsibility at work once again lowers job satisfaction. Describe the equations you would create to see if this hypothesis is supported, and then describe what the equations would likely look like if the hypothesis was indeed supported.
Unlock Deck
Unlock for access to all 35 flashcards in this deck.
Unlock Deck
k this deck
30
You want to use a GSS variable regarding whether or not the respondent favors the legalization of marijuana. You hypothesize that age plays a role with younger people supporting legalization, middle-aged people opposing legalization, and elderly people supporting legalization, but you also hypothesize that this relationship might look different for men and women. Based on all this, describe what regression techniques you would use. Just name them and explain why.
Unlock Deck
Unlock for access to all 35 flashcards in this deck.
Unlock Deck
k this deck
31
Here are two equations using GSS2008 data. The first equation involves only white respondents, and describes a linear relationship (since there was not a non-linear relationship between these variables):
HOURS WORKED PER WEEK = 13.71 + 1.36 (EDUC)
The second equation involves only black respondents, and describes a non-linear relationship (since it performed better than the linear equation for blacks):
HOURS WORKED PER WEEK = -19.93 + 6.85 (EDUC) -.19 (EDUC)2
First, calculate predicted hours worked for each race, for someone with nine years of education, someone with sixteen years of education, and someone with twenty-two years of education. Then, interpret your results.
Unlock Deck
Unlock for access to all 35 flashcards in this deck.
Unlock Deck
k this deck
32
Why does the textbook suggest, if you are using a squared variable for such aspects as income or age, it is important to keep several more decimal places than usual when you are using your slopes to calculate predictions?
Unlock Deck
Unlock for access to all 35 flashcards in this deck.
Unlock Deck
k this deck
33
Describe a situation where you might want to use the log of a variable rather than the original variable.
Unlock Deck
Unlock for access to all 35 flashcards in this deck.
Unlock Deck
k this deck
34
Explain why, using base 10, the log of 10000 is 4.
Unlock Deck
Unlock for access to all 35 flashcards in this deck.
Unlock Deck
k this deck
35
Explain why, in his research on the effects of congregation size, Eagle used the log of congregation size rather than simply the congregation size.
Unlock Deck
Unlock for access to all 35 flashcards in this deck.
Unlock Deck
k this deck
Unlock Deck
Unlock for access to all 35 flashcards in this deck.


