Deck 13: Correlation and Regression: Are We Related
Full screen (f)
Question
Question
Question
Question
Question
Question
Question
Question
Question
Question
Question
Question
Question
Question
Question
Question
Question
Question
Question
Question
Question
Question
Question
Question
Question
Question
Question
Question
Question
Question
Question
Question
Question
Question
Question
Question
Question
Question
Question
Question
Question
Question
Question
Question
Question
Question
Does money buy happiness? A research collected data on how much individuals spent for the holidays, and how satisfied they were with their holiday season, overall. Below are the data:
 calculate the correlation
calculate the correlation Question
Does money buy happiness? A research collected data on how much individuals spent for the holidays, and how satisfied they were with their holiday season, overall. Below are the data:
 how many degrees of freedom are there for the test?
how many degrees of freedom are there for the test? Question
Does money buy happiness? A research collected data on how much individuals spent for the holidays, and how satisfied they were with their holiday season, overall. Below are the data:
 is the result significant at alpha = .05?
is the result significant at alpha = .05? Question
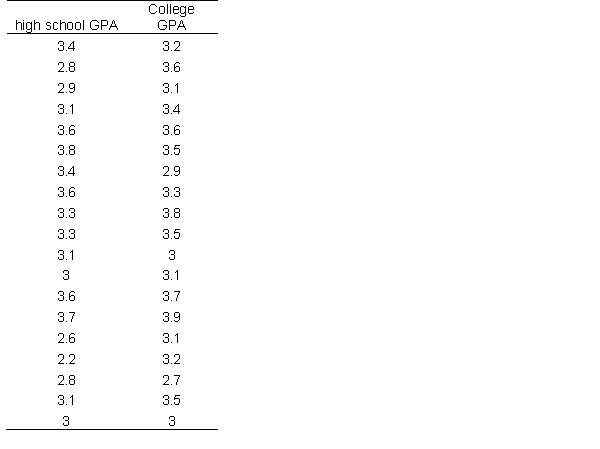
Do high school grades predict college academic success? Below are data collected from some recent college graduates.
 What is the correlation?
What is the correlation? Question
Do high school grades predict college academic success? Below are data collected from some recent college graduates.
 How many degrees of freedom are there?
How many degrees of freedom are there? Question
Do high school grades predict college academic success? Below are data collected from some recent college graduates.
 is the test significant at the alpha = .05 leve? What about the .01 level?
is the test significant at the alpha = .05 leve? What about the .01 level? Question
Do high school grades predict college academic success? Below are data collected from some recent college graduates.
 What is the regression coefficient for the prediction?
What is the regression coefficient for the prediction? Question
Do high school grades predict college academic success? Below are data collected from some recent college graduates.
 What is the coefficient of determination?
What is the coefficient of determination? Question
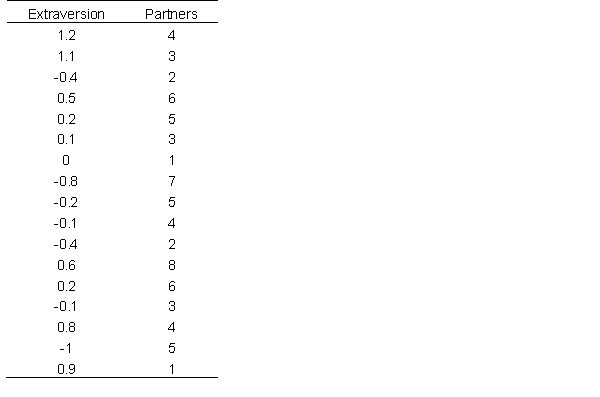
Is a person's degree of extraversion a predictor of romantic partners? Below are normed data on individuals' degree of extraversion and the number of partners they've had.
 What is the correlation?
What is the correlation? Question
Is a person's degree of extraversion a predictor of romantic partners? Below are normed data on individuals' degree of extraversion and the number of partners they've had.
 How many degrees of freedom are there in this test?
How many degrees of freedom are there in this test? Question
Is a person's degree of extraversion a predictor of romantic partners? Below are normed data on individuals' degree of extraversion and the number of partners they've had.
 Is the correlation statistically significant at alpha = .05?
Is the correlation statistically significant at alpha = .05? Question
Is a person's degree of extraversion a predictor of romantic partners? Below are normed data on individuals' degree of extraversion and the number of partners they've had.
 identify a potential hidden variable that may explain the variable that the researcher failed to take into account
identify a potential hidden variable that may explain the variable that the researcher failed to take into account Question
Question

Unlock Deck
Sign up to unlock the cards in this deck!
Unlock Deck
Unlock Deck
1/59
Play
Full screen (f)
Deck 13: Correlation and Regression: Are We Related
1
Positive correlations are also described as indirect, whereas negative correlations are also described as direct.
False
2
in a positive correlation, as the value of X increases, the value of Y also increases
True
3
The strength of a correlation depends on whether it's positive or negative
False
4
A correlation of .78 is stronger than a correlation of -.92.
Unlock Deck
Unlock for access to all 59 flashcards in this deck.
Unlock Deck
k this deck
5
When testing a correlation, the null hypothesis states that there is no correlation
Unlock Deck
Unlock for access to all 59 flashcards in this deck.
Unlock Deck
k this deck
6
A least squares regression line minimizes the distance from each datum in the dataset to it.
Unlock Deck
Unlock for access to all 59 flashcards in this deck.
Unlock Deck
k this deck
7
In a regression equation, if b is positive, then the correlation between the predictor and outcome must be negatively correlated.
Unlock Deck
Unlock for access to all 59 flashcards in this deck.
Unlock Deck
k this deck
8
In a regression equation, a stronger equation between the two variables would lead to more horizontal regression line.
Unlock Deck
Unlock for access to all 59 flashcards in this deck.
Unlock Deck
k this deck
9
In a regression equation, if a is negative, then the correlation between the predictor and outcome must be negatively correlated.
Unlock Deck
Unlock for access to all 59 flashcards in this deck.
Unlock Deck
k this deck
10
The coefficient of determination is used to explain the proportion of variance shared between two variables
Unlock Deck
Unlock for access to all 59 flashcards in this deck.
Unlock Deck
k this deck
11
A strong negative correlation will lead to a large positive coefficient of determination
Unlock Deck
Unlock for access to all 59 flashcards in this deck.
Unlock Deck
k this deck
12
Smaller coefficients of determination means that the two variables have a weaker relationship
Unlock Deck
Unlock for access to all 59 flashcards in this deck.
Unlock Deck
k this deck
13
A correlation of .04 and -.04 will have the same coefficient of determination.
Unlock Deck
Unlock for access to all 59 flashcards in this deck.
Unlock Deck
k this deck
14
Correlation might not mean causation, but if data is analyzed by an ANOVA or t-test, a significant result is a causal relationship.
Unlock Deck
Unlock for access to all 59 flashcards in this deck.
Unlock Deck
k this deck
15
Correlations measures dependence between two variables
Unlock Deck
Unlock for access to all 59 flashcards in this deck.
Unlock Deck
k this deck
16
If a correlation between two variables is -.2, the coefficient of determination is -.04
Unlock Deck
Unlock for access to all 59 flashcards in this deck.
Unlock Deck
k this deck
17
When testing a correlation between 2 variables with 20 pairs of data, the degrees of freedom is 19
Unlock Deck
Unlock for access to all 59 flashcards in this deck.
Unlock Deck
k this deck
18
In regression, the y-variable is often the predicted variable. The x-variable is used to predict the y-variable.
Unlock Deck
Unlock for access to all 59 flashcards in this deck.
Unlock Deck
k this deck
19
The regression coefficient is negatively correlated with the correlation coefficient of the same two variables
Unlock Deck
Unlock for access to all 59 flashcards in this deck.
Unlock Deck
k this deck
20
The Pearson correlation can be applied to linear relationships as well as curvilinear relationships
Unlock Deck
Unlock for access to all 59 flashcards in this deck.
Unlock Deck
k this deck
21
A correlation coefficient is bounded between which two values?
A) 0.00 and 1.00
B) -1.00 and 1.00
C) There are no numeric boundaries. Correlations can go from weak to strong.
D) -100 and 100
A) 0.00 and 1.00
B) -1.00 and 1.00
C) There are no numeric boundaries. Correlations can go from weak to strong.
D) -100 and 100
Unlock Deck
Unlock for access to all 59 flashcards in this deck.
Unlock Deck
k this deck
22
The correlation coefficient is a statistic that measures the degree of _________________ between two variables.
A) cause
B) association
C) validity
D) variability
A) cause
B) association
C) validity
D) variability
Unlock Deck
Unlock for access to all 59 flashcards in this deck.
Unlock Deck
k this deck
23
Which of the following is the strongest correlation?
A) -.77
B) .08
C) .36
D) .72
A) -.77
B) .08
C) .36
D) .72
Unlock Deck
Unlock for access to all 59 flashcards in this deck.
Unlock Deck
k this deck
24
Which of the following indicates the weakest correlation?
A) 0.11
B) -.28
C) -.97
D) .50
A) 0.11
B) -.28
C) -.97
D) .50
Unlock Deck
Unlock for access to all 59 flashcards in this deck.
Unlock Deck
k this deck
25
A researcher is examining whether the amount of time newborns can sleep without being disturbed is related to parental stress. The researcher asked 30 parents to report the longest amount of time in number of minutes their newborn child has been able to sleep without waking up. Then the parents were asked to rate their stress levels.
How many degrees of freedom are there for this correlation?
A) 30
B) 29
C) 27
D) 28
How many degrees of freedom are there for this correlation?
A) 30
B) 29
C) 27
D) 28
Unlock Deck
Unlock for access to all 59 flashcards in this deck.
Unlock Deck
k this deck
26
A researcher is examining whether the amount of time newborns can sleep without being disturbed is related to parental stress. The researcher asked 30 parents to report the longest amount of time in number of minutes their newborn child has been able to sleep without waking up. Then the parents were asked to rate their stress levels.
What is the critical value assuming α = .05?
A) .367
B) .361
C) .463
D) .471
What is the critical value assuming α = .05?
A) .367
B) .361
C) .463
D) .471
Unlock Deck
Unlock for access to all 59 flashcards in this deck.
Unlock Deck
k this deck
27
A researcher is examining whether the amount of time newborns can sleep without being disturbed is related to parental stress. The researcher asked 30 parents to report the longest amount of time in number of minutes their newborn child has been able to sleep without waking up. Then the parents were asked to rate their stress levels.
The researcher find a correlation of -.56. What does this mean?
A) the result is significant. The data suggest that parents who are more stressed have newborns that can sleep longer.
B) The result is significant. The data suggests that parents who are more stressed have newborns that sleep for shorter time.
C) The result is not significant. There is no evidence from this sample that suggests that parental stress and newborn sleep duration are related.
D) The result is significant. Parental stress causes newborns to sleep less.
Unlock Deck
Unlock for access to all 59 flashcards in this deck.
Unlock Deck
k this deck
28
Which of the following is beyond the scope of a Pearson correlation?
A) calculating a linear relationship between two variables.
B) You can use it to determine how much one variable explains another variable.
C) Determine quadratic relationships between two variables
D) All of the above are correct.
A) calculating a linear relationship between two variables.
B) You can use it to determine how much one variable explains another variable.
C) Determine quadratic relationships between two variables
D) All of the above are correct.
Unlock Deck
Unlock for access to all 59 flashcards in this deck.
Unlock Deck
k this deck
29
Truncated range is best described as when…
A) the population's variability is smaller than that of the sample's.
B) the sample's variability is smaller than that of the population's.
C) the sample's range is limited because the population is skeweed
D) the correlation coefficient overestimates the true population value.
A) the population's variability is smaller than that of the sample's.
B) the sample's variability is smaller than that of the population's.
C) the sample's range is limited because the population is skeweed
D) the correlation coefficient overestimates the true population value.
Unlock Deck
Unlock for access to all 59 flashcards in this deck.
Unlock Deck
k this deck
30
When a truncated range occurs, which of the following is a likely result?
A) The coefficient of determination is larger than the true value.
B) The correlation coefficient tends to over-estimate the true population value.
C) The correlation coefficient tends to under-estimated the true population value.
D) The correlation is more likely to be statistically significant.
A) The coefficient of determination is larger than the true value.
B) The correlation coefficient tends to over-estimate the true population value.
C) The correlation coefficient tends to under-estimated the true population value.
D) The correlation is more likely to be statistically significant.
Unlock Deck
Unlock for access to all 59 flashcards in this deck.
Unlock Deck
k this deck
31
Which of the following is false of possible hidden variables in correlations?
A) Hidden variables can be the true cause of an outcome
B) The effects of hidden variables can always be controlled and fully accounted for after the data have been collected.
C) When hidden variables exist, they can either be directly or indirectly associated with the target variable.
D) All of the above are true.
Unlock Deck
Unlock for access to all 59 flashcards in this deck.
Unlock Deck
k this deck
32
Which of the following best describes the relationship between statistics and causality?
A) The method and statistic play equal roles in determining whether causal relationships are established.
B) The statistic is the most important piece of information that determines whether causality can be inferred.
C) The method is more important than the statistic for determining a causal relationship
D) Causality has to do with sample size, but not the method or statistic. If you have the entire population's data, the results are always causal.
Unlock Deck
Unlock for access to all 59 flashcards in this deck.
Unlock Deck
k this deck
33
Which of the following statements best describes the coefficient of determination?
A) It is a number constrained between -1.00 and 1.00
B) It is a number that varies from 0 to positive infinity
C) It is a number between 0 and 1.00
D) It is a percentage that represents the proportion of error variance explained by your independent variable.
A) It is a number constrained between -1.00 and 1.00
B) It is a number that varies from 0 to positive infinity
C) It is a number between 0 and 1.00
D) It is a percentage that represents the proportion of error variance explained by your independent variable.
Unlock Deck
Unlock for access to all 59 flashcards in this deck.
Unlock Deck
k this deck
34
If you have a correlation coefficient of r = -.60, then your coefficient of determination should be…
A) 1.20
B) -.36
C) .36
D) -.30
A) 1.20
B) -.36
C) .36
D) -.30
Unlock Deck
Unlock for access to all 59 flashcards in this deck.
Unlock Deck
k this deck
35
How many possible correlation coefficients could result in a coefficient of determination of exactly .49?
A) 1
B) 2
C) 3
D) 4
A) 1
B) 2
C) 3
D) 4
Unlock Deck
Unlock for access to all 59 flashcards in this deck.
Unlock Deck
k this deck
36
If two variables are perfectly negatively correlated, their coefficient of determination would be…
A) -1.00
B) 1.00
C) 0.00
D) .50
A) -1.00
B) 1.00
C) 0.00
D) .50
Unlock Deck
Unlock for access to all 59 flashcards in this deck.
Unlock Deck
k this deck
37
In a correlational dataset, if the coefficient of determination is positive, then…
A) The correlation from which the coefficient of determination was calculated is always positive
B) The correlation from which the coefficient of determination was calculated is always negative
C) There is insufficient information to know whether the correlation is positive or negative
D) The correlation from which the coefficient of determination was calculated can be positive or negative.
Unlock Deck
Unlock for access to all 59 flashcards in this deck.
Unlock Deck
k this deck
38
In a regression analysis, b refers to
A) the y-axis intercept
B) the slope of the regression line
C) the predicted y value
D) the residuals
A) the y-axis intercept
B) the slope of the regression line
C) the predicted y value
D) the residuals
Unlock Deck
Unlock for access to all 59 flashcards in this deck.
Unlock Deck
k this deck
39
A quadratic relationship differs from a linear relationship in that…
A) the line for a linear relationship changes direction once, but for quadratic relationships the line changes direction twice.
B) The two types of relationships have lines that change directions different amounts of times. But both should be analyzed by a Pearson correlation.
C) The line for a linear relationship never changes direction, but for quadratic relationships the line changes direction once.
D) None of the above.
Unlock Deck
Unlock for access to all 59 flashcards in this deck.
Unlock Deck
k this deck
40
Which of the following demonstrates truncated range?
A) A researcher who is interested in IQ but only being able to recruit college students from elite private schools.
B) A researcher interested in personality, and collects data from the full range of socioeconomic status.
C) A researcher who is interested in the development of working memory across childhood during elementary, and recruits a large sample of 2nd graders.
D) a and c only.
Unlock Deck
Unlock for access to all 59 flashcards in this deck.
Unlock Deck
k this deck
41
When two variables have a coefficient of determination of .78, it suggests that…
A) One variable has a 78% chance of causing the other variable.
B) The two variables share 78% variance
C) The two variables have a correlation of .78
D) The two variables have a regression line that has a slope of .78
A) One variable has a 78% chance of causing the other variable.
B) The two variables share 78% variance
C) The two variables have a correlation of .78
D) The two variables have a regression line that has a slope of .78
Unlock Deck
Unlock for access to all 59 flashcards in this deck.
Unlock Deck
k this deck
42
Which one of the following variables cannot be dichotomized?
A) age of participant
B) reaction time in milliseconds
C) favorite type of soda
D) Number of coffees consumed per day
A) age of participant
B) reaction time in milliseconds
C) favorite type of soda
D) Number of coffees consumed per day
Unlock Deck
Unlock for access to all 59 flashcards in this deck.
Unlock Deck
k this deck
43
The theoretical correlation of the population between two variables is denoted by…
A) r2
B) r
C) ρ
D) b
A) r2
B) r
C) ρ
D) b
Unlock Deck
Unlock for access to all 59 flashcards in this deck.
Unlock Deck
k this deck
44
Based on Galton's work, which of the following types of graphs would you expect to be most useful to plot a correlation between two variables?
A) scatterplot
B) bar chart
C) pie chart
D) histogram
A) scatterplot
B) bar chart
C) pie chart
D) histogram
Unlock Deck
Unlock for access to all 59 flashcards in this deck.
Unlock Deck
k this deck
45
Even though researchers use regressions to predict outcomes, this does not mean that there is a(n) _____________.
A) correlation
B) causal effect
C) association
D) relationship
A) correlation
B) causal effect
C) association
D) relationship
Unlock Deck
Unlock for access to all 59 flashcards in this deck.
Unlock Deck
k this deck
46
Does money buy happiness? A research collected data on how much individuals spent for the holidays, and how satisfied they were with their holiday season, overall. Below are the data:
calculate the correlation
calculate the correlation Unlock Deck
Unlock for access to all 59 flashcards in this deck.
Unlock Deck
k this deck
47
Does money buy happiness? A research collected data on how much individuals spent for the holidays, and how satisfied they were with their holiday season, overall. Below are the data:
how many degrees of freedom are there for the test?
how many degrees of freedom are there for the test? Unlock Deck
Unlock for access to all 59 flashcards in this deck.
Unlock Deck
k this deck
48
Does money buy happiness? A research collected data on how much individuals spent for the holidays, and how satisfied they were with their holiday season, overall. Below are the data:
is the result significant at alpha = .05?
is the result significant at alpha = .05? Unlock Deck
Unlock for access to all 59 flashcards in this deck.
Unlock Deck
k this deck
49
Do high school grades predict college academic success? Below are data collected from some recent college graduates.
What is the correlation?
What is the correlation? Unlock Deck
Unlock for access to all 59 flashcards in this deck.
Unlock Deck
k this deck
50
Do high school grades predict college academic success? Below are data collected from some recent college graduates.
How many degrees of freedom are there?
How many degrees of freedom are there? Unlock Deck
Unlock for access to all 59 flashcards in this deck.
Unlock Deck
k this deck
51
Do high school grades predict college academic success? Below are data collected from some recent college graduates.
is the test significant at the alpha = .05 leve? What about the .01 level?
is the test significant at the alpha = .05 leve? What about the .01 level? Unlock Deck
Unlock for access to all 59 flashcards in this deck.
Unlock Deck
k this deck
52
Do high school grades predict college academic success? Below are data collected from some recent college graduates.
What is the regression coefficient for the prediction?
What is the regression coefficient for the prediction? Unlock Deck
Unlock for access to all 59 flashcards in this deck.
Unlock Deck
k this deck
53
Do high school grades predict college academic success? Below are data collected from some recent college graduates.
What is the coefficient of determination?
What is the coefficient of determination? Unlock Deck
Unlock for access to all 59 flashcards in this deck.
Unlock Deck
k this deck
54
Is a person's degree of extraversion a predictor of romantic partners? Below are normed data on individuals' degree of extraversion and the number of partners they've had.
What is the correlation?
What is the correlation? Unlock Deck
Unlock for access to all 59 flashcards in this deck.
Unlock Deck
k this deck
55
Is a person's degree of extraversion a predictor of romantic partners? Below are normed data on individuals' degree of extraversion and the number of partners they've had.
How many degrees of freedom are there in this test?
How many degrees of freedom are there in this test? Unlock Deck
Unlock for access to all 59 flashcards in this deck.
Unlock Deck
k this deck
56
Is a person's degree of extraversion a predictor of romantic partners? Below are normed data on individuals' degree of extraversion and the number of partners they've had.
Is the correlation statistically significant at alpha = .05?
Is the correlation statistically significant at alpha = .05? Unlock Deck
Unlock for access to all 59 flashcards in this deck.
Unlock Deck
k this deck
57
Is a person's degree of extraversion a predictor of romantic partners? Below are normed data on individuals' degree of extraversion and the number of partners they've had.
identify a potential hidden variable that may explain the variable that the researcher failed to take into account
identify a potential hidden variable that may explain the variable that the researcher failed to take into account Unlock Deck
Unlock for access to all 59 flashcards in this deck.
Unlock Deck
k this deck
58
Why is truncated range a problem when conducting correlational research?
Unlock Deck
Unlock for access to all 59 flashcards in this deck.
Unlock Deck
k this deck
59
What is the phenomenon: Regression to the mean?
Unlock Deck
Unlock for access to all 59 flashcards in this deck.
Unlock Deck
k this deck
Unlock Deck
Unlock for access to all 59 flashcards in this deck.


