Deck 4: Spatial Analysis
Full screen (f)
Question
Question
Question
Question
Question
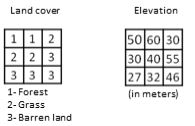
Addition of two rasters: 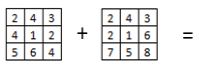
A) 31 + 38
B)
C)
D)
A) 31 + 38
B)
C)
D)
Question
A)

B)

C)

D)

Question
Question
 In the output layer, 1 represents
A) forest
B) park
C) forest in the park
D) park outside the forest
E) forest outside the park
Question
 The above operation is similar to
A) vector overlay with 'intersect' operator
B) vector overlay with 'union' operator
C) vector overlay with 'Identity' operator
Question
We have a layer representing rivers and another layer representing septic tanks on farm properties. We would like to identify which septic tanks are located within the 200m riparian zones. Which model should we use?
A)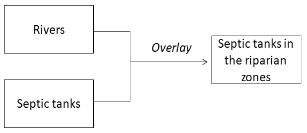
B)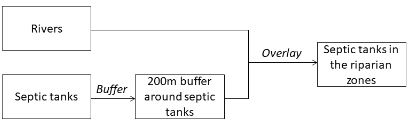
C)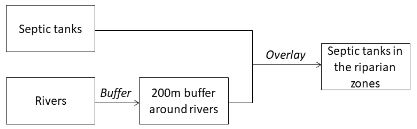
D)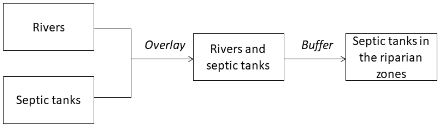
A)
B)
C)
D)
Question
We have two rasters:
 Which mathematical operator can be used to overlay them in order to produce meaningful results?
A) addition
B) multiplication
C) AND
D) IF…THEN…
Which mathematical operator can be used to overlay them in order to produce meaningful results?A) addition
B) multiplication
C) AND
D) IF…THEN…
Question
Question
Question
In the following model, what is the missing GIS operation? 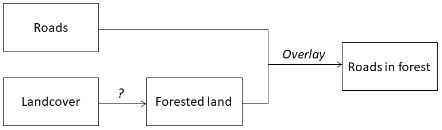
A) reclassify
B) buffer
C) polygon-on-polygon overlay
D) none of the above
A) reclassify
B) buffer
C) polygon-on-polygon overlay
D) none of the above
Question
Question
Question
Question
Below are cross sections of a terrain surface. The dots represent sampled points, the dotted line represents the cross section of the real terrain surface, and the solid lines represent cross sections of the interpolated surfaces. Which solid line more likely represents the cross section of the surface interpolated using IDW?
A)
B)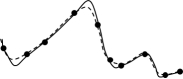
C)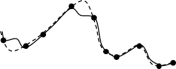
A)
B)
C)
Question
Question
Question
Question
Question
Question
Question
Kriging uses the following equation to calculate interpolated values.
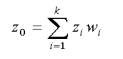 The weight wi depends on
A) a fitted curve to the semivariogram constructed with the sampled points
B) the distance to the prediction location from the neighbouring sampled points
C) the spatial correlation between the sampled points and the prediction location
D) all the above
The weight wi depends onA) a fitted curve to the semivariogram constructed with the sampled points
B) the distance to the prediction location from the neighbouring sampled points
C) the spatial correlation between the sampled points and the prediction location
D) all the above
Question
Question
Question

Unlock Deck
Sign up to unlock the cards in this deck!
Unlock Deck
Unlock Deck
1/28
Play
Full screen (f)
Deck 4: Spatial Analysis
1
To examine which crops grow on which types of soil based on an agricultural land use and a soil map, you should apply
A) polygon-on-polygon overlay
B) point-in-polygon overlay
C) line-in-polygon overlay
A) polygon-on-polygon overlay
B) point-in-polygon overlay
C) line-in-polygon overlay
A
2
To delineate a 200m riparian zone for water quality protection, which of the following GIS operations will be used?
A) overlay
B) spatial query
C) intersect
D) buffer
A) overlay
B) spatial query
C) intersect
D) buffer
D
3
To answer the question of 'how many meteorological stations are in forested areas?', which type of GIS operations is appropriate?
A) proximity
B) buffer
C) polygon-on-polygon overlay
D) point-in-polygon overlay
A) proximity
B) buffer
C) polygon-on-polygon overlay
D) point-in-polygon overlay
D
4
Raster overlay is more commonly used than vector overlay for environmental modelling, because
A) raster overlay is more accurate
B) raster overlay can use arithmetic operators, while vector overlay cannot
C) raster overlay is computationally simpler and easier to implement
D) raster overlay involves many data layers, while vector overlay can only combine two data layers
A) raster overlay is more accurate
B) raster overlay can use arithmetic operators, while vector overlay cannot
C) raster overlay is computationally simpler and easier to implement
D) raster overlay involves many data layers, while vector overlay can only combine two data layers
Unlock Deck
Unlock for access to all 28 flashcards in this deck.
Unlock Deck
k this deck
5
Addition of two rasters:
A) 31 + 38
B)
C)
D)
A) 31 + 38
B)
C)
D)
Unlock Deck
Unlock for access to all 28 flashcards in this deck.
Unlock Deck
k this deck
6
A)
B)
C)
D)
Unlock Deck
Unlock for access to all 28 flashcards in this deck.
Unlock Deck
k this deck
7
Map algebra is used to build mathematical models with
A) vector data
B) raster data
C) both vector and raster data
A) vector data
B) raster data
C) both vector and raster data
Unlock Deck
Unlock for access to all 28 flashcards in this deck.
Unlock Deck
k this deck
8
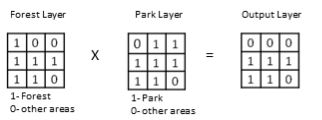
In the output layer, 1 representsA) forest
B) park
C) forest in the park
D) park outside the forest
E) forest outside the park
Unlock Deck
Unlock for access to all 28 flashcards in this deck.
Unlock Deck
k this deck
9
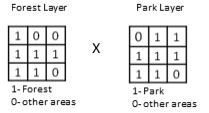
The above operation is similar toA) vector overlay with 'intersect' operator
B) vector overlay with 'union' operator
C) vector overlay with 'Identity' operator
Unlock Deck
Unlock for access to all 28 flashcards in this deck.
Unlock Deck
k this deck
10
We have a layer representing rivers and another layer representing septic tanks on farm properties. We would like to identify which septic tanks are located within the 200m riparian zones. Which model should we use?
A)
B)
C)
D)
A)
B)
C)
D)
Unlock Deck
Unlock for access to all 28 flashcards in this deck.
Unlock Deck
k this deck
11
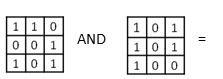
We have two rasters:
Which mathematical operator can be used to overlay them in order to produce meaningful results?
A) addition
B) multiplication
C) AND
D) IF…THEN…
Which mathematical operator can be used to overlay them in order to produce meaningful results?A) addition
B) multiplication
C) AND
D) IF…THEN…
Unlock Deck
Unlock for access to all 28 flashcards in this deck.
Unlock Deck
k this deck
12
A distance surface map (e.g., the proximity to a nuclear waste disposal facility) can be used to produce a buffer map (e.g., a 1km buffer around the disposal facility) by applying
A) reclassify
B) overlay
C) buffer
A) reclassify
B) overlay
C) buffer
Unlock Deck
Unlock for access to all 28 flashcards in this deck.
Unlock Deck
k this deck
13
Cost distance can be weighted by
A) cost measured in dollars
B) cost measured in time
C) topography
D) land cover
E) any of the above
A) cost measured in dollars
B) cost measured in time
C) topography
D) land cover
E) any of the above
Unlock Deck
Unlock for access to all 28 flashcards in this deck.
Unlock Deck
k this deck
14
In the following model, what is the missing GIS operation?
A) reclassify
B) buffer
C) polygon-on-polygon overlay
D) none of the above
A) reclassify
B) buffer
C) polygon-on-polygon overlay
D) none of the above
Unlock Deck
Unlock for access to all 28 flashcards in this deck.
Unlock Deck
k this deck
15
Spatial interpolation is
A) the procedure of combining one or more data ranges into a new data range to create a new data layer
B) the procedure of establishing a relationship between two spatially correlated environmental variables
C) the procedure of estimating values at unsampled locations within an area covered by an existing set of discrete observations or samples
D) the procedure of determining which sampled points lie within the boundary of an area feature
Unlock Deck
Unlock for access to all 28 flashcards in this deck.
Unlock Deck
k this deck
16
Spatial interpolation is a method for creating surfaces to approximate spatial distributions of environmental phenomena based on point observations
Unlock Deck
Unlock for access to all 28 flashcards in this deck.
Unlock Deck
k this deck
17
A smaller power value in IDW results in a smoother surface
Unlock Deck
Unlock for access to all 28 flashcards in this deck.
Unlock Deck
k this deck
18
Below are cross sections of a terrain surface. The dots represent sampled points, the dotted line represents the cross section of the real terrain surface, and the solid lines represent cross sections of the interpolated surfaces. Which solid line more likely represents the cross section of the surface interpolated using IDW?
A)
B)
C)
A)
B)
C)
Unlock Deck
Unlock for access to all 28 flashcards in this deck.
Unlock Deck
k this deck
19
Low-order trend surfaces are not good for modelling
A) air pollution over an industrial area
B) soil pH values
C) terrain surfaces with low variability in elevation
D) terrain surfaces with high variability in elevation
A) air pollution over an industrial area
B) soil pH values
C) terrain surfaces with low variability in elevation
D) terrain surfaces with high variability in elevation
Unlock Deck
Unlock for access to all 28 flashcards in this deck.
Unlock Deck
k this deck
20
With which of the following weight values (τ), does a regularised spline produce a smoother surface?
A) 0.001
B) 0.01
C) 0.1
D) 0.5
A) 0.001
B) 0.01
C) 0.1
D) 0.5
Unlock Deck
Unlock for access to all 28 flashcards in this deck.
Unlock Deck
k this deck
21
With which of the following weight values (φ), does a spline with tension produce a smoother surface?
A) 0
B) 1
C) 5
D) 10
A) 0
B) 1
C) 5
D) 10
Unlock Deck
Unlock for access to all 28 flashcards in this deck.
Unlock Deck
k this deck
22
Kriging assumes that the variation in a surface consists of three components, which are
A) location, attribute and time
B) distance, direction and height
C) spatial correlation, a drift and random errors
D) range, sill and nugget
A) location, attribute and time
B) distance, direction and height
C) spatial correlation, a drift and random errors
D) range, sill and nugget
Unlock Deck
Unlock for access to all 28 flashcards in this deck.
Unlock Deck
k this deck
23
In kriging, semivariance is a function of
A) coordinates of the point being estimated
B) distance between sample points
C) distance between the lowest sample point and the highest sample point
D) distance between the point being estimated and each of the sample points
A) coordinates of the point being estimated
B) distance between sample points
C) distance between the lowest sample point and the highest sample point
D) distance between the point being estimated and each of the sample points
Unlock Deck
Unlock for access to all 28 flashcards in this deck.
Unlock Deck
k this deck
24
The purpose of fitting a semivariogram with a mathematical curve is to
A) estimate the trend of the surface
B) estimate the random errors in spatial variations in the surface
C) estimate the value at an unknown location
D) estimate the semivariance at every possible distance
A) estimate the trend of the surface
B) estimate the random errors in spatial variations in the surface
C) estimate the value at an unknown location
D) estimate the semivariance at every possible distance
Unlock Deck
Unlock for access to all 28 flashcards in this deck.
Unlock Deck
k this deck
25
Kriging uses the following equation to calculate interpolated values.
The weight wi depends on
A) a fitted curve to the semivariogram constructed with the sampled points
B) the distance to the prediction location from the neighbouring sampled points
C) the spatial correlation between the sampled points and the prediction location
D) all the above
The weight wi depends onA) a fitted curve to the semivariogram constructed with the sampled points
B) the distance to the prediction location from the neighbouring sampled points
C) the spatial correlation between the sampled points and the prediction location
D) all the above
Unlock Deck
Unlock for access to all 28 flashcards in this deck.
Unlock Deck
k this deck
26
If you cannot give a scientific justification to describe a trend in your data, which kriging should you use?
A) ordinary kriging
B) universal kriging
A) ordinary kriging
B) universal kriging
Unlock Deck
Unlock for access to all 28 flashcards in this deck.
Unlock Deck
k this deck
27
IDW, second-order trend surface, regularised spline and spline with tension were used to interpolate surfaces based on the same set of sample points. The RMSE errors generated by IDW, second-order trend surface, regularised spline and spline with tension are respectively 0.87, 1.72, 1.01 and 0.99. Which interpolation method produced the best results?
A) IDW
B) second-order trend surface
C) regularised spline
D) spline with tension
A) IDW
B) second-order trend surface
C) regularised spline
D) spline with tension
Unlock Deck
Unlock for access to all 28 flashcards in this deck.
Unlock Deck
k this deck
28
In order to minimise edge effects in spatial interpolation, you should
A) not define the boundary of your study area
B) obtain additional sample data points outside your study area
C) increase the density of sampled points in your study area
D) improve the accuracy of sampled point data in your study area
A) not define the boundary of your study area
B) obtain additional sample data points outside your study area
C) increase the density of sampled points in your study area
D) improve the accuracy of sampled point data in your study area
Unlock Deck
Unlock for access to all 28 flashcards in this deck.
Unlock Deck
k this deck
Unlock Deck
Unlock for access to all 28 flashcards in this deck.


