Deck 22: Economic Growth
Full screen (f)
Question
Question
Question
Question
Question
Question
Question
Question
Question
Question
Question
Question
Question
Question
Question
Question
Question
Question
Question
Question
Question
Question
Question
Question
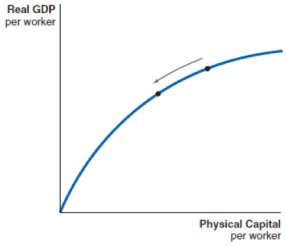
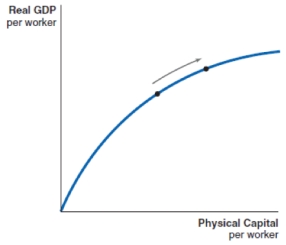
The figure shows three different production functions. The law of diminishing returns can be seen in which of the following movements in the figure?

A)point C to point E
B)point E to point C
C)point C to point D
D)point A to point C
A)point C to point E
B)point E to point C
C)point C to point D
D)point A to point C
Question
Question
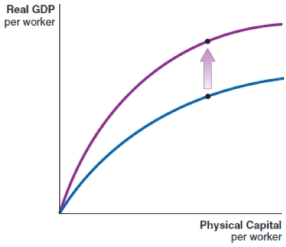
Technological advancement can be shown by which of these production functions?
A)

B)
C)

D)
A)
B)
C)
D)
Question
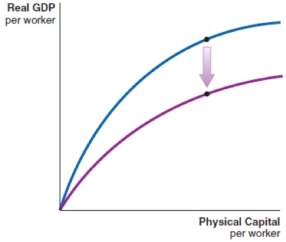
A negative shock causes a decrease in the level of technology in a country. Which of the following production functions shows the impact of this shock?
A)
B)

C)
D)

A)
B)
C)
D)
Question
Question
Question
Question
Question
Question
Question
Question
Question
Question
Question
Question
Question
Question
Question
Question
Question
Question
Question
Question
Question
Question
Question
Question
Question
Question
Question
Question
Question
Question
Question
Question
Question
Question
Question
Question
Question
Question
Question
Question
Question
Question
Question
Question
Question
Question
Question
Question
Question
Question
Question
Question
Question

Unlock Deck
Sign up to unlock the cards in this deck!
Unlock Deck
Unlock Deck
1/137
Play
Full screen (f)
Deck 22: Economic Growth
1
Economic growth in a country leads to:
(i) an increase in life expectancy.
(ii) an increase in real GDP in the economy.
(iii) a decrease in real income per person.
(iv) an increase in average mortality rates.
A)(i) and (ii)
B)(ii) and (iv)
C)(ii) and (iii)
D)(ii) only
(i) an increase in life expectancy.
(ii) an increase in real GDP in the economy.
(iii) a decrease in real income per person.
(iv) an increase in average mortality rates.
A)(i) and (ii)
B)(ii) and (iv)
C)(ii) and (iii)
D)(ii) only
A
2
The Industrial Revolution led to:
(i) increased intellectual pursuits.
(ii) increased production of food.
(iii) economic growth.
(iv) a rise in inventions.
A)(iii) only
B)(i) and (ii)
C)(iii) and (iv)
D)(i), (ii), (iii), and (iv)
(i) increased intellectual pursuits.
(ii) increased production of food.
(iii) economic growth.
(iv) a rise in inventions.
A)(iii) only
B)(i) and (ii)
C)(iii) and (iv)
D)(i), (ii), (iii), and (iv)
D
3
A production function is:
A)the amount of money generated from selling outputs.
B)a method through which inputs can be turned into outputs, given the available resources.
C)a method by which outputs can be recycled to produce inputs.
D)the sum of total production possibilities, if resources were unlimited.
A)the amount of money generated from selling outputs.
B)a method through which inputs can be turned into outputs, given the available resources.
C)a method by which outputs can be recycled to produce inputs.
D)the sum of total production possibilities, if resources were unlimited.
B
4
Which of the following scenarios shows a production function at work?
A)You write a personal letter to your family.
B)You go to Home Depot and buy some paint.
C)You buy flour and eggs and bake a cake to sell in your bakery.
D)You go to the library and read a book.
A)You write a personal letter to your family.
B)You go to Home Depot and buy some paint.
C)You buy flour and eggs and bake a cake to sell in your bakery.
D)You go to the library and read a book.
Unlock Deck
Unlock for access to all 137 flashcards in this deck.
Unlock Deck
k this deck
5
The U.S. government provides a research and development tax credit. How can this policy encourage economic growth?
A)Firms get tax credits for sourcing inputs locally, and this encourages local economic growth.
B)It encourages firms to engage in innovation and creative practices, which lead to technological advances that spur economic growth.
C)It supports firms in their efforts to produce environmentally friendly products and services.
D)Firms are encouraged to reuse existing capital, and this leads to a more efficient use of existing capital.
Unlock Deck
Unlock for access to all 137 flashcards in this deck.
Unlock Deck
k this deck
6
Human capital refers to:
A)worker skills and knowledge.
B)work done by machinery.
C)machines that have artificial intelligence.
D)money earned by workers in businesses.
A)worker skills and knowledge.
B)work done by machinery.
C)machines that have artificial intelligence.
D)money earned by workers in businesses.
Unlock Deck
Unlock for access to all 137 flashcards in this deck.
Unlock Deck
k this deck
7
In Canada, the Ontario government provides a tax credit to firms that spend on scientific research and experimental development. This tax credit will:
A)shift these firms' production functions upward through innovation and creative ideas.
B)reduce the amount of money firms spend on research and development.
C)increase the marginal cost of producing each unit of output.
D)shift these firms' production functions downward by the amount of the tax credit.
Unlock Deck
Unlock for access to all 137 flashcards in this deck.
Unlock Deck
k this deck
8
Physical capital refers to:
A)the money available for purchasing tools and machinery.
B)workers who work in fixed production lines.
C)workers in factories.
D)tools, machinery, and structures.
A)the money available for purchasing tools and machinery.
B)workers who work in fixed production lines.
C)workers in factories.
D)tools, machinery, and structures.
Unlock Deck
Unlock for access to all 137 flashcards in this deck.
Unlock Deck
k this deck
9
The aggregate production function connects:
A)products to the sales revenue they generate.
B)the output from machinery to the use of labor.
C)GDP to labor, human capital, and physical capital.
D)inputs of physical capital to outputs of human capital.
A)products to the sales revenue they generate.
B)the output from machinery to the use of labor.
C)GDP to labor, human capital, and physical capital.
D)inputs of physical capital to outputs of human capital.
Unlock Deck
Unlock for access to all 137 flashcards in this deck.
Unlock Deck
k this deck
10
Along the same aggregate production function, the level of _____ is the same.
A)economic growth
B)capital
C)labor
D)technology
A)economic growth
B)capital
C)labor
D)technology
Unlock Deck
Unlock for access to all 137 flashcards in this deck.
Unlock Deck
k this deck
11
The aggregate production function is represented as:
A)Y = f(L, H, K).
B)K = f(L, H, Y).
C)L = f(Y, H, K).
D)H = f(L, Y, K).
A)Y = f(L, H, K).
B)K = f(L, H, Y).
C)L = f(Y, H, K).
D)H = f(L, Y, K).
Unlock Deck
Unlock for access to all 137 flashcards in this deck.
Unlock Deck
k this deck
12
The aggregate production function Y = f(L, H, K) shows that economic growth can occur if:
(i) more labor is employed.
(ii) human capital is reduced.
(iii) the dependency ratio rises.
(iv) the capital stock stays constant.
A)(i) only
B)(i) and (iv)
C)(i), (ii), (iii), and (iv)
D)(iii) only
(i) more labor is employed.
(ii) human capital is reduced.
(iii) the dependency ratio rises.
(iv) the capital stock stays constant.
A)(i) only
B)(i) and (iv)
C)(i), (ii), (iii), and (iv)
D)(iii) only
Unlock Deck
Unlock for access to all 137 flashcards in this deck.
Unlock Deck
k this deck
13
The aggregate production function Y = f(L, H, K) shows that economic growth can occur if:
(i) labor force participation rates fall.
(ii) human capital stays constant.
(iii) education and worker skills improve.
(iv) the depreciation rate increases.
A)(i) only
B)(i) and (iv)
C)(i), (ii), (iii), and (iv)
D)(iii) only
(i) labor force participation rates fall.
(ii) human capital stays constant.
(iii) education and worker skills improve.
(iv) the depreciation rate increases.
A)(i) only
B)(i) and (iv)
C)(i), (ii), (iii), and (iv)
D)(iii) only
Unlock Deck
Unlock for access to all 137 flashcards in this deck.
Unlock Deck
k this deck
14
The aggregate production function Y = f(L, H, K) shows that economic growth can occur if:
(i) human capital increases.
(ii) labor productivity falls.
(iii) the capital stock in the country depreciates.
(iv) the depreciation rate increases.
A)(i) only
B)(i) and (iv)
C)(i), (ii), (iii), and (iv)
D)(iii) only
(i) human capital increases.
(ii) labor productivity falls.
(iii) the capital stock in the country depreciates.
(iv) the depreciation rate increases.
A)(i) only
B)(i) and (iv)
C)(i), (ii), (iii), and (iv)
D)(iii) only
Unlock Deck
Unlock for access to all 137 flashcards in this deck.
Unlock Deck
k this deck
15
Which of the following would lead to a slowdown in economic growth?
A)a reduction in the birth rate coupled with an increase in the retirement rate of a population
B)an increase in innovation in the economy
C)an increase in capital accumulation coupled with technological advancement
D)the institution of a savings tax credit
A)a reduction in the birth rate coupled with an increase in the retirement rate of a population
B)an increase in innovation in the economy
C)an increase in capital accumulation coupled with technological advancement
D)the institution of a savings tax credit
Unlock Deck
Unlock for access to all 137 flashcards in this deck.
Unlock Deck
k this deck
16
Which of the following would lead to a slowdown in economic growth?
A)an increase in capital accumulation in the economy
B)an increase in the dependency ratio
C)an increase in human capital
D)reduced inefficiency in production
A)an increase in capital accumulation in the economy
B)an increase in the dependency ratio
C)an increase in human capital
D)reduced inefficiency in production
Unlock Deck
Unlock for access to all 137 flashcards in this deck.
Unlock Deck
k this deck
17
If the standard of living rises in a country, we know that:
A)population in that country has increased.
B)real GDP per person has increased.
C)the cost of living has risen in the country.
D)the aggregate production function must have shifted upward.
A)population in that country has increased.
B)real GDP per person has increased.
C)the cost of living has risen in the country.
D)the aggregate production function must have shifted upward.
Unlock Deck
Unlock for access to all 137 flashcards in this deck.
Unlock Deck
k this deck
18
A rise in population in a country:
A)boosts real GDP but not necessarily real GDP per person.
B)always raises the standard of living in a country.
C)leads to an increase in the level of technology in an economy.
D)leads to a downward shift of the aggregate production function.
A)boosts real GDP but not necessarily real GDP per person.
B)always raises the standard of living in a country.
C)leads to an increase in the level of technology in an economy.
D)leads to a downward shift of the aggregate production function.
Unlock Deck
Unlock for access to all 137 flashcards in this deck.
Unlock Deck
k this deck
19
Which of the following would lead to a rise in economic growth?
A)an increase in female employment in an economy
B)an increase in the dependency ratio
C)a decrease in human capital
D)a decrease in the labor force participation rate in an economy
A)an increase in female employment in an economy
B)an increase in the dependency ratio
C)a decrease in human capital
D)a decrease in the labor force participation rate in an economy
Unlock Deck
Unlock for access to all 137 flashcards in this deck.
Unlock Deck
k this deck
20
A firm that prepares and mails customer notices on behalf of banks has recently shifted from manually addressing letters to using a computer program that automatically inserts customer addresses and prepares letters. Thus, the production time for each letter has decreased from four minutes to just 30 seconds. This scenario is an example of:
A)the effects of an investment tax credit.
B)a rise in productivity causing an improvement in technology.
C)an improvement in technology leading to a rise in productivity.
D)a labor-intensive production method.
A)the effects of an investment tax credit.
B)a rise in productivity causing an improvement in technology.
C)an improvement in technology leading to a rise in productivity.
D)a labor-intensive production method.
Unlock Deck
Unlock for access to all 137 flashcards in this deck.
Unlock Deck
k this deck
21
WinSun, a Chinese firm, began producing 3-D printed houses in late 2013. These houses were produced in a fraction of the time it would take to produce a house in the regular way and at a much lower cost. This is an example of:
A)an advance in technology leading to a rise in productivity.
B)a rise in productivity causing an advance in technology.
C)a movement to the left along the same production function.
D)a movement to the right along the same production function.
A)an advance in technology leading to a rise in productivity.
B)a rise in productivity causing an advance in technology.
C)a movement to the left along the same production function.
D)a movement to the right along the same production function.
Unlock Deck
Unlock for access to all 137 flashcards in this deck.
Unlock Deck
k this deck
22
A government can promote the development of human capital by:
A)placing caps on salaries for teachers.
B)promoting programs that encourage late retirement from work.
C)subsidizing secondary school education.
D)providing savings tax credits.
A)placing caps on salaries for teachers.
B)promoting programs that encourage late retirement from work.
C)subsidizing secondary school education.
D)providing savings tax credits.
Unlock Deck
Unlock for access to all 137 flashcards in this deck.
Unlock Deck
k this deck
23
Which of the following explains the shape of the aggregate production function?
A)the profit maximization rule
B)the law of diminishing returns
C)the development of human capital
D)the impact of technological change
A)the profit maximization rule
B)the law of diminishing returns
C)the development of human capital
D)the impact of technological change
Unlock Deck
Unlock for access to all 137 flashcards in this deck.
Unlock Deck
k this deck
24
The figure shows three different production functions. The law of diminishing returns can be seen in which of the following movements in the figure?
A)point C to point E
B)point E to point C
C)point C to point D
D)point A to point C
A)point C to point E
B)point E to point C
C)point C to point D
D)point A to point C
Unlock Deck
Unlock for access to all 137 flashcards in this deck.
Unlock Deck
k this deck
25
The law of diminishing returns states that:
A)when all inputs are held constant, there is an upper limit to the amount of output that can be produced.
B)when one input is held constant, while other inputs are increased, eventually output will increase by smaller and smaller amounts.
C)the lower the level of human capital in an economy, the lower the economic growth rate.
D)the level of capital accumulation is directly related to the level of human capital in an economy.
Unlock Deck
Unlock for access to all 137 flashcards in this deck.
Unlock Deck
k this deck
26
Technological advancement can be shown by which of these production functions?
A)
B)
C)
D)
A)
B)
C)
D)
Unlock Deck
Unlock for access to all 137 flashcards in this deck.
Unlock Deck
k this deck
27
A negative shock causes a decrease in the level of technology in a country. Which of the following production functions shows the impact of this shock?
A)
B)
C)
D)
A)
B)
C)
D)
Unlock Deck
Unlock for access to all 137 flashcards in this deck.
Unlock Deck
k this deck
28
The table below shows data for Central African Republic (CAR). What was this country's real GDP per person in 2010?
A)$471.63
B)$336.93
C)$504.75
D)$487.95
A)$471.63
B)$336.93
C)$504.75
D)$487.95
Unlock Deck
Unlock for access to all 137 flashcards in this deck.
Unlock Deck
k this deck
29
The table below shows data for Central African Republic (CAR). What was the real GDP per person in 2012?
A)$487.95
B)$528.13
C)$504.75
D)$471.63
A)$487.95
B)$528.13
C)$504.75
D)$471.63
Unlock Deck
Unlock for access to all 137 flashcards in this deck.
Unlock Deck
k this deck
30
The table below shows data for Central African Republic (CAR). What was the economic growth rate between 2011 and 2012?
A)3.46%
B)3.44%
C)-36.20%
D)4.63%
A)3.46%
B)3.44%
C)-36.20%
D)4.63%
Unlock Deck
Unlock for access to all 137 flashcards in this deck.
Unlock Deck
k this deck
31
The table below shows data for Central African Republic (CAR). What was the economic growth rate between 2012 and 2013?
A)3.46%
B)3.44%
C)-36.20%
D)4.63%
A)3.46%
B)3.44%
C)-36.20%
D)4.63%
Unlock Deck
Unlock for access to all 137 flashcards in this deck.
Unlock Deck
k this deck
32
The table below shows data for Central African Republic (CAR). In which year, did this country experience a decline in the standard of living?
A)2010
B)2011
C)2012
D)2013
A)2010
B)2011
C)2012
D)2013
Unlock Deck
Unlock for access to all 137 flashcards in this deck.
Unlock Deck
k this deck
33
Refer to the table below, which shows data for Ireland. What was the economic growth rate in Ireland in 2010?
A)1.37%
B)3.27%
C)-8.35%
D)2.25%
A)1.37%
B)3.27%
C)-8.35%
D)2.25%
Unlock Deck
Unlock for access to all 137 flashcards in this deck.
Unlock Deck
k this deck
34
Refer to the table below, which shows data for Ireland. What was the economic growth rate in Ireland in 2009?
A)-6.33%
B)3.27%
C)-8.35%
D)-5.98%
A)-6.33%
B)3.27%
C)-8.35%
D)-5.98%
Unlock Deck
Unlock for access to all 137 flashcards in this deck.
Unlock Deck
k this deck
35
Refer to the table, which shows data for Ireland. Based only on the data in this table, in which year(s) did Ireland experience a fall in the standard of living?
A)2008 only
B)2008 and 2009
C)2011 only
D)2009 and 2010
A)2008 only
B)2008 and 2009
C)2011 only
D)2009 and 2010
Unlock Deck
Unlock for access to all 137 flashcards in this deck.
Unlock Deck
k this deck
36
Refer to the table below, which shows data for the United Arab Emirates (UAE). What was the economic growth rate in UAE in 2010?
A)-15.15%
B)2.26%
C)-11.27%
D)-5.91%
A)-15.15%
B)2.26%
C)-11.27%
D)-5.91%
Unlock Deck
Unlock for access to all 137 flashcards in this deck.
Unlock Deck
k this deck
37
Refer to the table below, which shows data for the United Arab Emirates (UAE). What was the economic growth rate in UAE in 2009?
A)-15.15%
B)2.26%
C)-11.27%
D)-5.91%
A)-15.15%
B)2.26%
C)-11.27%
D)-5.91%
Unlock Deck
Unlock for access to all 137 flashcards in this deck.
Unlock Deck
k this deck
38
Refer to the table below, which shows data for the United Arab Emirates (UAE). What was the economic growth rate in UAE in 2012?
A)-15.15%
B)2.26%
C)-11.27%
D)-5.91%
A)-15.15%
B)2.26%
C)-11.27%
D)-5.91%
Unlock Deck
Unlock for access to all 137 flashcards in this deck.
Unlock Deck
k this deck
39
Refer to the table below, which shows data for the United Arab Emirates (UAE). Based only on the data in this table, in which year(s) did the UAE experience a fall in the standard of living?
A)2008 only
B)2008 and 2009
C)2008, 2009, and 2010
D)2011 and 2012
A)2008 only
B)2008 and 2009
C)2008, 2009, and 2010
D)2011 and 2012
Unlock Deck
Unlock for access to all 137 flashcards in this deck.
Unlock Deck
k this deck
40
Refer to the table below, which shows data for the United Arab Emirates (UAE). Based only on the data in this table, in which year(s) did the UAE experience an increase in the standard of living?
A)2008 only
B)2008 and 2009
C)2008, 2009, and 2010
D)2011 and 2012
A)2008 only
B)2008 and 2009
C)2008, 2009, and 2010
D)2011 and 2012
Unlock Deck
Unlock for access to all 137 flashcards in this deck.
Unlock Deck
k this deck
41
The capital stock in an economy stops growing when:
A)investment equals depreciation.
B)savings increases in the economy.
C)depreciation reaches zero.
D)capital accumulation begins.
A)investment equals depreciation.
B)savings increases in the economy.
C)depreciation reaches zero.
D)capital accumulation begins.
Unlock Deck
Unlock for access to all 137 flashcards in this deck.
Unlock Deck
k this deck
42
The steady state in the Solow growth model occurs when:
A)depreciation reaches zero.
B)savings increases in the economy.
C)investment equals depreciation.
D)capital accumulation begins.
A)depreciation reaches zero.
B)savings increases in the economy.
C)investment equals depreciation.
D)capital accumulation begins.
Unlock Deck
Unlock for access to all 137 flashcards in this deck.
Unlock Deck
k this deck
43
New ideas can generate unlimited economic growth because they:
A)are exclusive to the inventor and can be patented.
B)can be freely shared, do not depreciate, and can generate further ideas.
C)are similar to physical capital.
D)cannot be replicated or copied.
A)are exclusive to the inventor and can be patented.
B)can be freely shared, do not depreciate, and can generate further ideas.
C)are similar to physical capital.
D)cannot be replicated or copied.
Unlock Deck
Unlock for access to all 137 flashcards in this deck.
Unlock Deck
k this deck
44
The U.S. Department of Education sponsors the i3 program (Investing in Innovation), which provides grants to educational institutions and schools that have a proven track record of high student achievement. This is an example of a government program designed to build:
A)physical capital.
B)labor resources.
C)human capital.
D)physical factories and plants.
A)physical capital.
B)labor resources.
C)human capital.
D)physical factories and plants.
Unlock Deck
Unlock for access to all 137 flashcards in this deck.
Unlock Deck
k this deck
45
The government of Ontario, Canada, has implemented a frontier college program that is designed to improve literacy and math skills among students who live in remote parts of Canada and in First Nations communities that are underserved by educational facilities. This is an example of a government program designed to build:
A)human capital.
B)regulatory oversight.
C)physical capital.
D)the capital stock.
A)human capital.
B)regulatory oversight.
C)physical capital.
D)the capital stock.
Unlock Deck
Unlock for access to all 137 flashcards in this deck.
Unlock Deck
k this deck
46
If a bakery buys a second oven, hires a second baker, buys double the number of ingredients, doubles the size of the bakery, and then produces double the number of cakes, then the bakery is experiencing:
A)technological advancement.
B)an increase in labor productivity.
C)constant returns to scale.
D)increasing returns to scale.
A)technological advancement.
B)an increase in labor productivity.
C)constant returns to scale.
D)increasing returns to scale.
Unlock Deck
Unlock for access to all 137 flashcards in this deck.
Unlock Deck
k this deck
47
A dressmaker's shop doubles in size, buys a second sewing machine, hires a second tailor, buys double the cloth, and then produces 90% more dresses than it did before. The dressmaker is experiencing:
A)technological advancement.
B)decreasing returns to scale.
C)constant returns to scale.
D)increasing returns to scale.
A)technological advancement.
B)decreasing returns to scale.
C)constant returns to scale.
D)increasing returns to scale.
Unlock Deck
Unlock for access to all 137 flashcards in this deck.
Unlock Deck
k this deck
48
A carpenter's shop doubles in size, buys twice the wood, hires a second carpenter, buys a second lathe, and then manages to produce 230% more furniture than it did before. The carpenter's shop is experiencing:
A)technological advancement.
B)decreasing returns to scale.
C)constant returns to scale.
D)increasing returns to scale.
A)technological advancement.
B)decreasing returns to scale.
C)constant returns to scale.
D)increasing returns to scale.
Unlock Deck
Unlock for access to all 137 flashcards in this deck.
Unlock Deck
k this deck
49
The government passes a new investment tax credit initiative. Which input in the production function changes, and what is the effect on economic growth in the country?
A)The capital stock increases, and economic growth is positively affected.
B)The capital stock decreases, and economic growth is negatively affected.
C)Human capital is enhanced, and economic growth is positively affected.
D)Technological advance occurs, but there is no effect on economic growth.
A)The capital stock increases, and economic growth is positively affected.
B)The capital stock decreases, and economic growth is negatively affected.
C)Human capital is enhanced, and economic growth is positively affected.
D)Technological advance occurs, but there is no effect on economic growth.
Unlock Deck
Unlock for access to all 137 flashcards in this deck.
Unlock Deck
k this deck
50
The government passes a new initiative to encourage savings in a country with a well-functioning banking system. Which input in the production function changes, and what is the effect on economic growth in the country?
A)Human capital is enhanced, and economic growth is positively affected.
B)The capital stock decreases, and economic growth is negatively affected.
C)The capital stock increases, and economic growth is positively affected.
D)Technological advance occurs, but there is no effect on economic growth.
A)Human capital is enhanced, and economic growth is positively affected.
B)The capital stock decreases, and economic growth is negatively affected.
C)The capital stock increases, and economic growth is positively affected.
D)Technological advance occurs, but there is no effect on economic growth.
Unlock Deck
Unlock for access to all 137 flashcards in this deck.
Unlock Deck
k this deck
51
The government passes a new initiative to provide a tax credit on research and innovation by firms. What is the impact on the production function, and what is the effect on economic growth in the country?
A)Human capital is enhanced, and economic growth is positively affected.
B)The capital stock decreases, and economic growth is negatively affected.
C)The capital stock increases, and economic growth is positively affected.
D)Technological advancement occurs, and economic growth occurs.
A)Human capital is enhanced, and economic growth is positively affected.
B)The capital stock decreases, and economic growth is negatively affected.
C)The capital stock increases, and economic growth is positively affected.
D)Technological advancement occurs, and economic growth occurs.
Unlock Deck
Unlock for access to all 137 flashcards in this deck.
Unlock Deck
k this deck
52
The government begins taxing savings in banks. Which input in the production function changes, and what is the effect on economic growth in the country?
A)Human capital is enhanced, and economic growth is positively affected.
B)Technological advance occurs, and economic growth occurs.
C)The capital stock increases, and economic growth is positively affected.
D)The capital stock decreases, and economic growth is negatively affected.
A)Human capital is enhanced, and economic growth is positively affected.
B)Technological advance occurs, and economic growth occurs.
C)The capital stock increases, and economic growth is positively affected.
D)The capital stock decreases, and economic growth is negatively affected.
Unlock Deck
Unlock for access to all 137 flashcards in this deck.
Unlock Deck
k this deck
53
The government removes an existing investment tax credit. Which input in the production function changes, and what is the effect on economic growth in the country?
A)Human capital is enhanced, and economic growth is positively affected.
B)The capital stock decreases, and economic growth is negatively affected.
C)The capital stock increases, and economic growth is positively affected.
D)Technological advance occurs, and economic growth occurs.
A)Human capital is enhanced, and economic growth is positively affected.
B)The capital stock decreases, and economic growth is negatively affected.
C)The capital stock increases, and economic growth is positively affected.
D)Technological advance occurs, and economic growth occurs.
Unlock Deck
Unlock for access to all 137 flashcards in this deck.
Unlock Deck
k this deck
54
The government begins to provide free secondary school education. Which input in the production function changes, and what is the effect on economic growth in the country?
A)Human capital is enhanced, and economic growth is positively affected.
B)The capital stock decreases, and economic growth is negatively affected.
C)The capital stock increases, and economic growth is positively affected.
D)Technological advance occurs, and economic growth occurs.
A)Human capital is enhanced, and economic growth is positively affected.
B)The capital stock decreases, and economic growth is negatively affected.
C)The capital stock increases, and economic growth is positively affected.
D)Technological advance occurs, and economic growth occurs.
Unlock Deck
Unlock for access to all 137 flashcards in this deck.
Unlock Deck
k this deck
55
The government begins to provide free primary school education. Which input in the production function changes, and what is the effect on economic growth in the country?
A)The capital stock increases, and economic growth is positively affected.
B)The capital stock decreases, and economic growth is negatively affected.
C)Human capital is enhanced, and economic growth is positively affected.
D)Technological advance occurs, and economic growth occurs.
A)The capital stock increases, and economic growth is positively affected.
B)The capital stock decreases, and economic growth is negatively affected.
C)Human capital is enhanced, and economic growth is positively affected.
D)Technological advance occurs, and economic growth occurs.
Unlock Deck
Unlock for access to all 137 flashcards in this deck.
Unlock Deck
k this deck
56
The government enacts regulation to institute enforceable property rights for business investment. Which input in the production function changes, and what is the effect on economic growth in the country?
A)Technology regresses, and economic growth stalls.
B)The capital stock decreases, and economic growth is negatively affected.
C)Human capital is enhanced, and economic growth is positively affected.
D)The capital stock increases, and economic growth is positively affected.
A)Technology regresses, and economic growth stalls.
B)The capital stock decreases, and economic growth is negatively affected.
C)Human capital is enhanced, and economic growth is positively affected.
D)The capital stock increases, and economic growth is positively affected.
Unlock Deck
Unlock for access to all 137 flashcards in this deck.
Unlock Deck
k this deck
57
Which of the following can be classified as technological progress?
A)a baby boom
B)the invention of the light bulb
C)an increase in the retirement age of a population
D)a rise in the labor force participation rate
A)a baby boom
B)the invention of the light bulb
C)an increase in the retirement age of a population
D)a rise in the labor force participation rate
Unlock Deck
Unlock for access to all 137 flashcards in this deck.
Unlock Deck
k this deck
58
Technological advancement is NOT represented by which of the following?
A)the invention of robotic meal preparation
B)the invention of the light bulb
C)the adoption of an existing technology by new firms
D)the creation of new apps designed to enhance efficiency and reduce wastage in production lines
A)the invention of robotic meal preparation
B)the invention of the light bulb
C)the adoption of an existing technology by new firms
D)the creation of new apps designed to enhance efficiency and reduce wastage in production lines
Unlock Deck
Unlock for access to all 137 flashcards in this deck.
Unlock Deck
k this deck
59
The Ethiopian government announces a plan to allow foreign firms to operate in the Ethiopian telecommunications industry. This is an example of:
A)increased savings.
B)economic growth.
C)new ideas.
D)foreign direct investment.
A)increased savings.
B)economic growth.
C)new ideas.
D)foreign direct investment.
Unlock Deck
Unlock for access to all 137 flashcards in this deck.
Unlock Deck
k this deck
60
Kia Motors announces a plan to produce Kia automobiles in Pakistan. How does this change economic growth in Pakistan?
A)Economic growth is negatively affected.
B)Economic growth increases due to an investment in education.
C)Economic growth increases due to an increase in labor.
D)Economic growth increases due to capital accumulation.
A)Economic growth is negatively affected.
B)Economic growth increases due to an investment in education.
C)Economic growth increases due to an increase in labor.
D)Economic growth increases due to capital accumulation.
Unlock Deck
Unlock for access to all 137 flashcards in this deck.
Unlock Deck
k this deck
61
In Malaysia, the Community Communications Development Program teaches computer literacy skills to people in rural communities, especially women. This initiative is an example of a project that will:
A)enhance human capital.
B)build capital stock.
C)increase the dependency ratio.
D)lower the capital stock over time.
A)enhance human capital.
B)build capital stock.
C)increase the dependency ratio.
D)lower the capital stock over time.
Unlock Deck
Unlock for access to all 137 flashcards in this deck.
Unlock Deck
k this deck
62
In many parts of the world, mobile health clinics travel to villages to treat patients, teach about good nutrition and hygiene, and carry out immunizations. How does this contribute to economic growth?
A)It leads to a convergence in real GDP per person.
B)It creates technological advancement in these villages.
C)It encourages capital accumulation in these villages.
D)It helps maintain a healthy population, which leads to development of the labor resource.
A)It leads to a convergence in real GDP per person.
B)It creates technological advancement in these villages.
C)It encourages capital accumulation in these villages.
D)It helps maintain a healthy population, which leads to development of the labor resource.
Unlock Deck
Unlock for access to all 137 flashcards in this deck.
Unlock Deck
k this deck
63
The catch-up effect would be largest in an economy where:
A)the initial level of capital is low.
B)the initial level of capital is high.
C)capital accumulation is significant.
D)foreign direct investment is not allowed.
A)the initial level of capital is low.
B)the initial level of capital is high.
C)capital accumulation is significant.
D)foreign direct investment is not allowed.
Unlock Deck
Unlock for access to all 137 flashcards in this deck.
Unlock Deck
k this deck
64
Property rights refer to:
A)the time it takes to start a business venture.
B)patents owned by a business.
C)control over a tangible or intangible resource.
D)the number of properties owned by an entrepreneur.
A)the time it takes to start a business venture.
B)patents owned by a business.
C)control over a tangible or intangible resource.
D)the number of properties owned by an entrepreneur.
Unlock Deck
Unlock for access to all 137 flashcards in this deck.
Unlock Deck
k this deck
65
Enforceable property rights encourage economic growth by encouraging:
A)investment.
B)the sale of property rights.
C)the growth of human capital.
D)depreciation.
A)investment.
B)the sale of property rights.
C)the growth of human capital.
D)depreciation.
Unlock Deck
Unlock for access to all 137 flashcards in this deck.
Unlock Deck
k this deck
66
Which of the following is an example of property rights leading to economic growth?
A)Business owners can own property, but governments can nationalize these properties at any time.
B)Farmers, who can own their own land, invest in hybrid seeds to increase crop yields.
C)Land is owned by the government, and farmers do not have ownership rights to farms.
D)Foreign direct investment is disallowed in an economy.
Unlock Deck
Unlock for access to all 137 flashcards in this deck.
Unlock Deck
k this deck
67
Which of the following is an example of regulatory institutions that protect property rights?
A)credit cards
B)courts of law
C)private businesses
D)government owned businesses
A)credit cards
B)courts of law
C)private businesses
D)government owned businesses
Unlock Deck
Unlock for access to all 137 flashcards in this deck.
Unlock Deck
k this deck
68
A group of people moves onto a forested piece of land (which has no established owner), cuts down all the trees, and acquires all the lumber on the land. Thereafter, the land is farmed until all the mineral properties of the soil are depleted. Ultimately, the land becomes a barren desert property. This is an example of:
A)a lack of established property rights leading to the depletion of a resource.
B)a lack of human capital leading to a depletion of a resource.
C)inadequate capital stock.
D)economic growth from agricultural innovation.
A)a lack of established property rights leading to the depletion of a resource.
B)a lack of human capital leading to a depletion of a resource.
C)inadequate capital stock.
D)economic growth from agricultural innovation.
Unlock Deck
Unlock for access to all 137 flashcards in this deck.
Unlock Deck
k this deck
69
Which of the following is an example of effective property rights leading to economic growth?
A)bad debts at a bank
B)patents
C)removal of fishing regulations on lakes and rivers
D)pirated distribution and copying of music
A)bad debts at a bank
B)patents
C)removal of fishing regulations on lakes and rivers
D)pirated distribution and copying of music
Unlock Deck
Unlock for access to all 137 flashcards in this deck.
Unlock Deck
k this deck
70
Rapid growth in poorer countries leads to:
A)convergence in real GDP per person between poorer countries and richer countries.
B)divergence in real GDP per person between poorer countries and richer countries.
C)inadequate enforcement of property rights.
D)higher dependency ratios.
A)convergence in real GDP per person between poorer countries and richer countries.
B)divergence in real GDP per person between poorer countries and richer countries.
C)inadequate enforcement of property rights.
D)higher dependency ratios.
Unlock Deck
Unlock for access to all 137 flashcards in this deck.
Unlock Deck
k this deck
71
Rapid growth in poorer countries leads to:
A)lower costs of production.
B)a reduction in inequality between poorer countries and richer countries.
C)skewed income distributions.
D)an overaccumulation of capital.
A)lower costs of production.
B)a reduction in inequality between poorer countries and richer countries.
C)skewed income distributions.
D)an overaccumulation of capital.
Unlock Deck
Unlock for access to all 137 flashcards in this deck.
Unlock Deck
k this deck
72
Why is literacy important for economic growth?
(i) Literacy develops human capital.
(ii) Innovation and the development of new ideas are enhanced by literacy.
(iii) The transfer of new ideas is enhanced by literacy.
(iv) Without a literate population, an economy will experience negative economic growth.
A)(i) only
B)(ii) and (iii)
C)(i), (ii), and (iii)
D)(i), (ii), (iii), and (iv)
Unlock Deck
Unlock for access to all 137 flashcards in this deck.
Unlock Deck
k this deck
73
Suppose a lake is overfished until the fish stock is depleted. This is an example of:
A)climate change.
B)inadequate labor as a resource.
C)improper use of fishing equipment.
D)a lack of established property rights.
A)climate change.
B)inadequate labor as a resource.
C)improper use of fishing equipment.
D)a lack of established property rights.
Unlock Deck
Unlock for access to all 137 flashcards in this deck.
Unlock Deck
k this deck
74
Refer to the table below that shows data for Panama. What was Panama's real GDP per person in the year 2000?
A)$5,493.64
B)$5,435.17
C)$5,558.09
D)$6,172.87
A)$5,493.64
B)$5,435.17
C)$5,558.09
D)$6,172.87
Unlock Deck
Unlock for access to all 137 flashcards in this deck.
Unlock Deck
k this deck
75
Refer to the table below that shows data for Panama. What was Panama's real GDP per person in the year 2002?
A)$5,493.64
B)$5,435.17
C)$5,558.09
D)$6,172.87
A)$5,493.64
B)$5,435.17
C)$5,558.09
D)$6,172.87
Unlock Deck
Unlock for access to all 137 flashcards in this deck.
Unlock Deck
k this deck
76
Refer to the table that shows data for Panama. What was Panama's real GDP per person in the year 2004?
A)$5,865.94
B)$5,435.17
C)$5,558.09
D)$5,419.11
A)$5,865.94
B)$5,435.17
C)$5,558.09
D)$5,419.11
Unlock Deck
Unlock for access to all 137 flashcards in this deck.
Unlock Deck
k this deck
77
Refer to the table below that shows data for Panama. What was Panama's economic growth rate between 2000 and 2001?
A)2.26%
B)-1.36%
C)-0.29%
D)5.23%
A)2.26%
B)-1.36%
C)-0.29%
D)5.23%
Unlock Deck
Unlock for access to all 137 flashcards in this deck.
Unlock Deck
k this deck
78
Refer to the table below that shows data for Panama. What was Panama's economic growth rate between 2001 and 2002?
A)2.26%
B)-1.36%
C)-0.29%
D)0.30%
A)2.26%
B)-1.36%
C)-0.29%
D)0.30%
Unlock Deck
Unlock for access to all 137 flashcards in this deck.
Unlock Deck
k this deck
79
Refer to the table below that shows data for Panama. What was Panama's economic growth rate between 2003 and 2004?
A)3.18%
B)0.29%
C)5.54%
D)5.23%
A)3.18%
B)0.29%
C)5.54%
D)5.23%
Unlock Deck
Unlock for access to all 137 flashcards in this deck.
Unlock Deck
k this deck
80
Consider the data in the table below. Which of the following statements is true?
A)During the years 2014 to 2018, Kenya's standard of living always exceeded Bangladesh's standard of living.
B)During the years 2014 to 2018, Kenya's economic growth rate always exceeded Bangladesh's economic growth rate.
C)By the year 2018, Bangladesh had caught up with Kenya in terms of standard of living.
D)Bangladesh's standard of living exceeded that of Kenya for the 2014 to 2017 time period.
Unlock Deck
Unlock for access to all 137 flashcards in this deck.
Unlock Deck
k this deck
Unlock Deck
Unlock for access to all 137 flashcards in this deck.


