Deck 2: Demand: Thinking Like a Buyer
Full screen (f)
Question
Question
Question
(Figure: Leonard's Demand for Pecan Pie) Look at Leonard's weekly demand curve for slices of pie. How many slices of pie is Leonard willing to buy at $3 per slice? 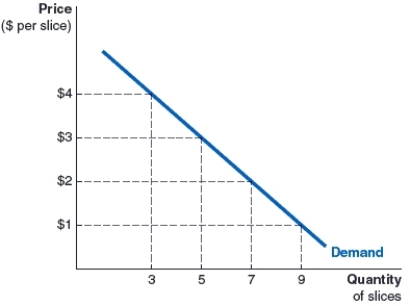
A)3 slices
B)9 slices
C)7 slices
D)5 slices
A)3 slices
B)9 slices
C)7 slices
D)5 slices
Question
(Figure: Leonard's Demand for Pecan Pie) Look at Leonard's weekly demand curve for slices of pie. How many slices of pie is Leonard willing to buy at $2 per slice? 
A)3 slices
B)9 slices
C)7 slices
D)5 slices
A)3 slices
B)9 slices
C)7 slices
D)5 slices
Question
(Figure: Mia's Demand Curve for Ice Cream) The accompanying graph shows Mia's demand curve for ice cream, how many cones would Mia be willing to buy at $5 per cone? 
A)3 cones
B)9 cones
C)5 cones
D)12 cones
A)3 cones
B)9 cones
C)5 cones
D)12 cones
Question
(Figure: Mia's Demand Curve for Ice Cream) Look at Mia's demand curve for ice cream, how many cones is Mia willing to buy at $4 per cone? 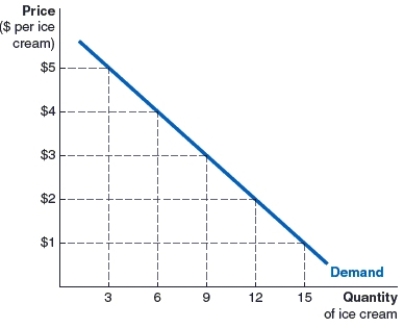
A)6 cones
B)3 cones
C)12 cones
D)9 cones
A)6 cones
B)3 cones
C)12 cones
D)9 cones
Question
Question
Question
Question
Question
Question
Question
Question
Question
Question
Question
Question
Question
Question
Question
Question
The table shows the monthly individual demand schedules of four students for soda. What is the total monthly market demand for soda at $2 per can? 
A)99 cans
B)45 cans
C)125 cans
D)148 cans
A)99 cans
B)45 cans
C)125 cans
D)148 cans
Question
The table contains the monthly demand for soda cans for four students. If these four students make up the entire market, what is the total monthly market demand for soda at $1.50 per can? 
A)125 cans
B)45 cans
C)99 cans
D)148 cans
A)125 cans
B)45 cans
C)99 cans
D)148 cans
Question
The table shows the monthly individual demand schedules of four students for soda. What is the change in the total market demand for soda when the price changes from $1.50 per can to $2 per can? 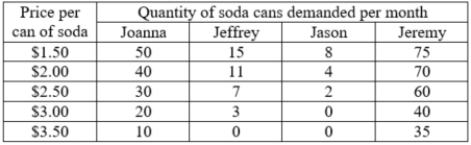
A)The total quantity demanded in the market falls by 23 cans.
B)The total quantity demanded in the market rises by 26 cans.
C)The total quantity demanded in the market falls by 18 cans.
D)The total quantity demanded in the market rises by 23 cans.
A)The total quantity demanded in the market falls by 23 cans.
B)The total quantity demanded in the market rises by 26 cans.
C)The total quantity demanded in the market falls by 18 cans.
D)The total quantity demanded in the market rises by 23 cans.
Question
The table contains the monthly demand for soda cans for four students. If these four students make up the entire market, what is the change in the total monthly market demand for soda when the price changes from $3 per can to $2.50 per can? 
A)The total quantity demanded in the market rises by 23 cans.
B)The total quantity demanded in the market falls by 26 cans.
C)The total quantity demanded in the market rises by 36 cans.
D)The total quantity demanded in the market falls by 33 cans.
A)The total quantity demanded in the market rises by 23 cans.
B)The total quantity demanded in the market falls by 26 cans.
C)The total quantity demanded in the market rises by 36 cans.
D)The total quantity demanded in the market falls by 33 cans.
Question
Question
Question
Question
Question
Question
(Figure: Graph) Refer to the graph to answer the question.
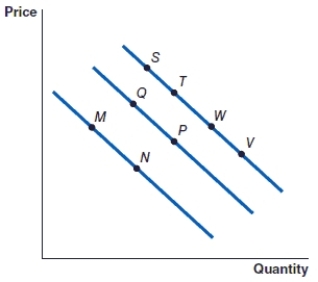
The movement from point M to point N represents:

A)a decrease in demand.
B)a decrease in quantity demanded.
C)an increase in quantity demanded.
D)an increase in demand.
The movement from point M to point N represents:
A)a decrease in demand.
B)a decrease in quantity demanded.
C)an increase in quantity demanded.
D)an increase in demand.
Question
(Figure: Graph) Refer to the graph to answer the question. In the graph, the movement from point P to point Q represents 
A)a decrease in quantity demanded.
B)an increase in demand.
C)a decrease in demand.
D)an increase in quantity demanded.
A)a decrease in quantity demanded.
B)an increase in demand.
C)a decrease in demand.
D)an increase in quantity demanded.
Question
(Figure: Graph) Refer to the graph to answer the question. In the graph, the movement from point M to point Q represents 
A)a decrease in demand.
B)a decrease in quantity demanded.
C)an increase in quantity demanded.
D)an increase in demand.
A)a decrease in demand.
B)a decrease in quantity demanded.
C)an increase in quantity demanded.
D)an increase in demand.
Question
(Figure: Graph) Refer to the graph to answer the question. In the graph, the movement from point W to point P represents: 
A)an increase in quantity demanded.
B)an increase in demand.
C)a decrease in demand.
D)an increase in quantity demanded.
A)an increase in quantity demanded.
B)an increase in demand.
C)a decrease in demand.
D)an increase in quantity demanded.
Question
(Figure: Graph) Refer to the graph to answer the question.
The movement from point S to point T is caused by
A)an increase in the price of the item.
B)a decrease in the price of the item.
C)a decrease in the demand for the item.
D)an increase in the demand for the item.
The movement from point S to point T is caused by
A)an increase in the price of the item.
B)a decrease in the price of the item.
C)a decrease in the demand for the item.
D)an increase in the demand for the item.
Question
(Figure: Graph) Refer to the graph to answer the question.
The movement from point V to point W is caused by

A)an increase in the price of the item.
B)a decrease in the price of the item.
C)an increase in the demand for the product.
D)a decrease in the demand for the product.
The movement from point V to point W is caused by
A)an increase in the price of the item.
B)a decrease in the price of the item.
C)an increase in the demand for the product.
D)a decrease in the demand for the product.
Question
(Figure: Graph) Refer to the graph to answer the question.
An increase in the price of an item will cause the movement from

A)point W to point V.
B)point Q to point P.
C)point N to point M.
D)point Q to point T.
An increase in the price of an item will cause the movement from
A)point W to point V.
B)point Q to point P.
C)point N to point M.
D)point Q to point T.
Question
(Figure: Graph) Refer to the graph to answer the question.
A decrease in the price of an item will cause the movement from

A)point P to point W.
B)point N to point M.
C)point T to point P.
D)point Q to point P.
A decrease in the price of an item will cause the movement from
A)point P to point W.
B)point N to point M.
C)point T to point P.
D)point Q to point P.
Question
Question
(Figure: Holly's Demand for Toffee) Holly doesn't care about the price of toffee. She loves toffee so much that she must eat toffee every day. Which of the following figures most likely depicts Holly's demand for toffee?
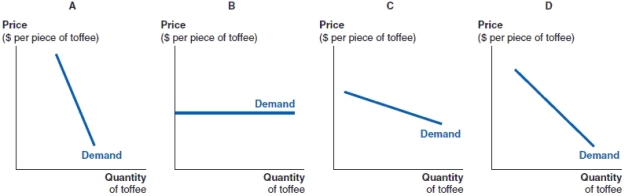
A)Figure A
B)Figure B
C)Figure C
D)Figure D
A)Figure A
B)Figure B
C)Figure C
D)Figure D
Question
(Figure: Damien's Demand for Kit-Kats) Regardless of the price of Kit-Kats, Damien has decided to eat five Kit-Kats every day. Which of the figures shows Damien's daily demand curve for Kit-Kats?
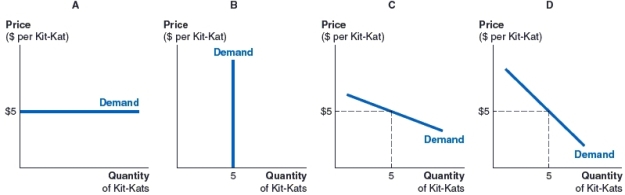
A)Figure A
B)Figure B
C)Figure C
D)Figure D
A)Figure A
B)Figure B
C)Figure C
D)Figure D
Question
Question
Question
Question
Question
Question
Question
Question
Question
Question
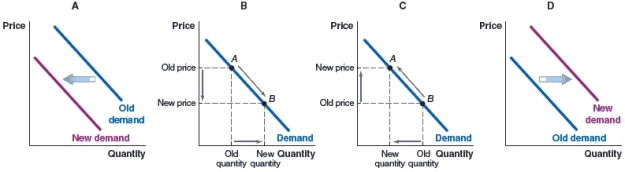
(Figure: Leather Wallets) Fossil has started an aggressive advertising campaign for its wallets. Which graph shows how the demand in the market might change if the advertising campaign is successful?

A)Graph A
B)Graph B
C)Graph C
D)Graph D
A)Graph A
B)Graph B
C)Graph C
D)Graph D
Question
(Figure: Demand for Bus Rides) The city of Vaughan in Ontario, Canada, opened a new subway line that extended the existing subway system between the greater Toronto area and the city of Vaughan. The route previously only had bus service. Which of the following graphs depicts the effect you would expect to see on the demand for bus rides on this route after the introduction of the subway?

A)Graph A
B)Graph B
C)Graph C
D)Graph D
A)Graph A
B)Graph B
C)Graph C
D)Graph D
Question
(Figure: Peanut Butter and Jelly) In the United States, peanut butter and jelly are considered complementary items. Which graph illustrates the impact of a rise in the price of peanut butter on the jelly market?

A)Graph A
B)Graph B
C)Graph C
D)Graph D
A)Graph A
B)Graph B
C)Graph C
D)Graph D
Question
(Figure: Butter and Jam) Some people like to eat jam and butter sandwiches, and for them, these two foods are complementary goods. For these people, which of the graphs illustrates the impact of a fall in the price of butter on the jam market?

A)Graph A
B)Graph B
C)Graph C
D)Graph D
A)Graph A
B)Graph B
C)Graph C
D)Graph D
Question
(Figure: Demand for Rental Housing) Fort Collins, CO is experiencing net immigration of people into the area. Which of the following graphs illustrates the impact of this net immigration on the demand for rental housing?
A)Graph A
B)Graph B
C)Graph C
D)Graph D
A)Graph A
B)Graph B
C)Graph C
D)Graph D
Question
(Figure: Market for Luxury Vehicles) Which graph shows what will happen in the market for luxury vehicles if a recession is imminent?

A)Graph A
B)Graph B
C)Graph C
D)Graph D
A)Graph A
B)Graph B
C)Graph C
D)Graph D
Question
(Figure: Market for Holiday Cruises) Which graph shows the effect of an impending slowdown on the market for cruise holidays?

A)Graph A
B)Graph B
C)Graph C
D)Graph D
A)Graph A
B)Graph B
C)Graph C
D)Graph D
Question
(Figure: Market for High-End Meals) What will happen to the demand for upscale restaurants, if an economy goes into recession and unemployment rises?

A)Graph A
B)Graph B
C)Graph C
D)Graph D
A)Graph A
B)Graph B
C)Graph C
D)Graph D
Question
(Figure: Market for Community College) Which graph illustrates the effect on the demand for community college, if an economy faces a recession, and there is rising unemployment?

A)Graph A
B)Graph B
C)Graph C
D)Graph D
A)Graph A
B)Graph B
C)Graph C
D)Graph D
Question
(Figure: Market for New Housing) Which of the graphs shows the effect on the housing market today, if the realtor association predicts new housing prices to fall in a few months?

A)Graph A
B)Graph B
C)Graph C
D)Graph D
A)Graph A
B)Graph B
C)Graph C
D)Graph D
Question
(Figure: Market for New Housing) Which graph shows the effect on the housing market today, if the realtor association predicts new housing prices to rise in a few months?

A)Graph A
B)Graph B
C)Graph C
D)Graph D
A)Graph A
B)Graph B
C)Graph C
D)Graph D
Question
(Figure: Market for Printing Paper) Which of the following graphs illustrates what we expect to see in the market for printing paper if the price of printing paper rises?

A)Graph A
B)Graph B
C)Graph C
D)Graph D
A)Graph A
B)Graph B
C)Graph C
D)Graph D
Question
(Figure: Market for Roses) Which graph illustrates what will happen in the market for roses if the price of roses falls?

A)Graph A
B)Graph B
C)Graph C
D)Graph D
A)Graph A
B)Graph B
C)Graph C
D)Graph D
Question
Question
(Figure: Market for Stevia) Stevia is a natural sweetener that is used as a sugar substitute. Which of the following graphs illustrates the impact of a rise in the price of Stevia on the demand for sugar?

A)Graph A
B)Graph B
C)Graph C
D)Graph D
A)Graph A
B)Graph B
C)Graph C
D)Graph D
Question
(Figure: Market for Bread) Bread and cheese are often considered to be complementary foods. Which graph shows what will happen in the market for bread if the price of bread rises?

A)Graph A
B)Graph B
C)Graph C
D)Graph D
A)Graph A
B)Graph B
C)Graph C
D)Graph D
Question
(Figure: Market for Apple Computers) Dell and Apple are competitors in the computer market. Which graph illustrates the effect of a rise in the price of Dell computers on the demand for Apple computers?

A)Graph A
B)Graph B
C)Graph C
D)Graph D
A)Graph A
B)Graph B
C)Graph C
D)Graph D
Question
Question
Question
Question
Question
Question
Question
Question
Question
Question
Question
Question
(Figure: Market for Tourism) A hotel in Cape Cod, Massachusetts, is completely booked during August. However, in September, tourism drops significantly and some hotel rooms remain empty. Which of the graphs depicts this scenario?

A)Graph A
B)Graph B
C)Graph C
D)Graph D
A)Graph A
B)Graph B
C)Graph C
D)Graph D
Question

Unlock Deck
Sign up to unlock the cards in this deck!
Unlock Deck
Unlock Deck
1/165
Play
Full screen (f)
Deck 2: Demand: Thinking Like a Buyer
1
An individual demand curve is a graph:
A)that plots the quantity of an item that someone plans to buy, at each price.
B)that plots the quantity of an item that someone plans to buy, at one single price point.
C)that plots the quantity of an item that a seller plans to sell, at each price.
D)that plots the market price of a product at different points in time.
B
2
Quantity demanded is on the horizontal axis when you plot a demand curve and shows the:
A)amount of a good that a person is willing to buy at each price.
B)amount of a good that a person actually buys at the market price.
C)amount of a good that a seller is willing to sell at a particular price.
D)amount where opportunity cost is equal to the marginal benefit.
A)amount of a good that a person is willing to buy at each price.
B)amount of a good that a person actually buys at the market price.
C)amount of a good that a seller is willing to sell at a particular price.
D)amount where opportunity cost is equal to the marginal benefit.
A
3
(Figure: Leonard's Demand for Pecan Pie) Look at Leonard's weekly demand curve for slices of pie. How many slices of pie is Leonard willing to buy at $3 per slice?
A)3 slices
B)9 slices
C)7 slices
D)5 slices
A)3 slices
B)9 slices
C)7 slices
D)5 slices
D
4
(Figure: Leonard's Demand for Pecan Pie) Look at Leonard's weekly demand curve for slices of pie. How many slices of pie is Leonard willing to buy at $2 per slice?
A)3 slices
B)9 slices
C)7 slices
D)5 slices
A)3 slices
B)9 slices
C)7 slices
D)5 slices
Unlock Deck
Unlock for access to all 165 flashcards in this deck.
Unlock Deck
k this deck
5
(Figure: Mia's Demand Curve for Ice Cream) The accompanying graph shows Mia's demand curve for ice cream, how many cones would Mia be willing to buy at $5 per cone?
A)3 cones
B)9 cones
C)5 cones
D)12 cones
A)3 cones
B)9 cones
C)5 cones
D)12 cones
Unlock Deck
Unlock for access to all 165 flashcards in this deck.
Unlock Deck
k this deck
6
(Figure: Mia's Demand Curve for Ice Cream) Look at Mia's demand curve for ice cream, how many cones is Mia willing to buy at $4 per cone?
A)6 cones
B)3 cones
C)12 cones
D)9 cones
A)6 cones
B)3 cones
C)12 cones
D)9 cones
Unlock Deck
Unlock for access to all 165 flashcards in this deck.
Unlock Deck
k this deck
7
Why does the demand curve slope downwards?
A)It slopes downward due to the positive relationship between price and quantity demanded.
B)It slopes downward due to buyers perceiving fall in price as a fall in quality.
C)It slopes downward due to the law of demand.
D)It slopes downward due to stores lowering the prices on their products.
A)It slopes downward due to the positive relationship between price and quantity demanded.
B)It slopes downward due to buyers perceiving fall in price as a fall in quality.
C)It slopes downward due to the law of demand.
D)It slopes downward due to stores lowering the prices on their products.
Unlock Deck
Unlock for access to all 165 flashcards in this deck.
Unlock Deck
k this deck
8
A downward-sloping demand curve implies:
A)there is an inverse relationship between price and quantity demanded.
B)there is a positive relationship between price and quantity demanded.
C)there is no relationship between price and quantity demanded.
D)buyers are willing to buy less when prices are lower.
A)there is an inverse relationship between price and quantity demanded.
B)there is a positive relationship between price and quantity demanded.
C)there is no relationship between price and quantity demanded.
D)buyers are willing to buy less when prices are lower.
Unlock Deck
Unlock for access to all 165 flashcards in this deck.
Unlock Deck
k this deck
9
The law of demand refers to
A)the positive relationship between price and quantity supplied.
B)the inverse relationship between price and quantity supplied.
C)the inverse relationship between price and quantity demanded.
D)the positive relationship between price and quantity demanded.
A)the positive relationship between price and quantity supplied.
B)the inverse relationship between price and quantity supplied.
C)the inverse relationship between price and quantity demanded.
D)the positive relationship between price and quantity demanded.
Unlock Deck
Unlock for access to all 165 flashcards in this deck.
Unlock Deck
k this deck
10
Which of the following scenarios does not illustrate the law of demand?
A)When Kit-Kats are cheaper, Mary opts to buy more Kit-Kats.
B)Darren buys two pairs of jeans when they are $40 each, but only one pair when it is $60.
C)Layla buys less tea when the price of tea rises.
D)Freya buys more doughnuts when the price of doughnuts is higher.
A)When Kit-Kats are cheaper, Mary opts to buy more Kit-Kats.
B)Darren buys two pairs of jeans when they are $40 each, but only one pair when it is $60.
C)Layla buys less tea when the price of tea rises.
D)Freya buys more doughnuts when the price of doughnuts is higher.
Unlock Deck
Unlock for access to all 165 flashcards in this deck.
Unlock Deck
k this deck
11
Which of the following scenarios illustrates the law of demand?
A)Francis does not care about the price of coffee at the coffee shop - he must buy two cappuccinos every day, regardless of the price.
B)A research company finds that the more expensive a particular brand of a designer handbag, the more that consumers are willing to purchase the brand.
C)John likes to drink spring water. At $2 he buys four bottles of water, and at $1.50 he still buys four bottles of water.
D)Kathleen eats more steak when the price is low, and less when the price is high.
Unlock Deck
Unlock for access to all 165 flashcards in this deck.
Unlock Deck
k this deck
12
When plotting a demand curve,
A)quantity demanded is on the vertical axis.
B)price is on the horizontal axis.
C)quantity supplied is on the vertical axis.
D)quantity demanded is on the horizontal axis.
A)quantity demanded is on the vertical axis.
B)price is on the horizontal axis.
C)quantity supplied is on the vertical axis.
D)quantity demanded is on the horizontal axis.
Unlock Deck
Unlock for access to all 165 flashcards in this deck.
Unlock Deck
k this deck
13
When plotting a demand curve
A)quantity demanded is on the vertical axis.
B)price is on the horizontal axis.
C)price is on the vertical axis.
D)quantity supplied is on the vertical axis.
A)quantity demanded is on the vertical axis.
B)price is on the horizontal axis.
C)price is on the vertical axis.
D)quantity supplied is on the vertical axis.
Unlock Deck
Unlock for access to all 165 flashcards in this deck.
Unlock Deck
k this deck
14
A rational buyer will:
A)keep buying a product until marginal benefit equals price.
B)buy a product until the marginal benefit of consuming the product is less than the price of the product.
C)buy the product only when the marginal benefit of consuming the product is twice as much as the price of the product.
D)not consider costs versus benefits when purchasing a product.
Unlock Deck
Unlock for access to all 165 flashcards in this deck.
Unlock Deck
k this deck
15
The Rational Rule for Buyers
A)compares the total benefit of all units to the total price of all units purchased.
B)compares the benefit of buying an additional unit of the item to the cost of that item.
C)only applies to buyers who are buying necessities as opposed to luxury items.
D)compares the cost of production of an item to the price of the item.
Unlock Deck
Unlock for access to all 165 flashcards in this deck.
Unlock Deck
k this deck
16
Which of the following scenarios depicts a rational buyer?
A)Mary values a bag of salad at $2, but she buys the bag of salad even when the price is $4.
B)John walks into a grocery store and purchases monthly groceries without paying attention to the prices of groceries.
C)Darwin buys a can of shoe polish at $4.50 when his marginal benefit from it is $3.75.
D)Damien chooses to buy a sandwich for $5 when the marginal benefit of the sandwich to him is $7.
Unlock Deck
Unlock for access to all 165 flashcards in this deck.
Unlock Deck
k this deck
17
The demand curve
(i) is a curve that shows the maximum willingness to pay for a product.
(ii) is a curve that shows the marginal benefit gained from a product.
(iii) is a curve that shows the production cost of a product.
(iv) is a curve that shows the relationship between the price of a product and a consumer's willingness to buy at each price.
A)(i), (ii), (iii) and (iv) are all correct.
B)(i), (ii) and (iv) are correct.
C)(ii) and (iv) are correct.
D)(i) and (ii) are correct.
Unlock Deck
Unlock for access to all 165 flashcards in this deck.
Unlock Deck
k this deck
18
Which of the following would be considered in a cost-benefit analysis to decide if a person should cycle to work or ride the subway?
(i) The air pollution that the cyclist has to breathe.
(ii) The cost of subway tickets.
(iii) The time it takes to cycle to work versus the time it takes to ride the subway to work.
(iv) The cost per gallon of gasoline.
A)(i), (iii) and (iv)
B)(i), (ii), (iii) and (iv)
C)(i), (ii), and (iv)
D)(i), (ii) and (iii)
Unlock Deck
Unlock for access to all 165 flashcards in this deck.
Unlock Deck
k this deck
19
Diminishing marginal benefit:
A)is when buying an additional item yields a larger marginal benefit than the previous item.
B)is when consumers do not follow the rational rule.
C)is not important in determining a consumer's purchase decision.
D)is when buying an additional item yields a smaller marginal benefit than the previous item.
Unlock Deck
Unlock for access to all 165 flashcards in this deck.
Unlock Deck
k this deck
20
Diminishing marginal benefit
A)does not affect a buyer's decision.
B)can be observed in the upward slope of the supply curve.
C)can be observed in the downward slope of the demand curve.
D)means that consumers are willing to pay more for additional units of an item.
A)does not affect a buyer's decision.
B)can be observed in the upward slope of the supply curve.
C)can be observed in the downward slope of the demand curve.
D)means that consumers are willing to pay more for additional units of an item.
Unlock Deck
Unlock for access to all 165 flashcards in this deck.
Unlock Deck
k this deck
21
On a hot sweltering day, you feel thirsty and buy an ice-cold soft drink, which you gulp down. Whether you buy the second drink or not, will depend on
A)how you feel about soft drinks.
B)the total amount of soft drinks that you have consumed that week.
C)the price of the soft drink.
D)the marginal benefit from the second soft drink and if it will outweigh the price of the soft drink.
A)how you feel about soft drinks.
B)the total amount of soft drinks that you have consumed that week.
C)the price of the soft drink.
D)the marginal benefit from the second soft drink and if it will outweigh the price of the soft drink.
Unlock Deck
Unlock for access to all 165 flashcards in this deck.
Unlock Deck
k this deck
22
The table shows the monthly individual demand schedules of four students for soda. What is the total monthly market demand for soda at $2 per can?
A)99 cans
B)45 cans
C)125 cans
D)148 cans
A)99 cans
B)45 cans
C)125 cans
D)148 cans
Unlock Deck
Unlock for access to all 165 flashcards in this deck.
Unlock Deck
k this deck
23
The table contains the monthly demand for soda cans for four students. If these four students make up the entire market, what is the total monthly market demand for soda at $1.50 per can?
A)125 cans
B)45 cans
C)99 cans
D)148 cans
A)125 cans
B)45 cans
C)99 cans
D)148 cans
Unlock Deck
Unlock for access to all 165 flashcards in this deck.
Unlock Deck
k this deck
24
The table shows the monthly individual demand schedules of four students for soda. What is the change in the total market demand for soda when the price changes from $1.50 per can to $2 per can?
A)The total quantity demanded in the market falls by 23 cans.
B)The total quantity demanded in the market rises by 26 cans.
C)The total quantity demanded in the market falls by 18 cans.
D)The total quantity demanded in the market rises by 23 cans.
A)The total quantity demanded in the market falls by 23 cans.
B)The total quantity demanded in the market rises by 26 cans.
C)The total quantity demanded in the market falls by 18 cans.
D)The total quantity demanded in the market rises by 23 cans.
Unlock Deck
Unlock for access to all 165 flashcards in this deck.
Unlock Deck
k this deck
25
The table contains the monthly demand for soda cans for four students. If these four students make up the entire market, what is the change in the total monthly market demand for soda when the price changes from $3 per can to $2.50 per can?
A)The total quantity demanded in the market rises by 23 cans.
B)The total quantity demanded in the market falls by 26 cans.
C)The total quantity demanded in the market rises by 36 cans.
D)The total quantity demanded in the market falls by 33 cans.
A)The total quantity demanded in the market rises by 23 cans.
B)The total quantity demanded in the market falls by 26 cans.
C)The total quantity demanded in the market rises by 36 cans.
D)The total quantity demanded in the market falls by 33 cans.
Unlock Deck
Unlock for access to all 165 flashcards in this deck.
Unlock Deck
k this deck
26
As part of a market research project, you survey six random people to see how much gas per week they would buy at various prices. The data you collect is in the accompanying table. What is the total demand for gasoline at $2.50 per gallon in your survey?
?
Quantity of Gallons of Gas Demanded Per Week
A)51 gallons
B)38 gallons
C)77 gallons
D)22 gallons
?
Quantity of Gallons of Gas Demanded Per Week
A)51 gallons
B)38 gallons
C)77 gallons
D)22 gallons
Unlock Deck
Unlock for access to all 165 flashcards in this deck.
Unlock Deck
k this deck
27
As part of a market research project, you survey six random people to see how much gas per week they would buy at various prices. The data you collect is in the accompanying table. What is the total demand in your survey for gas at $1.50 per gallon?
?
Quantity of Gallons of Gas Demanded Per Week
A)51 gallons
B)77 gallons
C)38 gallons
D)22 gallons
?
Quantity of Gallons of Gas Demanded Per Week
A)51 gallons
B)77 gallons
C)38 gallons
D)22 gallons
Unlock Deck
Unlock for access to all 165 flashcards in this deck.
Unlock Deck
k this deck
28
As a part of a market research project, you survey six random people to see how much gas per week they would buy at various prices. The data you collect is in the accompanying table. What is the change in the total demand for gasoline in your survey when the price changes from $2 per gallon to $2.50 per gallon?
?
Quantity of Gallons of Gas Demanded Per Week
A)The total quantity demanded in the market rises by 11 gallons.
B)The total quantity demanded in the market falls by 14 gallons.
C)The total quantity demanded in the market rises by 16 gallons.
D)The total quantity demanded in the market falls by 13 gallons.
Unlock Deck
Unlock for access to all 165 flashcards in this deck.
Unlock Deck
k this deck
29
As part of a market research project, you survey six random people to see how much gas per week they would buy at various prices. The data you collect is in the accompanying table. What is the change in the total demand for gasoline in your survey when the price changes from $3 per gallon to $2.50 per gallon?
?
Quantity of Gallons of Gas Demanded Per Week
A)The total quantity demanded in the market falls by 11 gallons.
B)The total quantity demanded in the market falls by 14 gallons.
C)The total quantity demanded in the market rises by 16 gallons.
D)The total quantity demanded in the market rises by 13 gallons.
Unlock Deck
Unlock for access to all 165 flashcards in this deck.
Unlock Deck
k this deck
30
What is the process that a manager can follow to estimate the total market demand for the United States?
A)Survey one consumer, and then scale up that individual demand to represent the entire market, and plot the market demand curve.
B)Survey some representative customers, find the total quantity demanded for those customers, scale up the quantities demanded to represent the entire market, and then plot the market demand curve.
C)Survey representative customers, find the total quantity demanded for those representative customers, and then plot the market demand curve.
D)Generate random data to represent market quantity demanded for the entire market, and then plot the market demand curve.
Unlock Deck
Unlock for access to all 165 flashcards in this deck.
Unlock Deck
k this deck
31
(Figure: Graph) Refer to the graph to answer the question.
The movement from point M to point N represents:
A)a decrease in demand.
B)a decrease in quantity demanded.
C)an increase in quantity demanded.
D)an increase in demand.
The movement from point M to point N represents:
A)a decrease in demand.
B)a decrease in quantity demanded.
C)an increase in quantity demanded.
D)an increase in demand.
Unlock Deck
Unlock for access to all 165 flashcards in this deck.
Unlock Deck
k this deck
32
(Figure: Graph) Refer to the graph to answer the question. In the graph, the movement from point P to point Q represents
A)a decrease in quantity demanded.
B)an increase in demand.
C)a decrease in demand.
D)an increase in quantity demanded.
A)a decrease in quantity demanded.
B)an increase in demand.
C)a decrease in demand.
D)an increase in quantity demanded.
Unlock Deck
Unlock for access to all 165 flashcards in this deck.
Unlock Deck
k this deck
33
(Figure: Graph) Refer to the graph to answer the question. In the graph, the movement from point M to point Q represents
A)a decrease in demand.
B)a decrease in quantity demanded.
C)an increase in quantity demanded.
D)an increase in demand.
A)a decrease in demand.
B)a decrease in quantity demanded.
C)an increase in quantity demanded.
D)an increase in demand.
Unlock Deck
Unlock for access to all 165 flashcards in this deck.
Unlock Deck
k this deck
34
(Figure: Graph) Refer to the graph to answer the question. In the graph, the movement from point W to point P represents:
A)an increase in quantity demanded.
B)an increase in demand.
C)a decrease in demand.
D)an increase in quantity demanded.
A)an increase in quantity demanded.
B)an increase in demand.
C)a decrease in demand.
D)an increase in quantity demanded.
Unlock Deck
Unlock for access to all 165 flashcards in this deck.
Unlock Deck
k this deck
35
(Figure: Graph) Refer to the graph to answer the question.
The movement from point S to point T is caused by
A)an increase in the price of the item.
B)a decrease in the price of the item.
C)a decrease in the demand for the item.
D)an increase in the demand for the item.
The movement from point S to point T is caused by
A)an increase in the price of the item.
B)a decrease in the price of the item.
C)a decrease in the demand for the item.
D)an increase in the demand for the item.
Unlock Deck
Unlock for access to all 165 flashcards in this deck.
Unlock Deck
k this deck
36
(Figure: Graph) Refer to the graph to answer the question.
The movement from point V to point W is caused by
A)an increase in the price of the item.
B)a decrease in the price of the item.
C)an increase in the demand for the product.
D)a decrease in the demand for the product.
The movement from point V to point W is caused by
A)an increase in the price of the item.
B)a decrease in the price of the item.
C)an increase in the demand for the product.
D)a decrease in the demand for the product.
Unlock Deck
Unlock for access to all 165 flashcards in this deck.
Unlock Deck
k this deck
37
(Figure: Graph) Refer to the graph to answer the question.
An increase in the price of an item will cause the movement from
A)point W to point V.
B)point Q to point P.
C)point N to point M.
D)point Q to point T.
An increase in the price of an item will cause the movement from
A)point W to point V.
B)point Q to point P.
C)point N to point M.
D)point Q to point T.
Unlock Deck
Unlock for access to all 165 flashcards in this deck.
Unlock Deck
k this deck
38
(Figure: Graph) Refer to the graph to answer the question.
A decrease in the price of an item will cause the movement from
A)point P to point W.
B)point N to point M.
C)point T to point P.
D)point Q to point P.
A decrease in the price of an item will cause the movement from
A)point P to point W.
B)point N to point M.
C)point T to point P.
D)point Q to point P.
Unlock Deck
Unlock for access to all 165 flashcards in this deck.
Unlock Deck
k this deck
39
The interdependence principle:
A)is the same as the cost-benefit principle.
B)refers to the marginal benefit of consuming additional units of an item.
C)implies that buyers decisions are affected by many factors other than the price of an item.
D)implies that consumers depend on each other to make purchase decisions in the market.
Unlock Deck
Unlock for access to all 165 flashcards in this deck.
Unlock Deck
k this deck
40
(Figure: Holly's Demand for Toffee) Holly doesn't care about the price of toffee. She loves toffee so much that she must eat toffee every day. Which of the following figures most likely depicts Holly's demand for toffee?
A)Figure A
B)Figure B
C)Figure C
D)Figure D
A)Figure A
B)Figure B
C)Figure C
D)Figure D
Unlock Deck
Unlock for access to all 165 flashcards in this deck.
Unlock Deck
k this deck
41
(Figure: Damien's Demand for Kit-Kats) Regardless of the price of Kit-Kats, Damien has decided to eat five Kit-Kats every day. Which of the figures shows Damien's daily demand curve for Kit-Kats?
A)Figure A
B)Figure B
C)Figure C
D)Figure D
A)Figure A
B)Figure B
C)Figure C
D)Figure D
Unlock Deck
Unlock for access to all 165 flashcards in this deck.
Unlock Deck
k this deck
42
Shifts in market demand can result from a change in
A)the price of a product.
B)the cost of production for an item.
C)the number of producers of an item in the market.
D)the type and number of buyers.
A)the price of a product.
B)the cost of production for an item.
C)the number of producers of an item in the market.
D)the type and number of buyers.
Unlock Deck
Unlock for access to all 165 flashcards in this deck.
Unlock Deck
k this deck
43
Which of the following is not a demand shifter?
A)The price of a substitute good.
B)The price of a complementary good.
C)The number of buyers in the market.
D)The price of the product.
A)The price of a substitute good.
B)The price of a complementary good.
C)The number of buyers in the market.
D)The price of the product.
Unlock Deck
Unlock for access to all 165 flashcards in this deck.
Unlock Deck
k this deck
44
A normal good is:
A)a good for which higher income causes an increase in demand.
B)a good which is normally purchased by many consumers.
C)a good which is only purchased by high-income consumers.
D)a good for which higher income causes a decrease in demand.
A)a good for which higher income causes an increase in demand.
B)a good which is normally purchased by many consumers.
C)a good which is only purchased by high-income consumers.
D)a good for which higher income causes a decrease in demand.
Unlock Deck
Unlock for access to all 165 flashcards in this deck.
Unlock Deck
k this deck
45
For normal goods
A)a tax cut on consumer income will lead to a rise in their demand.
B)a tax cut on consumer income will lead to a fall in their demand.
C)changes in consumer income do not affect their consumption.
D)most consumers will choose to purchase the good regardless of income changes.
A)a tax cut on consumer income will lead to a rise in their demand.
B)a tax cut on consumer income will lead to a fall in their demand.
C)changes in consumer income do not affect their consumption.
D)most consumers will choose to purchase the good regardless of income changes.
Unlock Deck
Unlock for access to all 165 flashcards in this deck.
Unlock Deck
k this deck
46
An inferior good is
A)a good whose demand increases when income rises.
B)a good whose demand decreases when income rises.
C)an item that is only bought by rich people.
D)an item that is purchased by very few people.
A)a good whose demand increases when income rises.
B)a good whose demand decreases when income rises.
C)an item that is only bought by rich people.
D)an item that is purchased by very few people.
Unlock Deck
Unlock for access to all 165 flashcards in this deck.
Unlock Deck
k this deck
47
Fast food is a good example of
A)a normal good.
B)a good with a congestion effect.
C)an inferior good.
D)a luxury good.
A)a normal good.
B)a good with a congestion effect.
C)an inferior good.
D)a luxury good.
Unlock Deck
Unlock for access to all 165 flashcards in this deck.
Unlock Deck
k this deck
48
Holding all else constant, if people eat out more at expensive restaurants when they earn more, then expensive restaurant meals are
A)goods with a congestion-effect.
B)goods with a network-effect.
C)inferior goods.
D)normal goods.
A)goods with a congestion-effect.
B)goods with a network-effect.
C)inferior goods.
D)normal goods.
Unlock Deck
Unlock for access to all 165 flashcards in this deck.
Unlock Deck
k this deck
49
Recent evidence suggests exercise promotes longevity and reverses aging. Based on this information, what might happen in the market for exercise-related goods and services?
A)The demand for gyms will not change.
B)People will reduce their purchases of exercise equipment.
C)The demand for exercise machines and/or gyms will increase.
D)The demand for exercise equipment will not be affected.
A)The demand for gyms will not change.
B)People will reduce their purchases of exercise equipment.
C)The demand for exercise machines and/or gyms will increase.
D)The demand for exercise equipment will not be affected.
Unlock Deck
Unlock for access to all 165 flashcards in this deck.
Unlock Deck
k this deck
50
In March 2019, airlines around the world grounded their Boeing 737 Max aircraft after two of them crashed. What would we expect to happen in the market for this aircraft?
A)Airline companies would increase their demand for the Boeing 737 Max aircraft.
B)There would be a rise in the number of orders for the Boeing 737 Max aircraft.
C)Consumers would increase the number of flights they take per year.
D)The demand for the Boeing 737 Max would decrease due to concerns about the safety of the aircraft.
Unlock Deck
Unlock for access to all 165 flashcards in this deck.
Unlock Deck
k this deck
51
(Figure: Leather Wallets) Fossil has started an aggressive advertising campaign for its wallets. Which graph shows how the demand in the market might change if the advertising campaign is successful?
A)Graph A
B)Graph B
C)Graph C
D)Graph D
A)Graph A
B)Graph B
C)Graph C
D)Graph D
Unlock Deck
Unlock for access to all 165 flashcards in this deck.
Unlock Deck
k this deck
52
(Figure: Demand for Bus Rides) The city of Vaughan in Ontario, Canada, opened a new subway line that extended the existing subway system between the greater Toronto area and the city of Vaughan. The route previously only had bus service. Which of the following graphs depicts the effect you would expect to see on the demand for bus rides on this route after the introduction of the subway?
A)Graph A
B)Graph B
C)Graph C
D)Graph D
A)Graph A
B)Graph B
C)Graph C
D)Graph D
Unlock Deck
Unlock for access to all 165 flashcards in this deck.
Unlock Deck
k this deck
53
(Figure: Peanut Butter and Jelly) In the United States, peanut butter and jelly are considered complementary items. Which graph illustrates the impact of a rise in the price of peanut butter on the jelly market?
A)Graph A
B)Graph B
C)Graph C
D)Graph D
A)Graph A
B)Graph B
C)Graph C
D)Graph D
Unlock Deck
Unlock for access to all 165 flashcards in this deck.
Unlock Deck
k this deck
54
(Figure: Butter and Jam) Some people like to eat jam and butter sandwiches, and for them, these two foods are complementary goods. For these people, which of the graphs illustrates the impact of a fall in the price of butter on the jam market?
A)Graph A
B)Graph B
C)Graph C
D)Graph D
A)Graph A
B)Graph B
C)Graph C
D)Graph D
Unlock Deck
Unlock for access to all 165 flashcards in this deck.
Unlock Deck
k this deck
55
(Figure: Demand for Rental Housing) Fort Collins, CO is experiencing net immigration of people into the area. Which of the following graphs illustrates the impact of this net immigration on the demand for rental housing?
A)Graph A
B)Graph B
C)Graph C
D)Graph D
A)Graph A
B)Graph B
C)Graph C
D)Graph D
Unlock Deck
Unlock for access to all 165 flashcards in this deck.
Unlock Deck
k this deck
56
(Figure: Market for Luxury Vehicles) Which graph shows what will happen in the market for luxury vehicles if a recession is imminent?
A)Graph A
B)Graph B
C)Graph C
D)Graph D
A)Graph A
B)Graph B
C)Graph C
D)Graph D
Unlock Deck
Unlock for access to all 165 flashcards in this deck.
Unlock Deck
k this deck
57
(Figure: Market for Holiday Cruises) Which graph shows the effect of an impending slowdown on the market for cruise holidays?
A)Graph A
B)Graph B
C)Graph C
D)Graph D
A)Graph A
B)Graph B
C)Graph C
D)Graph D
Unlock Deck
Unlock for access to all 165 flashcards in this deck.
Unlock Deck
k this deck
58
(Figure: Market for High-End Meals) What will happen to the demand for upscale restaurants, if an economy goes into recession and unemployment rises?
A)Graph A
B)Graph B
C)Graph C
D)Graph D
A)Graph A
B)Graph B
C)Graph C
D)Graph D
Unlock Deck
Unlock for access to all 165 flashcards in this deck.
Unlock Deck
k this deck
59
(Figure: Market for Community College) Which graph illustrates the effect on the demand for community college, if an economy faces a recession, and there is rising unemployment?
A)Graph A
B)Graph B
C)Graph C
D)Graph D
A)Graph A
B)Graph B
C)Graph C
D)Graph D
Unlock Deck
Unlock for access to all 165 flashcards in this deck.
Unlock Deck
k this deck
60
(Figure: Market for New Housing) Which of the graphs shows the effect on the housing market today, if the realtor association predicts new housing prices to fall in a few months?
A)Graph A
B)Graph B
C)Graph C
D)Graph D
A)Graph A
B)Graph B
C)Graph C
D)Graph D
Unlock Deck
Unlock for access to all 165 flashcards in this deck.
Unlock Deck
k this deck
61
(Figure: Market for New Housing) Which graph shows the effect on the housing market today, if the realtor association predicts new housing prices to rise in a few months?
A)Graph A
B)Graph B
C)Graph C
D)Graph D
A)Graph A
B)Graph B
C)Graph C
D)Graph D
Unlock Deck
Unlock for access to all 165 flashcards in this deck.
Unlock Deck
k this deck
62
(Figure: Market for Printing Paper) Which of the following graphs illustrates what we expect to see in the market for printing paper if the price of printing paper rises?
A)Graph A
B)Graph B
C)Graph C
D)Graph D
A)Graph A
B)Graph B
C)Graph C
D)Graph D
Unlock Deck
Unlock for access to all 165 flashcards in this deck.
Unlock Deck
k this deck
63
(Figure: Market for Roses) Which graph illustrates what will happen in the market for roses if the price of roses falls?
A)Graph A
B)Graph B
C)Graph C
D)Graph D
A)Graph A
B)Graph B
C)Graph C
D)Graph D
Unlock Deck
Unlock for access to all 165 flashcards in this deck.
Unlock Deck
k this deck
64
If Tesla cars become less expensive, what will happen in the market for other electric cars?
A)The quantity demanded of Teslas will fall.
B)The demand for other electric cars will fall.
C)The demand for other electric cars will rise.
D)The quantity demanded of Teslas will not change.
A)The quantity demanded of Teslas will fall.
B)The demand for other electric cars will fall.
C)The demand for other electric cars will rise.
D)The quantity demanded of Teslas will not change.
Unlock Deck
Unlock for access to all 165 flashcards in this deck.
Unlock Deck
k this deck
65
(Figure: Market for Stevia) Stevia is a natural sweetener that is used as a sugar substitute. Which of the following graphs illustrates the impact of a rise in the price of Stevia on the demand for sugar?
A)Graph A
B)Graph B
C)Graph C
D)Graph D
A)Graph A
B)Graph B
C)Graph C
D)Graph D
Unlock Deck
Unlock for access to all 165 flashcards in this deck.
Unlock Deck
k this deck
66
(Figure: Market for Bread) Bread and cheese are often considered to be complementary foods. Which graph shows what will happen in the market for bread if the price of bread rises?
A)Graph A
B)Graph B
C)Graph C
D)Graph D
A)Graph A
B)Graph B
C)Graph C
D)Graph D
Unlock Deck
Unlock for access to all 165 flashcards in this deck.
Unlock Deck
k this deck
67
(Figure: Market for Apple Computers) Dell and Apple are competitors in the computer market. Which graph illustrates the effect of a rise in the price of Dell computers on the demand for Apple computers?
A)Graph A
B)Graph B
C)Graph C
D)Graph D
A)Graph A
B)Graph B
C)Graph C
D)Graph D
Unlock Deck
Unlock for access to all 165 flashcards in this deck.
Unlock Deck
k this deck
68
Which of the following lists only factors that would cause a decrease in the demand for a good?
A)A decrease in popularity of a good; a rise in income (if the good is an inferior good); a fall in the price of a substitute good.
B)A decrease in the number of consumers in the market; a rise in the price of a substitute good; a fall in the price of a complementary good.
C)An increase in congestion effects; a decrease in the number of consumers in the market; increase in popularity of a product.
D)An increase in network effects; a rise in income (if the good is a normal good); a rise in the price of a substitute good.
Unlock Deck
Unlock for access to all 165 flashcards in this deck.
Unlock Deck
k this deck
69
Which of the following lists only factors that would cause an increase in the demand for an item?
A)Information on possible side effects of using an item; a rise in income (if the good is a normal good); a fall in the price of a substitute good
B)Information on possible side effects of using an item; a rise in income (if the good is a normal good); a fall in the price of a substitute good
C)A decrease in the number of consumers in the market; a rise in the price of a substitute good; a fall in the price of a complementary good
D)An increased congestion effect; a decrease in the number of consumers in the market; increase in popularity of a product
Unlock Deck
Unlock for access to all 165 flashcards in this deck.
Unlock Deck
k this deck
70
Which of the following items is an inferior good?
A)Low-quality frozen meals
B)University textbooks
C)Restaurant a la carte dinners
D)Toll roads
A)Low-quality frozen meals
B)University textbooks
C)Restaurant a la carte dinners
D)Toll roads
Unlock Deck
Unlock for access to all 165 flashcards in this deck.
Unlock Deck
k this deck
71
Which of the following items is a normal good?
A)Canned food
B)Instant noodles
C)Steak
D)Third-hand cars
A)Canned food
B)Instant noodles
C)Steak
D)Third-hand cars
Unlock Deck
Unlock for access to all 165 flashcards in this deck.
Unlock Deck
k this deck
72
The relationship between price expectations and demand is
A)negative; when future prices are expected to rise, current demand will fall.
B)negative; when future prices are expected to fall, current demand will rise.
C)positive; when future prices are expected to rise, current demand will rise.
D)positive; future prices are generally expected to rise.
A)negative; when future prices are expected to rise, current demand will fall.
B)negative; when future prices are expected to fall, current demand will rise.
C)positive; when future prices are expected to rise, current demand will rise.
D)positive; future prices are generally expected to rise.
Unlock Deck
Unlock for access to all 165 flashcards in this deck.
Unlock Deck
k this deck
73
A product that can have congestion effects is
A)Tripadvisor reviews.
B)Facebook.
C)roads.
D)Instagram.
A)Tripadvisor reviews.
B)Facebook.
C)roads.
D)Instagram.
Unlock Deck
Unlock for access to all 165 flashcards in this deck.
Unlock Deck
k this deck
74
A product with a network effect is
A)a drive-through window at a fast food restaurant.
B)a social media tool such as WeChat in China.
C)a broadband telecommunications network.
D)the customer service line at the Department of Motor Vehicles.
A)a drive-through window at a fast food restaurant.
B)a social media tool such as WeChat in China.
C)a broadband telecommunications network.
D)the customer service line at the Department of Motor Vehicles.
Unlock Deck
Unlock for access to all 165 flashcards in this deck.
Unlock Deck
k this deck
75
If Canadian consumers expect the value of the Canadian dollar to depreciate against the US dollar (the Canadian dollar becomes weaker against the dollar), what impact would we expect this to have on Canadians' demand for American made products?
A)The demand for American-made items would fall.
B)The demand for American-made items would not change.
C)The demand for American-made items would rise.
D)The demand for American-made items would double.
A)The demand for American-made items would fall.
B)The demand for American-made items would not change.
C)The demand for American-made items would rise.
D)The demand for American-made items would double.
Unlock Deck
Unlock for access to all 165 flashcards in this deck.
Unlock Deck
k this deck
76
If Canadian consumers expect the value of the Canadian dollar to rise against the US dollar, what impact would we expect this to have on Canadians' demand for American made products?
A)The demand for American-made items would fall.
B)The demand for American-made items would not change.
C)The demand for American-made items would rise.
D)The demand for American-made items would double.
A)The demand for American-made items would fall.
B)The demand for American-made items would not change.
C)The demand for American-made items would rise.
D)The demand for American-made items would double.
Unlock Deck
Unlock for access to all 165 flashcards in this deck.
Unlock Deck
k this deck
77
Due to uncertainty around Brexit, the value of the British pound has been falling against the Euro. How will this affect the demand for German goods in the UK?
A)The demand for German goods would increase.
B)The demand for German goods would not change.
C)The demand for German goods would double.
D)The demand for German goods would fall.
A)The demand for German goods would increase.
B)The demand for German goods would not change.
C)The demand for German goods would double.
D)The demand for German goods would fall.
Unlock Deck
Unlock for access to all 165 flashcards in this deck.
Unlock Deck
k this deck
78
The table below shows data on quantity demanded for ATV tours at an ATV excursion company in Bali. In June, many new tourists arrive in Bali and the additional demand from these tourists is indicated in the table. Which of the following is true about the market for ATV tours in June?
A)At a price of $149, the total market demand for ATV tours in June is 933.
B)At a price of $99, the total market demand for ATV tours in June is 272.
C)At a price of $189, the total market demand for ATV tours in June is 459.
D)At a price of $119, the total market demand for ATV tours in June is 245.
Unlock Deck
Unlock for access to all 165 flashcards in this deck.
Unlock Deck
k this deck
79
(Figure: Market for Tourism) A hotel in Cape Cod, Massachusetts, is completely booked during August. However, in September, tourism drops significantly and some hotel rooms remain empty. Which of the graphs depicts this scenario?
A)Graph A
B)Graph B
C)Graph C
D)Graph D
A)Graph A
B)Graph B
C)Graph C
D)Graph D
Unlock Deck
Unlock for access to all 165 flashcards in this deck.
Unlock Deck
k this deck
80
The table shows data on quantity demanded for college textbooks in June. In August, the new incoming freshmen join the university. The additional demand for college textbooks in August is shown in the last column of the table. Which of the following is true about the market for textbooks in August?
A)At a price of $75, the total market demand for textbooks in August is 2700.
B)At a price of $99, the total market demand for textbooks in August is 1050.
C)At a price of $149, the total market demand for textbooks in August is 417.
D)At a price of $300, the total market demand for textbooks in August is 967.
Unlock Deck
Unlock for access to all 165 flashcards in this deck.
Unlock Deck
k this deck
Unlock Deck
Unlock for access to all 165 flashcards in this deck.


